State-Level Fertility Distributions
Tina Lasisi
2026-04-24 15:45:47
Last updated: 2026-04-24
Checks: 6 1
Knit directory: USC-QCB-IPUMS/
This reproducible R Markdown analysis was created with workflowr (version 1.7.1). The Checks tab describes the reproducibility checks that were applied when the results were created. The Past versions tab lists the development history.
Great! Since the R Markdown file has been committed to the Git repository, you know the exact version of the code that produced these results.
Great job! The global environment was empty. Objects defined in the global environment can affect the analysis in your R Markdown file in unknown ways. For reproduciblity it’s best to always run the code in an empty environment.
The command set.seed(20230130) was run prior to running
the code in the R Markdown file. Setting a seed ensures that any results
that rely on randomness, e.g. subsampling or permutations, are
reproducible.
Great job! Recording the operating system, R version, and package versions is critical for reproducibility.
- load-data
To ensure reproducibility of the results, delete the cache directory
state_fertility_cache and re-run the analysis. To have
workflowr automatically delete the cache directory prior to building the
file, set delete_cache = TRUE when running
wflow_build() or wflow_publish().
Great job! Using relative paths to the files within your workflowr project makes it easier to run your code on other machines.
Great! You are using Git for version control. Tracking code development and connecting the code version to the results is critical for reproducibility.
The results in this page were generated with repository version 5634d2b. See the Past versions tab to see a history of the changes made to the R Markdown and HTML files.
Note that you need to be careful to ensure that all relevant files for
the analysis have been committed to Git prior to generating the results
(you can use wflow_publish or
wflow_git_commit). workflowr only checks the R Markdown
file, but you know if there are other scripts or data files that it
depends on. Below is the status of the Git repository when the results
were generated:
Ignored files:
    Ignored:    .DS_Store
    Ignored:    .Rhistory
    Ignored:    .Rproj.user/
    Ignored:    analysis/hunt_paper2_figures_cache/
    Ignored:    analysis/state_fertility_cache/

Untracked files:
    Untracked:  Rplots.pdf
    Untracked:  analysis/hunt_paper2_figures.Rmd

Unstaged changes:
    Modified:   .claude/settings.local.json
Note that any generated files, e.g. HTML, png, CSS, etc., are not included in this status report because it is ok for generated content to have uncommitted changes.
These are the previous versions of the repository in which changes were
made to the R Markdown (analysis/state_fertility.Rmd) and
HTML (docs/state_fertility.html) files. If you’ve
configured a remote Git repository (see ?wflow_git_remote),
click on the hyperlinks in the table below to view the files as they
were in that past version.
| File | Version | Author | Date | Message |
|---|---|---|---|---|
| Rmd | 5634d2b | Tina Lasisi | 2026-04-16 | updated plots |
| html | 5634d2b | Tina Lasisi | 2026-04-16 | updated plots |
| Rmd | 61c2f18 | Tina Lasisi | 2026-04-14 | Update state_fertility.Rmd |
| html | 027da76 | Tina Lasisi | 2026-04-14 | updated figures |
| Rmd | 71cf78a | Tina Lasisi | 2026-04-14 | updated figures |
| html | 71cf78a | Tina Lasisi | 2026-04-14 | updated figures |
| Rmd | 39a5a72 | Tina Lasisi | 2026-04-14 | Update state_fertility.Rmd |
| html | 34bd822 | Tina Lasisi | 2026-04-14 | Update plots |
| Rmd | 1439d7c | Tina Lasisi | 2026-04-14 | Update state_fertility.Rmd |
| Rmd | 9ef76c8 | Tina Lasisi | 2026-04-14 | Update state_fertility.Rmd |
| Rmd | 9d44b29 | Tina Lasisi | 2026-04-14 | updated figures etc |
| html | 9d44b29 | Tina Lasisi | 2026-04-14 | updated figures etc |
| Rmd | 79eb4de | Tina Lasisi | 2026-04-14 | added birth cohort stability analysis |
| html | 79eb4de | Tina Lasisi | 2026-04-14 | added birth cohort stability analysis |
| html | df537cf | Tina Lasisi | 2026-04-14 | Build site. |
| Rmd | bede61f | Tina Lasisi | 2026-04-14 | State by state figures added |
| html | bede61f | Tina Lasisi | 2026-04-14 | State by state figures added |
Introduction
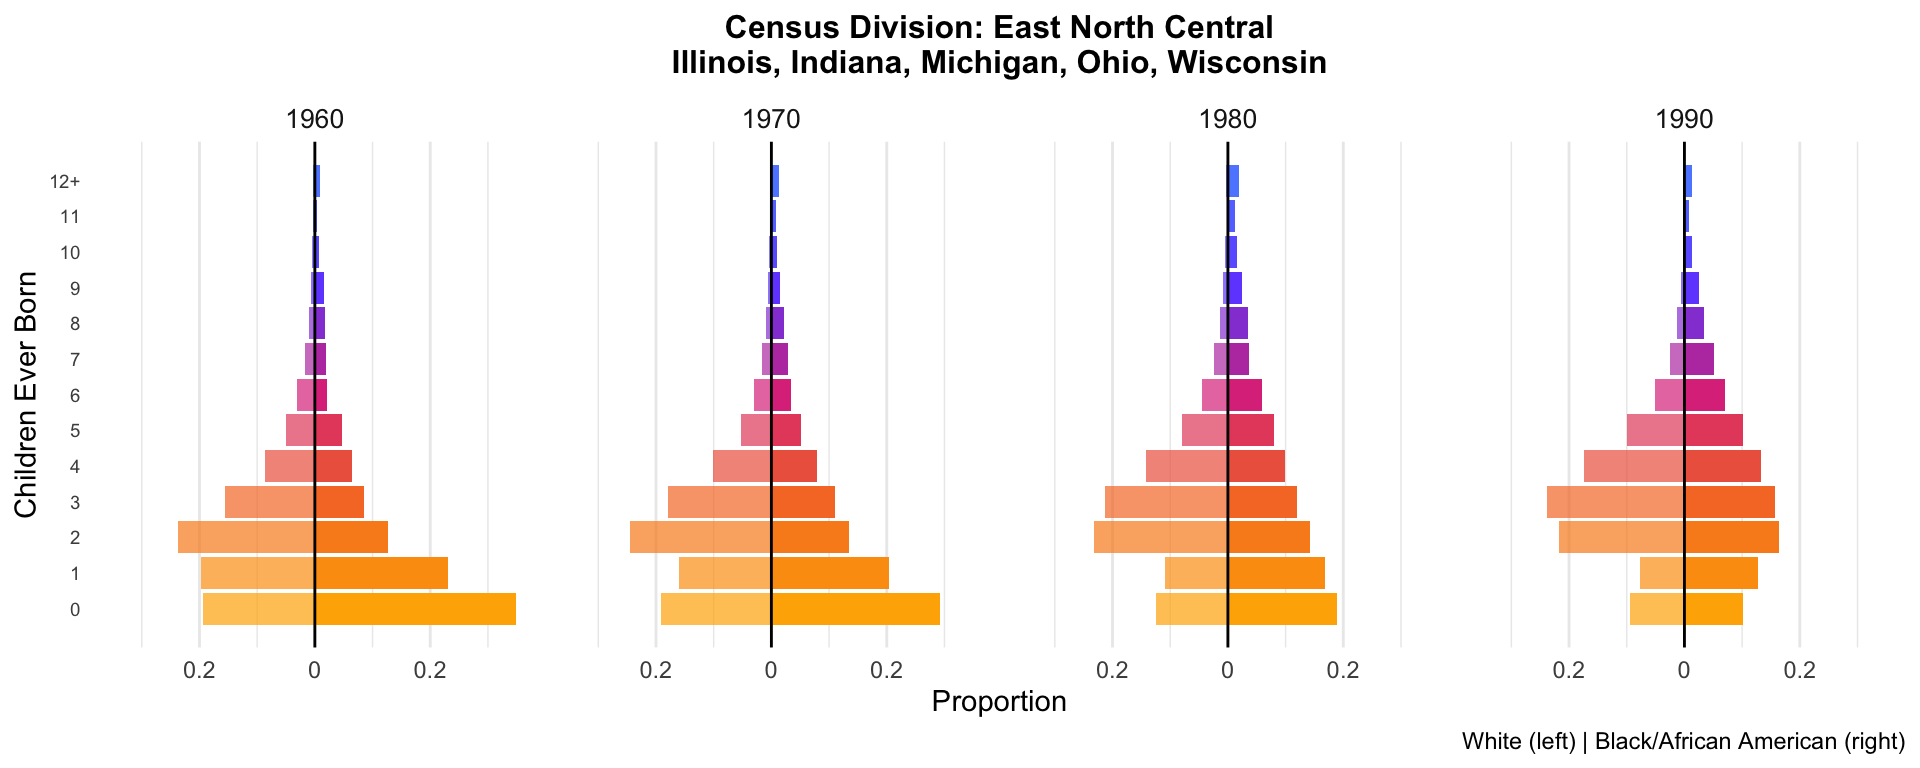
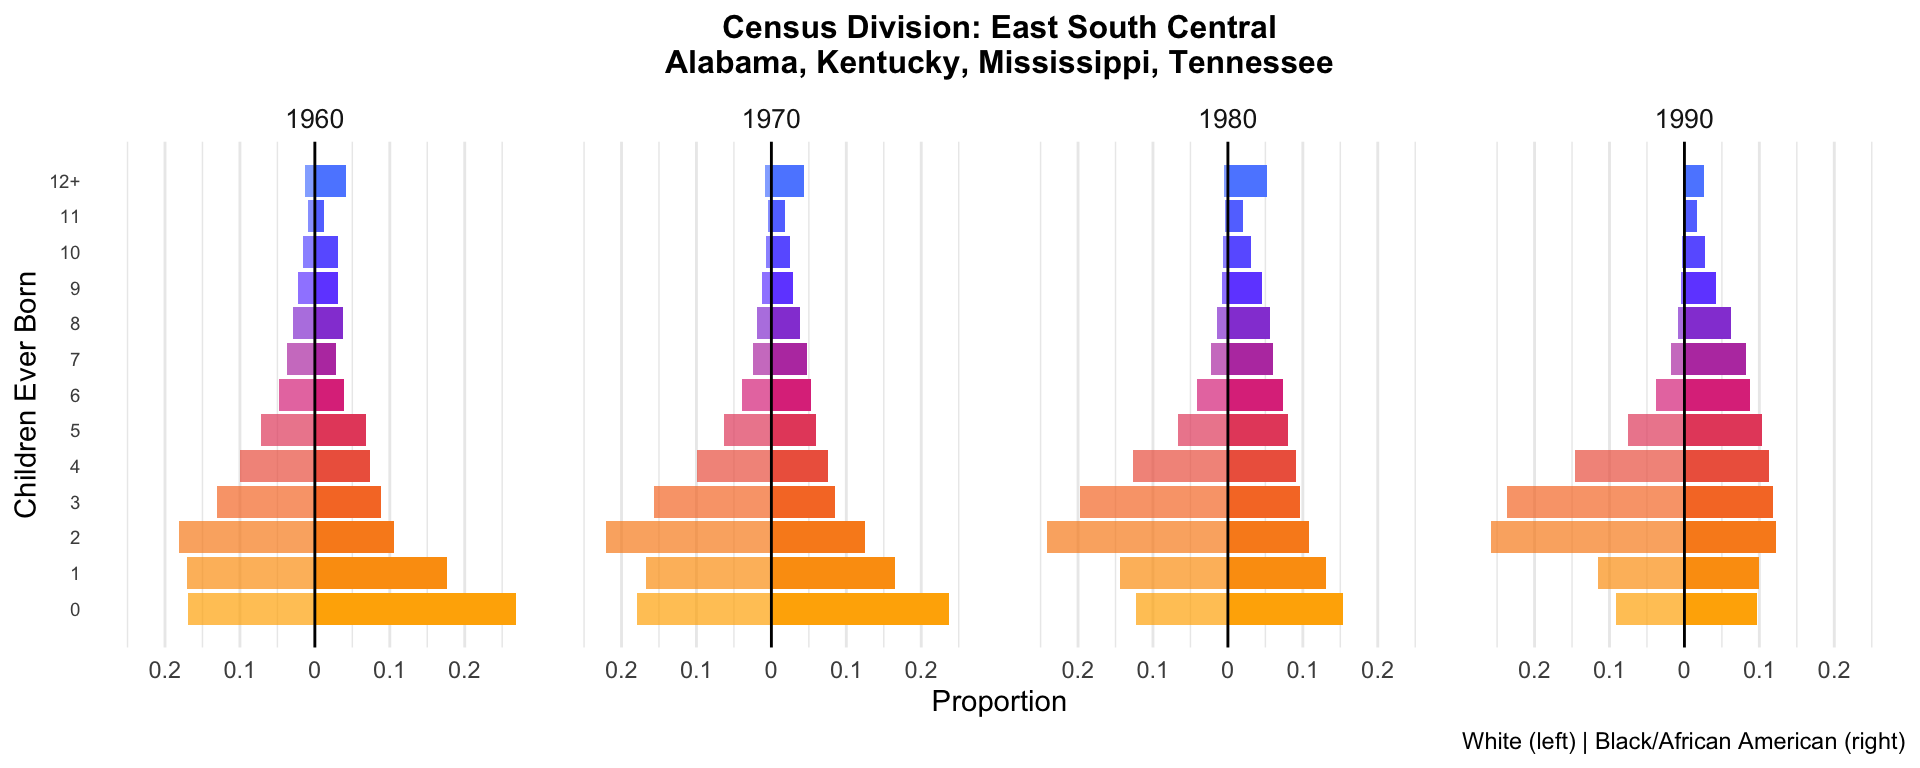
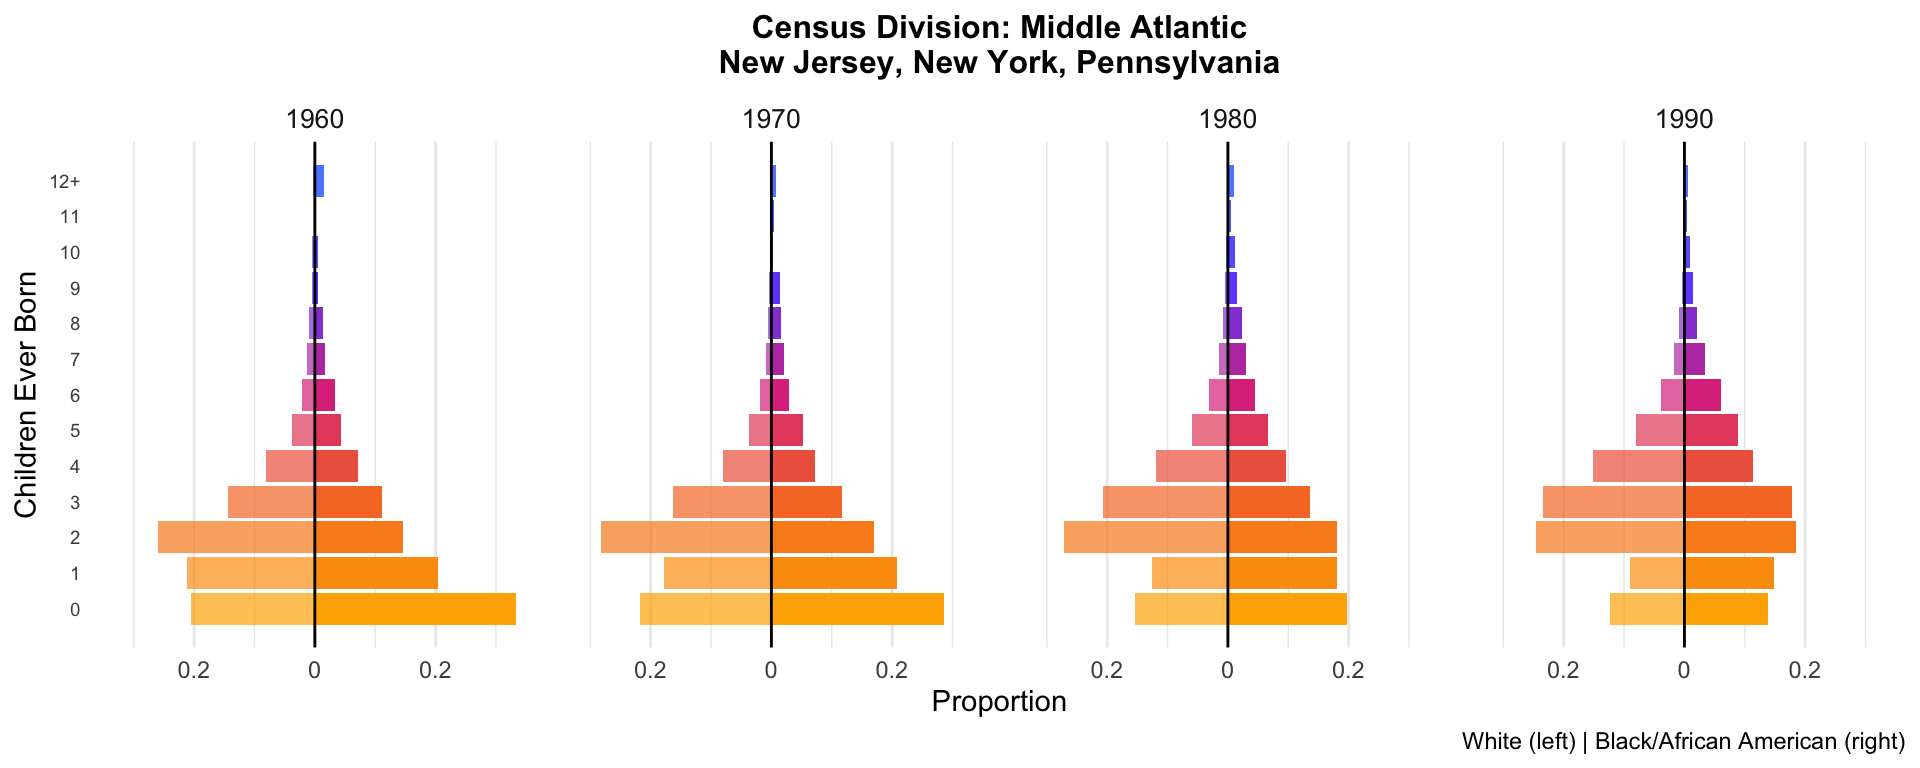
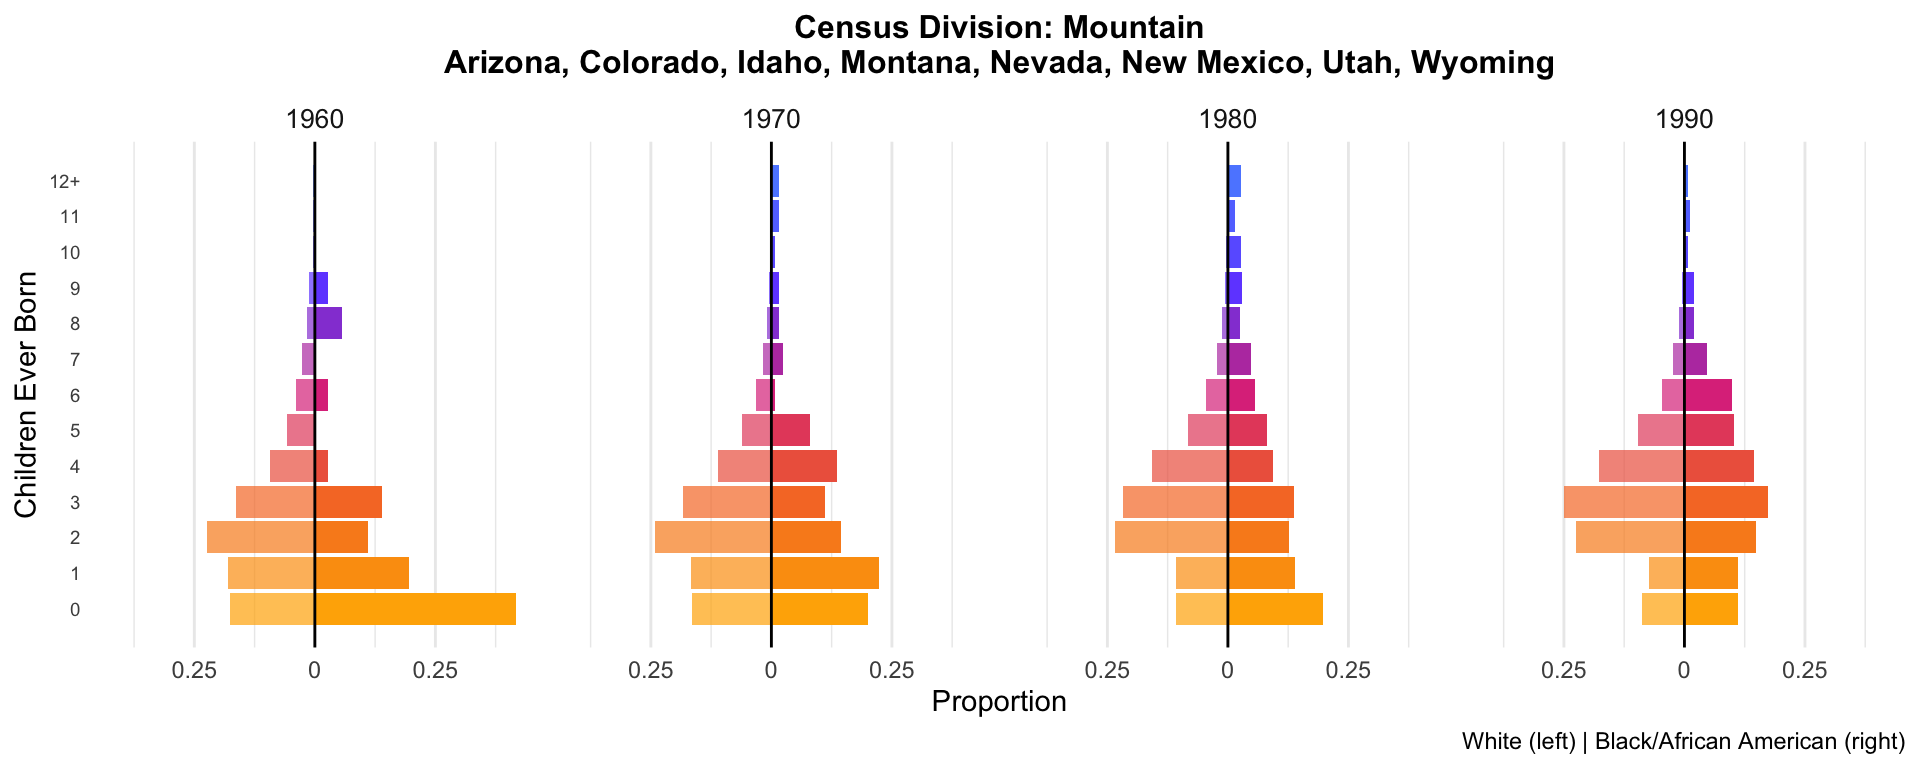
This analysis extends the national-level fertility distribution analysis to the state level, using IPUMS USA Census microdata (1960–1990, 1% samples). We produce choropleth maps of mean and variance in children ever born by state, race, and census year, followed by per-state mirrored bar charts for states with adequate sample sizes.
library(ipumsr)
library(tidyverse)
library(data.table)
library(usmap)
library(viridis)
library(patchwork)
library(scales)
library(ggrepel)

source("code/utils_fertility.R")
1. Load and process data
Update the DDI filename below to match your state-level extract
(e.g., usa_00007.xml). Run
code/get_state_extract.R first to download the extract.
# UPDATE this filename to match your downloaded extract
extract_name <- "usa_00007"

setwd("data")
ddi <- read_ipums_ddi(paste0(extract_name, ".xml"))
data_raw <- read_ipums_micro(ddi)
Use of data from IPUMS USA is subject to conditions including that users should cite the data appropriately. Use command `ipums_conditions()` for more details.setwd("../")
cat("Raw data dimensions:", nrow(data_raw), "rows x", ncol(data_raw), "cols\n")Raw data dimensions: 29704073 rows x 19 colsdata <- data_raw %>%
prepare_ipums_labels() %>%
filter_fertility_sample() %>%
recode_chborn() %>%
add_age_range() %>%
filter(AGE_RANGE == "50-59")
# Cap children at 12 for display
data <- data %>%
mutate(chborn_capped = pmin(chborn_num, 12))
# Extract state name from STATEFIP factor labels
data <- data %>%
mutate(state_name = as.character(STATEFIP))
cat("Filtered data dimensions:", nrow(data), "rows\n")Filtered data dimensions: 1405711 rowscat("States:", n_distinct(data$state_name), "\n")States: 51 cat("Years:", sort(unique(data$YEAR)), "\n")Years: 1960 1970 1980 1990 2. Sample size diagnostics
With 1% samples, some state-race-year cells will have very few observations, especially for Black/African American populations in states with small minority populations. We flag cells with n < 30 and suppress those with n < 10.
cell_sizes <- data %>%
  count(state_name, RACE, YEAR, name = "n_obs") %>%
  mutate(
    flag = case_when(
      n_obs < 10  ~ "suppress",
      n_obs < 30  ~ "caution",
      TRUE        ~ "ok"
    )
  )

# Summary of flagged cells
cat("Cell size summary:\n")
Cell size summary:cell_sizes %>%
count(RACE, flag) %>%
pivot_wider(names_from = flag, values_from = n, values_fill = 0) %>%
print()# A tibble: 2 × 4
RACE ok caution suppress
<fct> <int> <int> <int>
1 White 204 0 0
2 Black/African American 141 17 29cell_sizes %>%
mutate(
n_obs_log = log10(n_obs + 1),
text_color = if_else(n_obs_log < median(log10(n_obs + 1)), "white", "black")
) %>%
ggplot(aes(x = as.factor(YEAR), y = reorder(state_name, state_name), fill = n_obs_log)) +
geom_tile(color = "white", linewidth = 0.2) +
facet_wrap(~ RACE) +
scale_fill_viridis(option = "magma", name = "log10(n)") +
scale_color_identity() +
labs(
title = "Sample Sizes by State, Race, and Census Year",
subtitle = "Non-Hispanic women aged 40+, 1% samples",
x = "Census Year",
y = NULL
) +
theme_minimal() +
theme(
axis.text.y = element_text(size = 6),
strip.text = element_text(size = 11, face = "bold")
)Warning in mean.default(X[[i]], ...): argument is not numeric or logical:
returning NA
Warning in mean.default(X[[i]], ...): argument is not numeric or logical:
returning NA
Warning in mean.default(X[[i]], ...): argument is not numeric or logical:
returning NA
Warning in mean.default(X[[i]], ...): argument is not numeric or logical:
returning NA
Warning in mean.default(X[[i]], ...): argument is not numeric or logical:
returning NA
Warning in mean.default(X[[i]], ...): argument is not numeric or logical:
returning NA
Warning in mean.default(X[[i]], ...): argument is not numeric or logical:
returning NA
Warning in mean.default(X[[i]], ...): argument is not numeric or logical:
returning NA
Warning in mean.default(X[[i]], ...): argument is not numeric or logical:
returning NA
Warning in mean.default(X[[i]], ...): argument is not numeric or logical:
returning NA
Warning in mean.default(X[[i]], ...): argument is not numeric or logical:
returning NA
Warning in mean.default(X[[i]], ...): argument is not numeric or logical:
returning NA
Warning in mean.default(X[[i]], ...): argument is not numeric or logical:
returning NA
Warning in mean.default(X[[i]], ...): argument is not numeric or logical:
returning NA
Warning in mean.default(X[[i]], ...): argument is not numeric or logical:
returning NA
Warning in mean.default(X[[i]], ...): argument is not numeric or logical:
returning NA
Warning in mean.default(X[[i]], ...): argument is not numeric or logical:
returning NA
Warning in mean.default(X[[i]], ...): argument is not numeric or logical:
returning NA
Warning in mean.default(X[[i]], ...): argument is not numeric or logical:
returning NA
Warning in mean.default(X[[i]], ...): argument is not numeric or logical:
returning NA
Warning in mean.default(X[[i]], ...): argument is not numeric or logical:
returning NA
Warning in mean.default(X[[i]], ...): argument is not numeric or logical:
returning NA
Warning in mean.default(X[[i]], ...): argument is not numeric or logical:
returning NA
Warning in mean.default(X[[i]], ...): argument is not numeric or logical:
returning NA
Warning in mean.default(X[[i]], ...): argument is not numeric or logical:
returning NA
Warning in mean.default(X[[i]], ...): argument is not numeric or logical:
returning NA
Warning in mean.default(X[[i]], ...): argument is not numeric or logical:
returning NA
Warning in mean.default(X[[i]], ...): argument is not numeric or logical:
returning NA
Warning in mean.default(X[[i]], ...): argument is not numeric or logical:
returning NA
Warning in mean.default(X[[i]], ...): argument is not numeric or logical:
returning NA
Warning in mean.default(X[[i]], ...): argument is not numeric or logical:
returning NA
Warning in mean.default(X[[i]], ...): argument is not numeric or logical:
returning NA
Warning in mean.default(X[[i]], ...): argument is not numeric or logical:
returning NA
Warning in mean.default(X[[i]], ...): argument is not numeric or logical:
returning NA
Warning in mean.default(X[[i]], ...): argument is not numeric or logical:
returning NA
Warning in mean.default(X[[i]], ...): argument is not numeric or logical:
returning NA
Warning in mean.default(X[[i]], ...): argument is not numeric or logical:
returning NA
Warning in mean.default(X[[i]], ...): argument is not numeric or logical:
returning NA
Warning in mean.default(X[[i]], ...): argument is not numeric or logical:
returning NA
Warning in mean.default(X[[i]], ...): argument is not numeric or logical:
returning NA
Warning in mean.default(X[[i]], ...): argument is not numeric or logical:
returning NA
Warning in mean.default(X[[i]], ...): argument is not numeric or logical:
returning NA
Warning in mean.default(X[[i]], ...): argument is not numeric or logical:
returning NA
Warning in mean.default(X[[i]], ...): argument is not numeric or logical:
returning NA
Warning in mean.default(X[[i]], ...): argument is not numeric or logical:
returning NA
Warning in mean.default(X[[i]], ...): argument is not numeric or logical:
returning NA
Warning in mean.default(X[[i]], ...): argument is not numeric or logical:
returning NA
Warning in mean.default(X[[i]], ...): argument is not numeric or logical:
returning NA
Warning in mean.default(X[[i]], ...): argument is not numeric or logical:
returning NA
Warning in mean.default(X[[i]], ...): argument is not numeric or logical:
returning NA
Warning in mean.default(X[[i]], ...): argument is not numeric or logical:
returning NA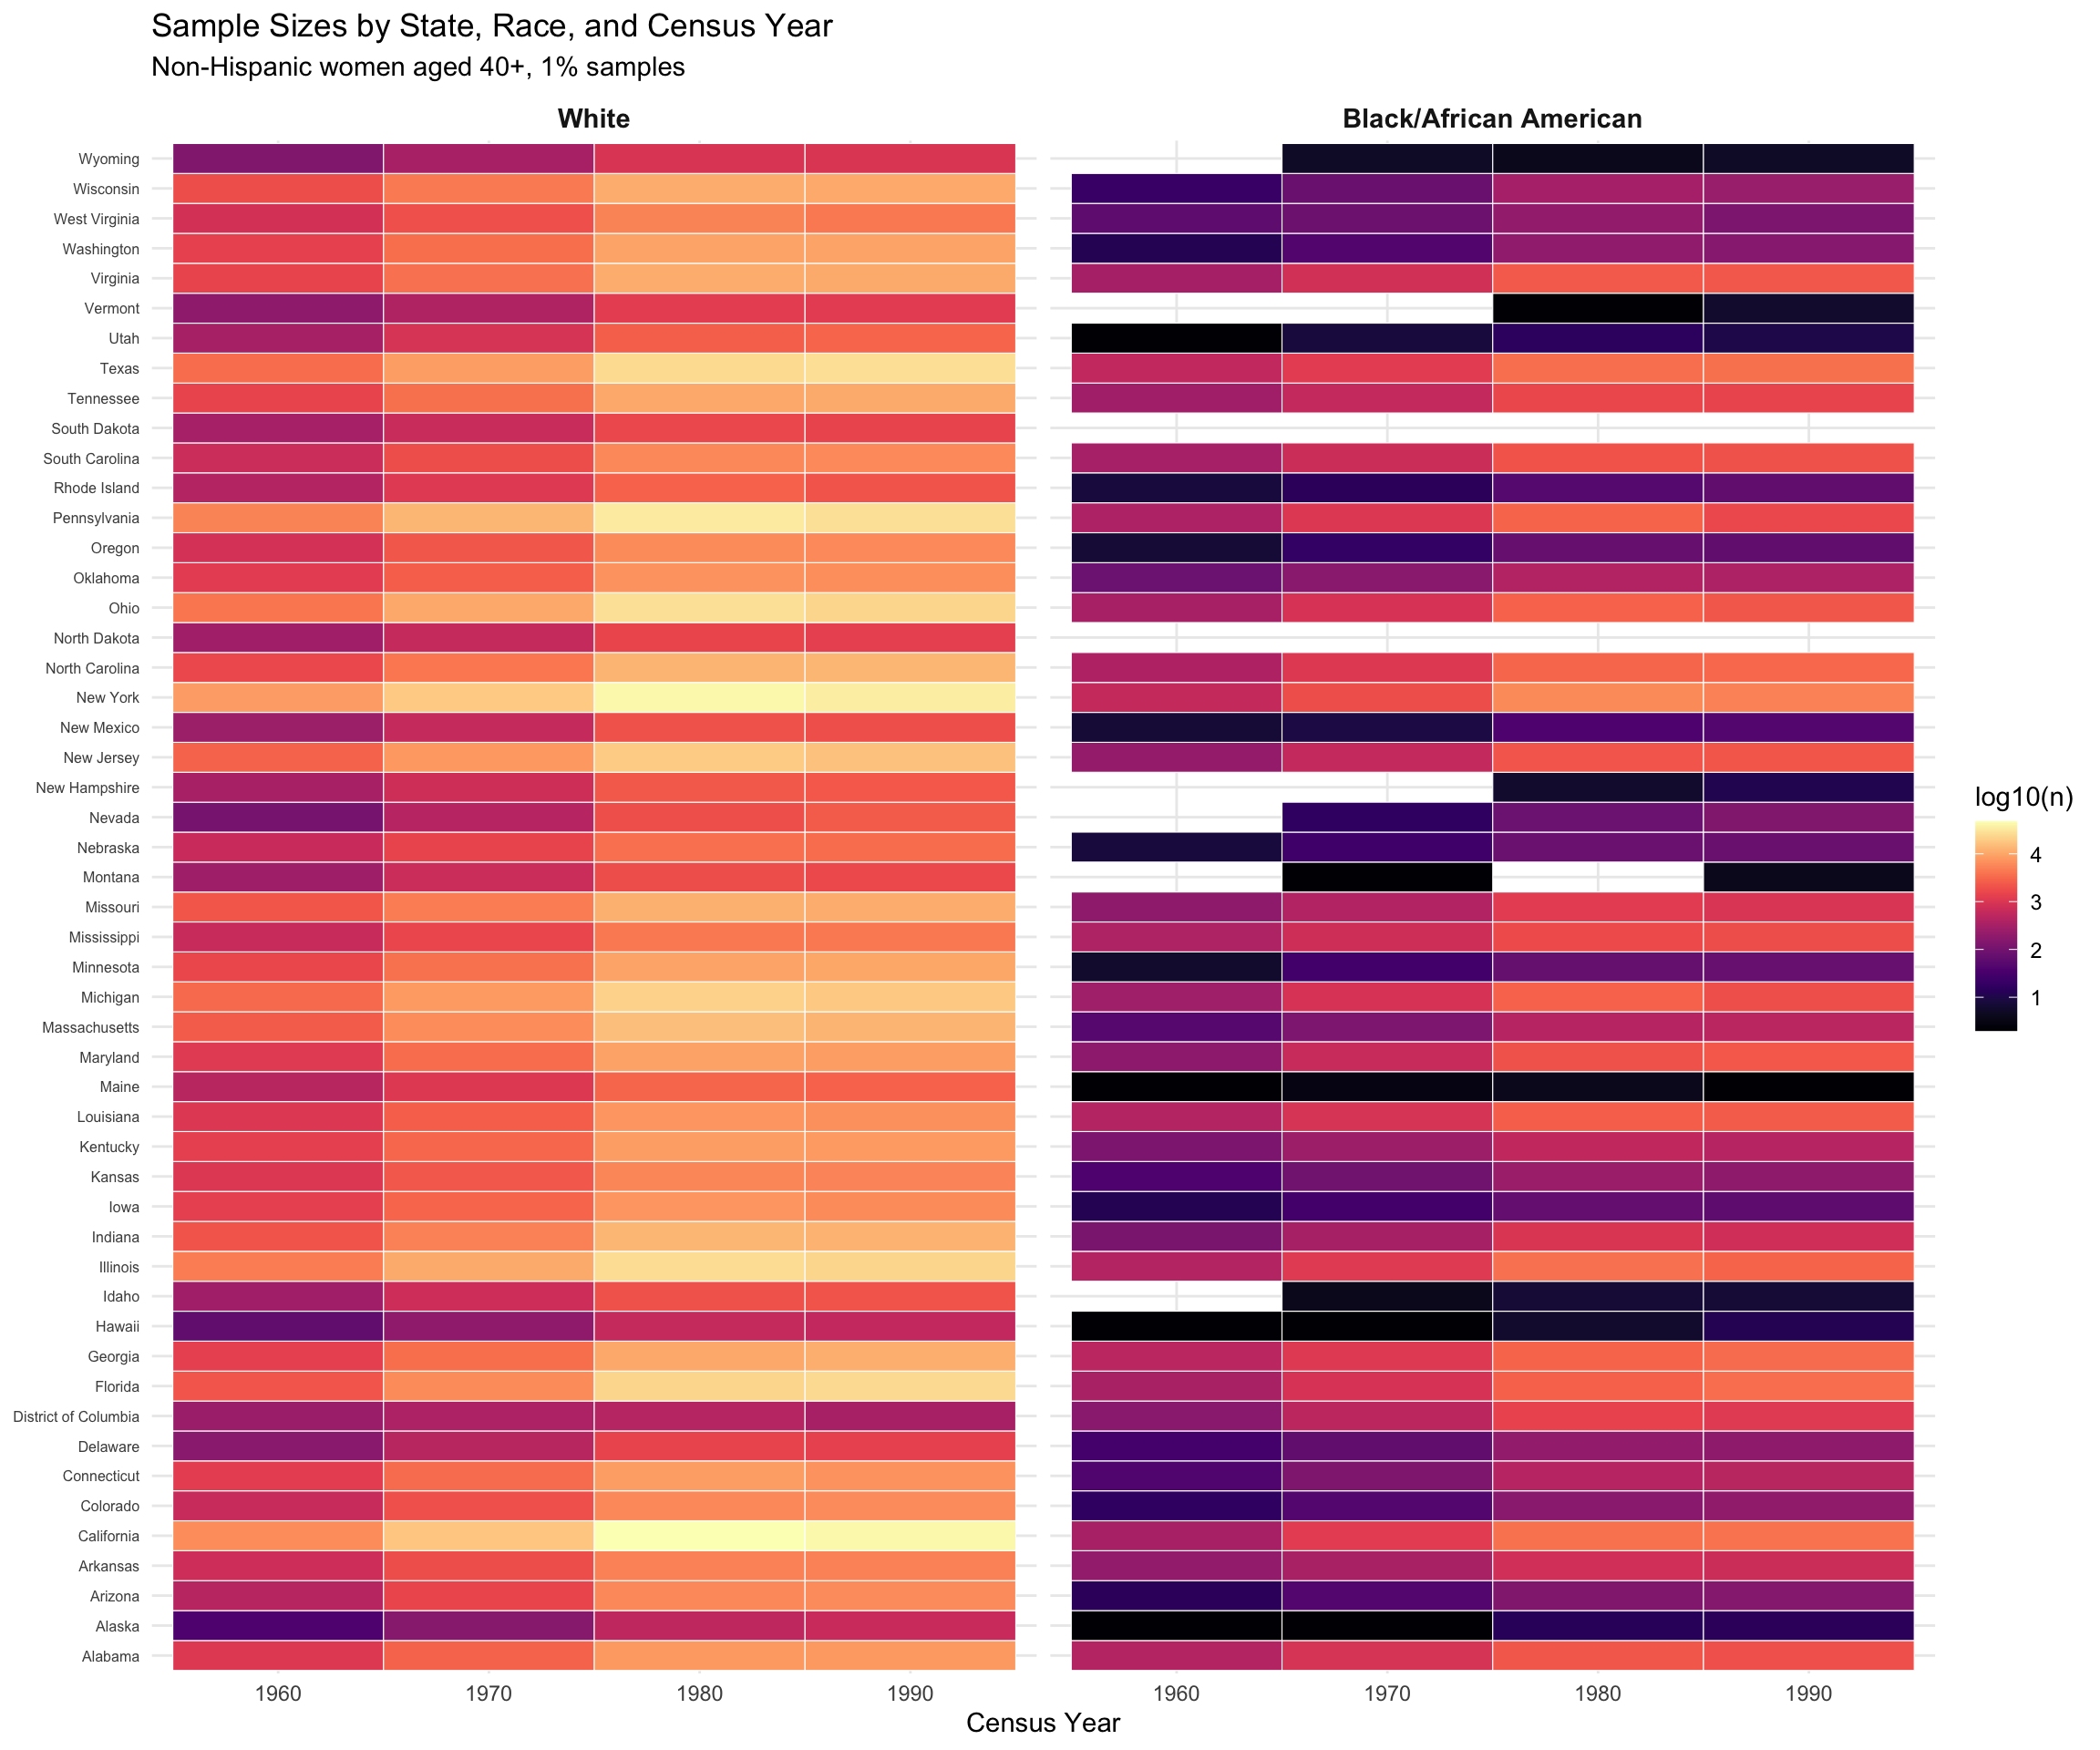
| Version | Author | Date |
|---|---|---|
| bede61f | Tina Lasisi | 2026-04-14 |
3. State-level summary statistics
state_stats <- data %>%
  group_by(state_name, RACE, YEAR) %>%
  summarise(
    n_obs       = n(),
    mean_chborn = weighted.mean(chborn_num, w = PERWT),
    var_chborn  = sum(PERWT * (chborn_num - weighted.mean(chborn_num, w = PERWT))^2) / sum(PERWT),
    .groups = "drop"
  ) %>%
  # Suppress small cells
  mutate(
    mean_chborn = if_else(n_obs < 10, NA_real_, mean_chborn),
    var_chborn  = if_else(n_obs < 10, NA_real_, var_chborn)
  )

# Preview
state_stats %>%
  filter(state_name %in% c("California", "New York", "Mississippi", "Vermont")) %>%
  arrange(state_name, RACE, YEAR) %>%
  print(n = 40)
# A tibble: 30 × 6
state_name RACE YEAR n_obs mean_chborn var_chborn
<chr> <fct> <int> <int> <dbl> <dbl>
1 California White 1960 6453 1.85 3.14
2 California White 1970 17561 2.04 2.94
3 California White 1980 47609 2.52 3.12
4 California White 1990 41672 2.62 2.77
5 California Black/African American 1960 327 2.09 7.00
6 California Black/African American 1970 1149 2.36 6.90
7 California Black/African American 1980 3801 3.00 7.58
8 California Black/African American 1990 3898 3.33 5.82
9 Mississippi White 1960 644 3.02 6.54
10 Mississippi White 1970 1515 2.56 4.53
11 Mississippi White 1980 4400 2.78 3.88
12 Mississippi White 1990 4376 2.83 2.89
13 Mississippi Black/African American 1960 378 3.46 12.5
14 Mississippi Black/African American 1970 756 3.99 14.5
15 Mississippi Black/African American 1980 1700 5.03 14.3
16 Mississippi Black/African American 1990 1827 4.99 11.1
17 New York White 1960 8287 1.95 3.16
18 New York White 1970 18882 1.98 2.97
19 New York White 1980 42030 2.47 3.47
20 New York White 1990 35522 2.68 3.38
21 New York Black/African American 1960 600 1.87 4.86
22 New York Black/African American 1970 1851 2.05 5.20
23 New York Black/African American 1980 6089 2.63 6.38
24 New York Black/African American 1990 5098 2.90 5.50
25 Vermont White 1960 184 2.69 7.13
26 Vermont White 1970 400 2.63 4.75
27 Vermont White 1980 1200 3.15 4.64
28 Vermont White 1990 1175 3.15 3.50
29 Vermont Black/African American 1980 1 NA NA
30 Vermont Black/African American 1990 5 NA NA 4. Choropleth maps: Mean children ever born
# usmap requires a 'fips' column or 'state' column
map_data_mean <- state_stats %>%
  rename(state = state_name)

plot_maps <- function(map_df, fill_var, title, caption = NULL, palette_option = "magma") {
  years <- sort(unique(map_df$YEAR))
  races <- c("White", "Black/African American")

  plots <- list()
  for (y in years) {
    for (r in races) {
      sub <- map_df %>% filter(RACE == r, YEAR == y)
      p <- plot_usmap(data = sub, values = fill_var, color = "grey70", linewidth = 0.2) +
        scale_fill_viridis(
          option = palette_option, na.value = "grey90",
          name = fill_var, limits = range(map_df[[fill_var]], na.rm = TRUE)
        ) +
        labs(title = paste(y, "-", r)) +
        theme(plot.title = element_text(size = 9, hjust = 0.5))
      plots <- c(plots, list(p))
    }
  }

  # columns = races (2), rows = years — landscape orientation
  wrap_plots(plots, ncol = length(races)) +
    plot_layout(guides = "collect") +
    plot_annotation(title = title, caption = caption) &
    theme(
      legend.position = "bottom",
      plot.title = element_text(size = 14, hjust = 0.5)
    )
}

plot_maps(map_data_mean, "mean_chborn",
          "Mean Children Ever Born by State, Race, and Census Year",
          caption = "Weighted mean of children ever born (CHBORN) among non-Hispanic White and Black/African American women aged 50–59. Rows = census year; columns = race group. Grey = insufficient data (n < 10). Source: IPUMS USA 1% samples.")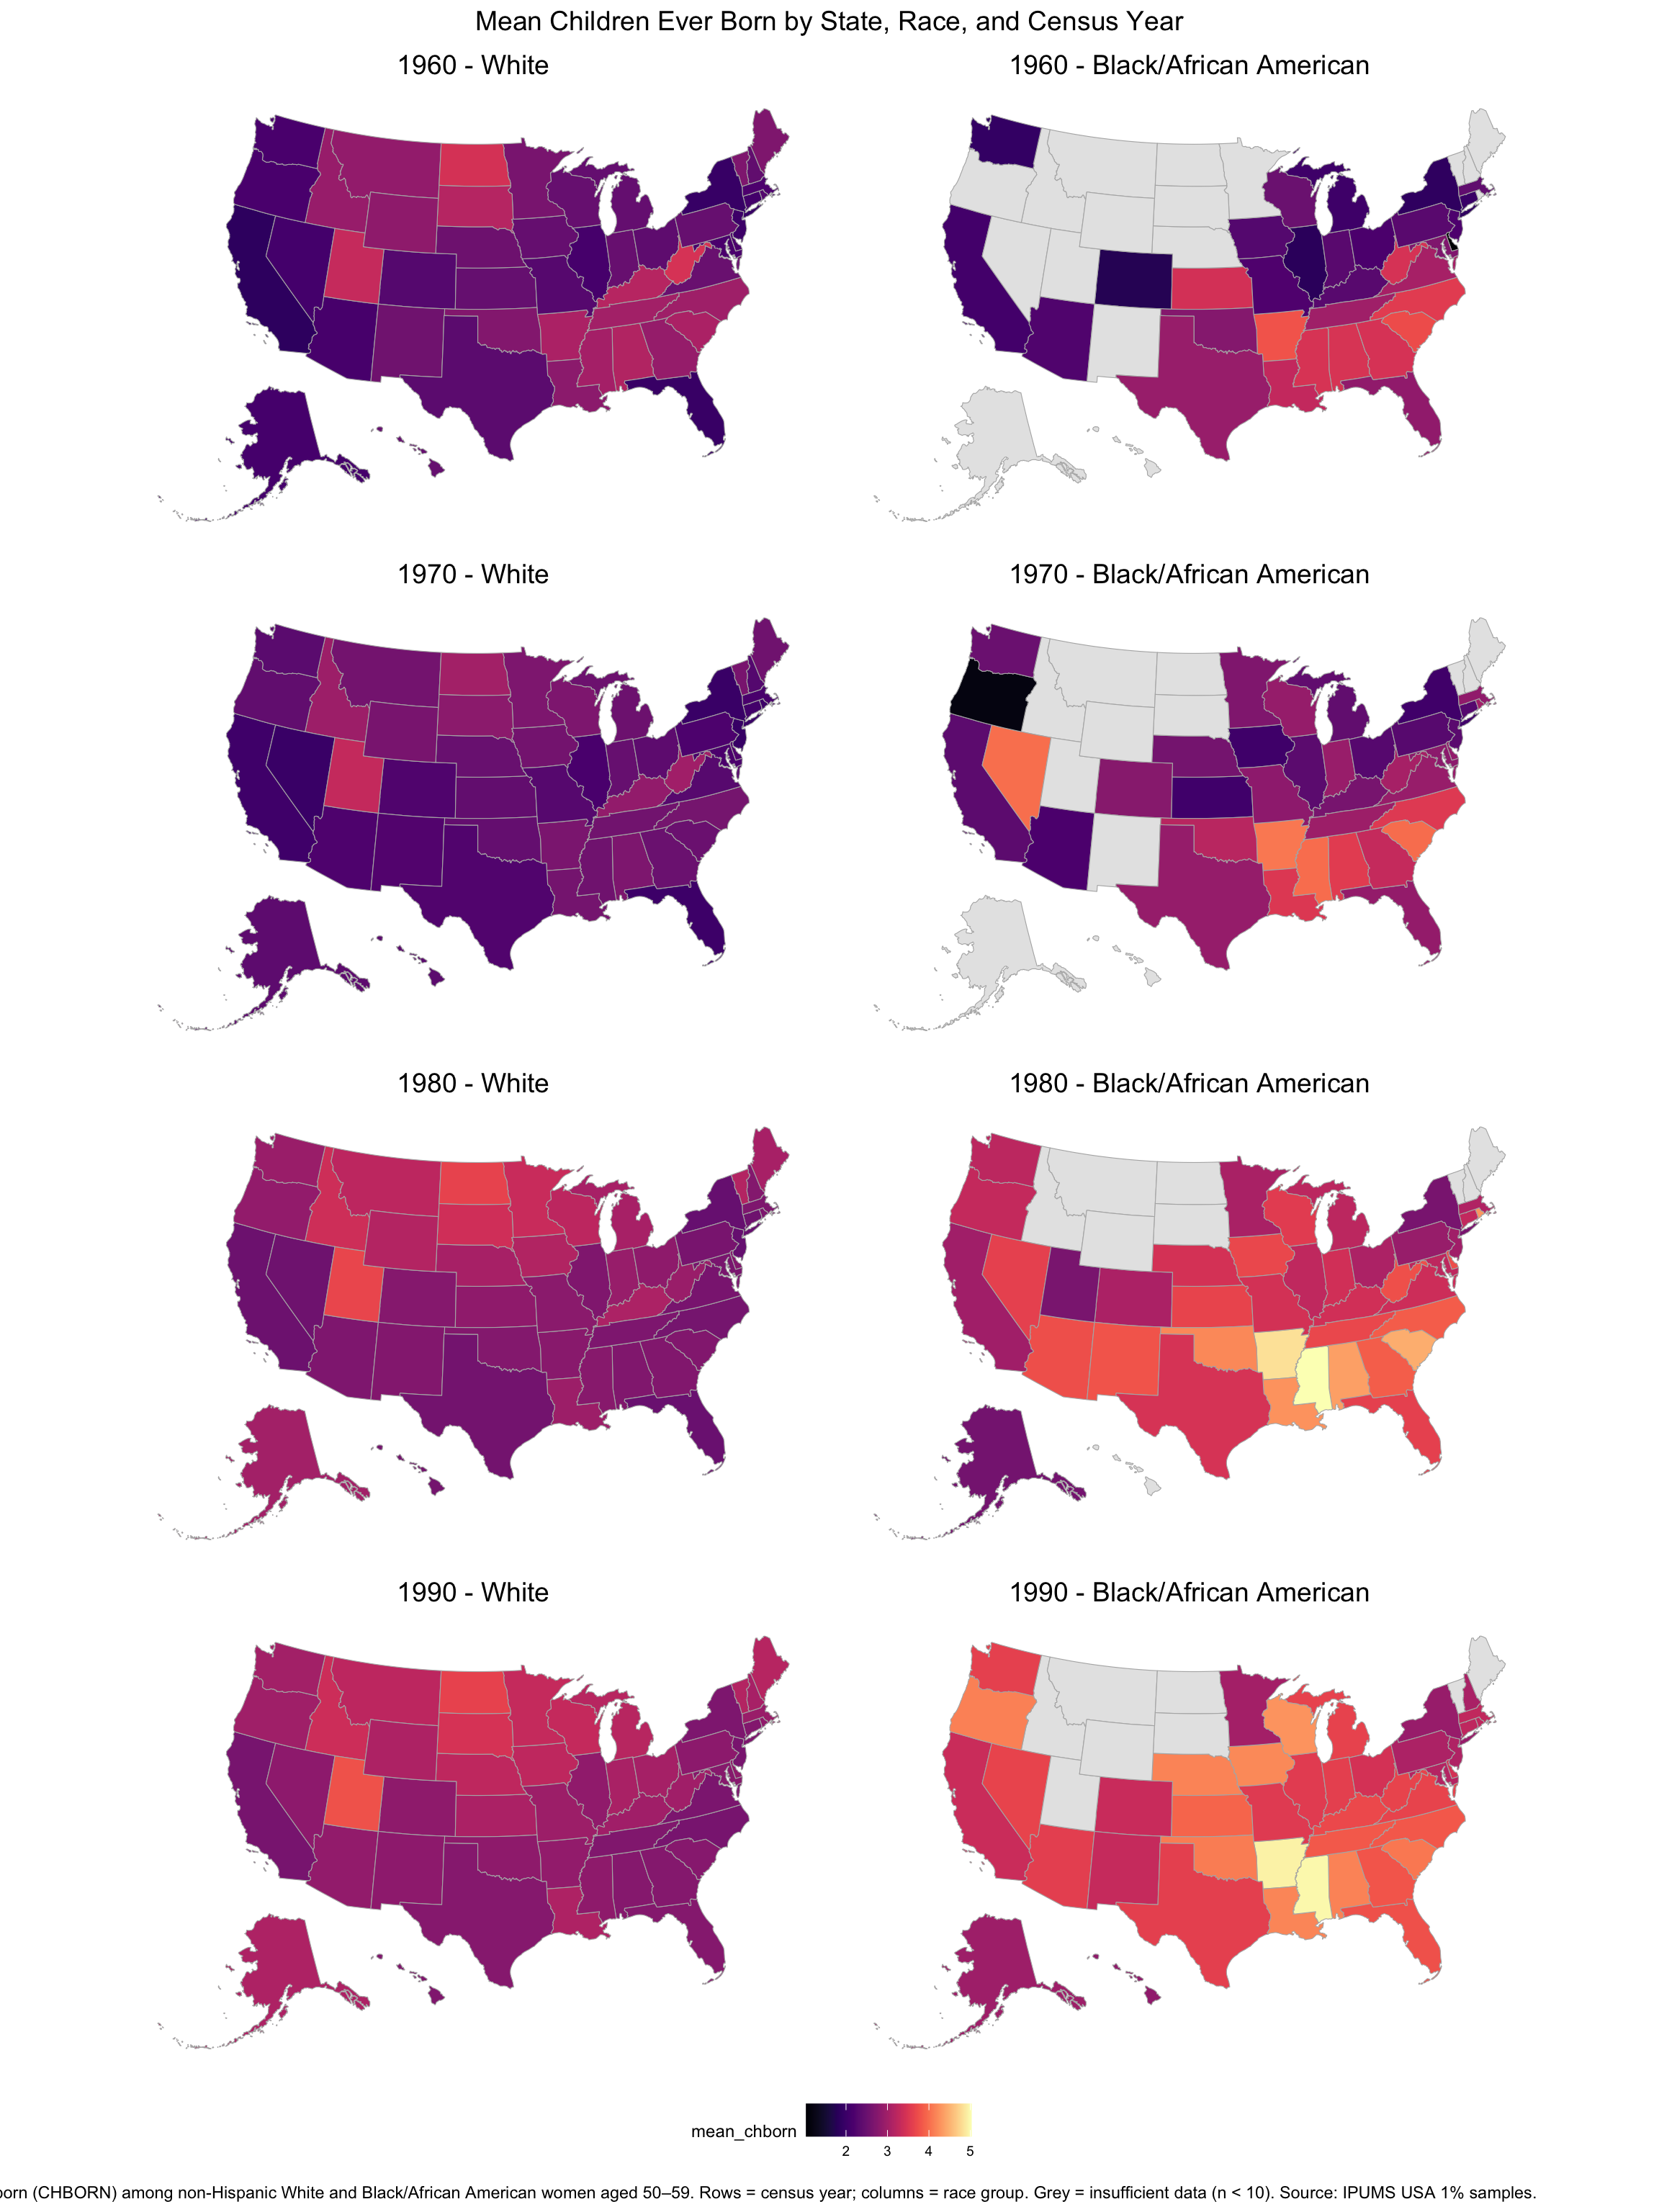
5. Choropleth maps: Variance in children ever born
plot_maps(map_data_mean, "var_chborn",
          "Variance in Children Ever Born by State, Race, and Census Year",
          caption = "Weighted variance of children ever born (CHBORN) among non-Hispanic White and Black/African American women aged 50–59. Higher values indicate greater spread in completed family sizes. Rows = census year; columns = race group. Grey = insufficient data (n < 10). Source: IPUMS USA 1% samples.",
          palette_option = "inferno")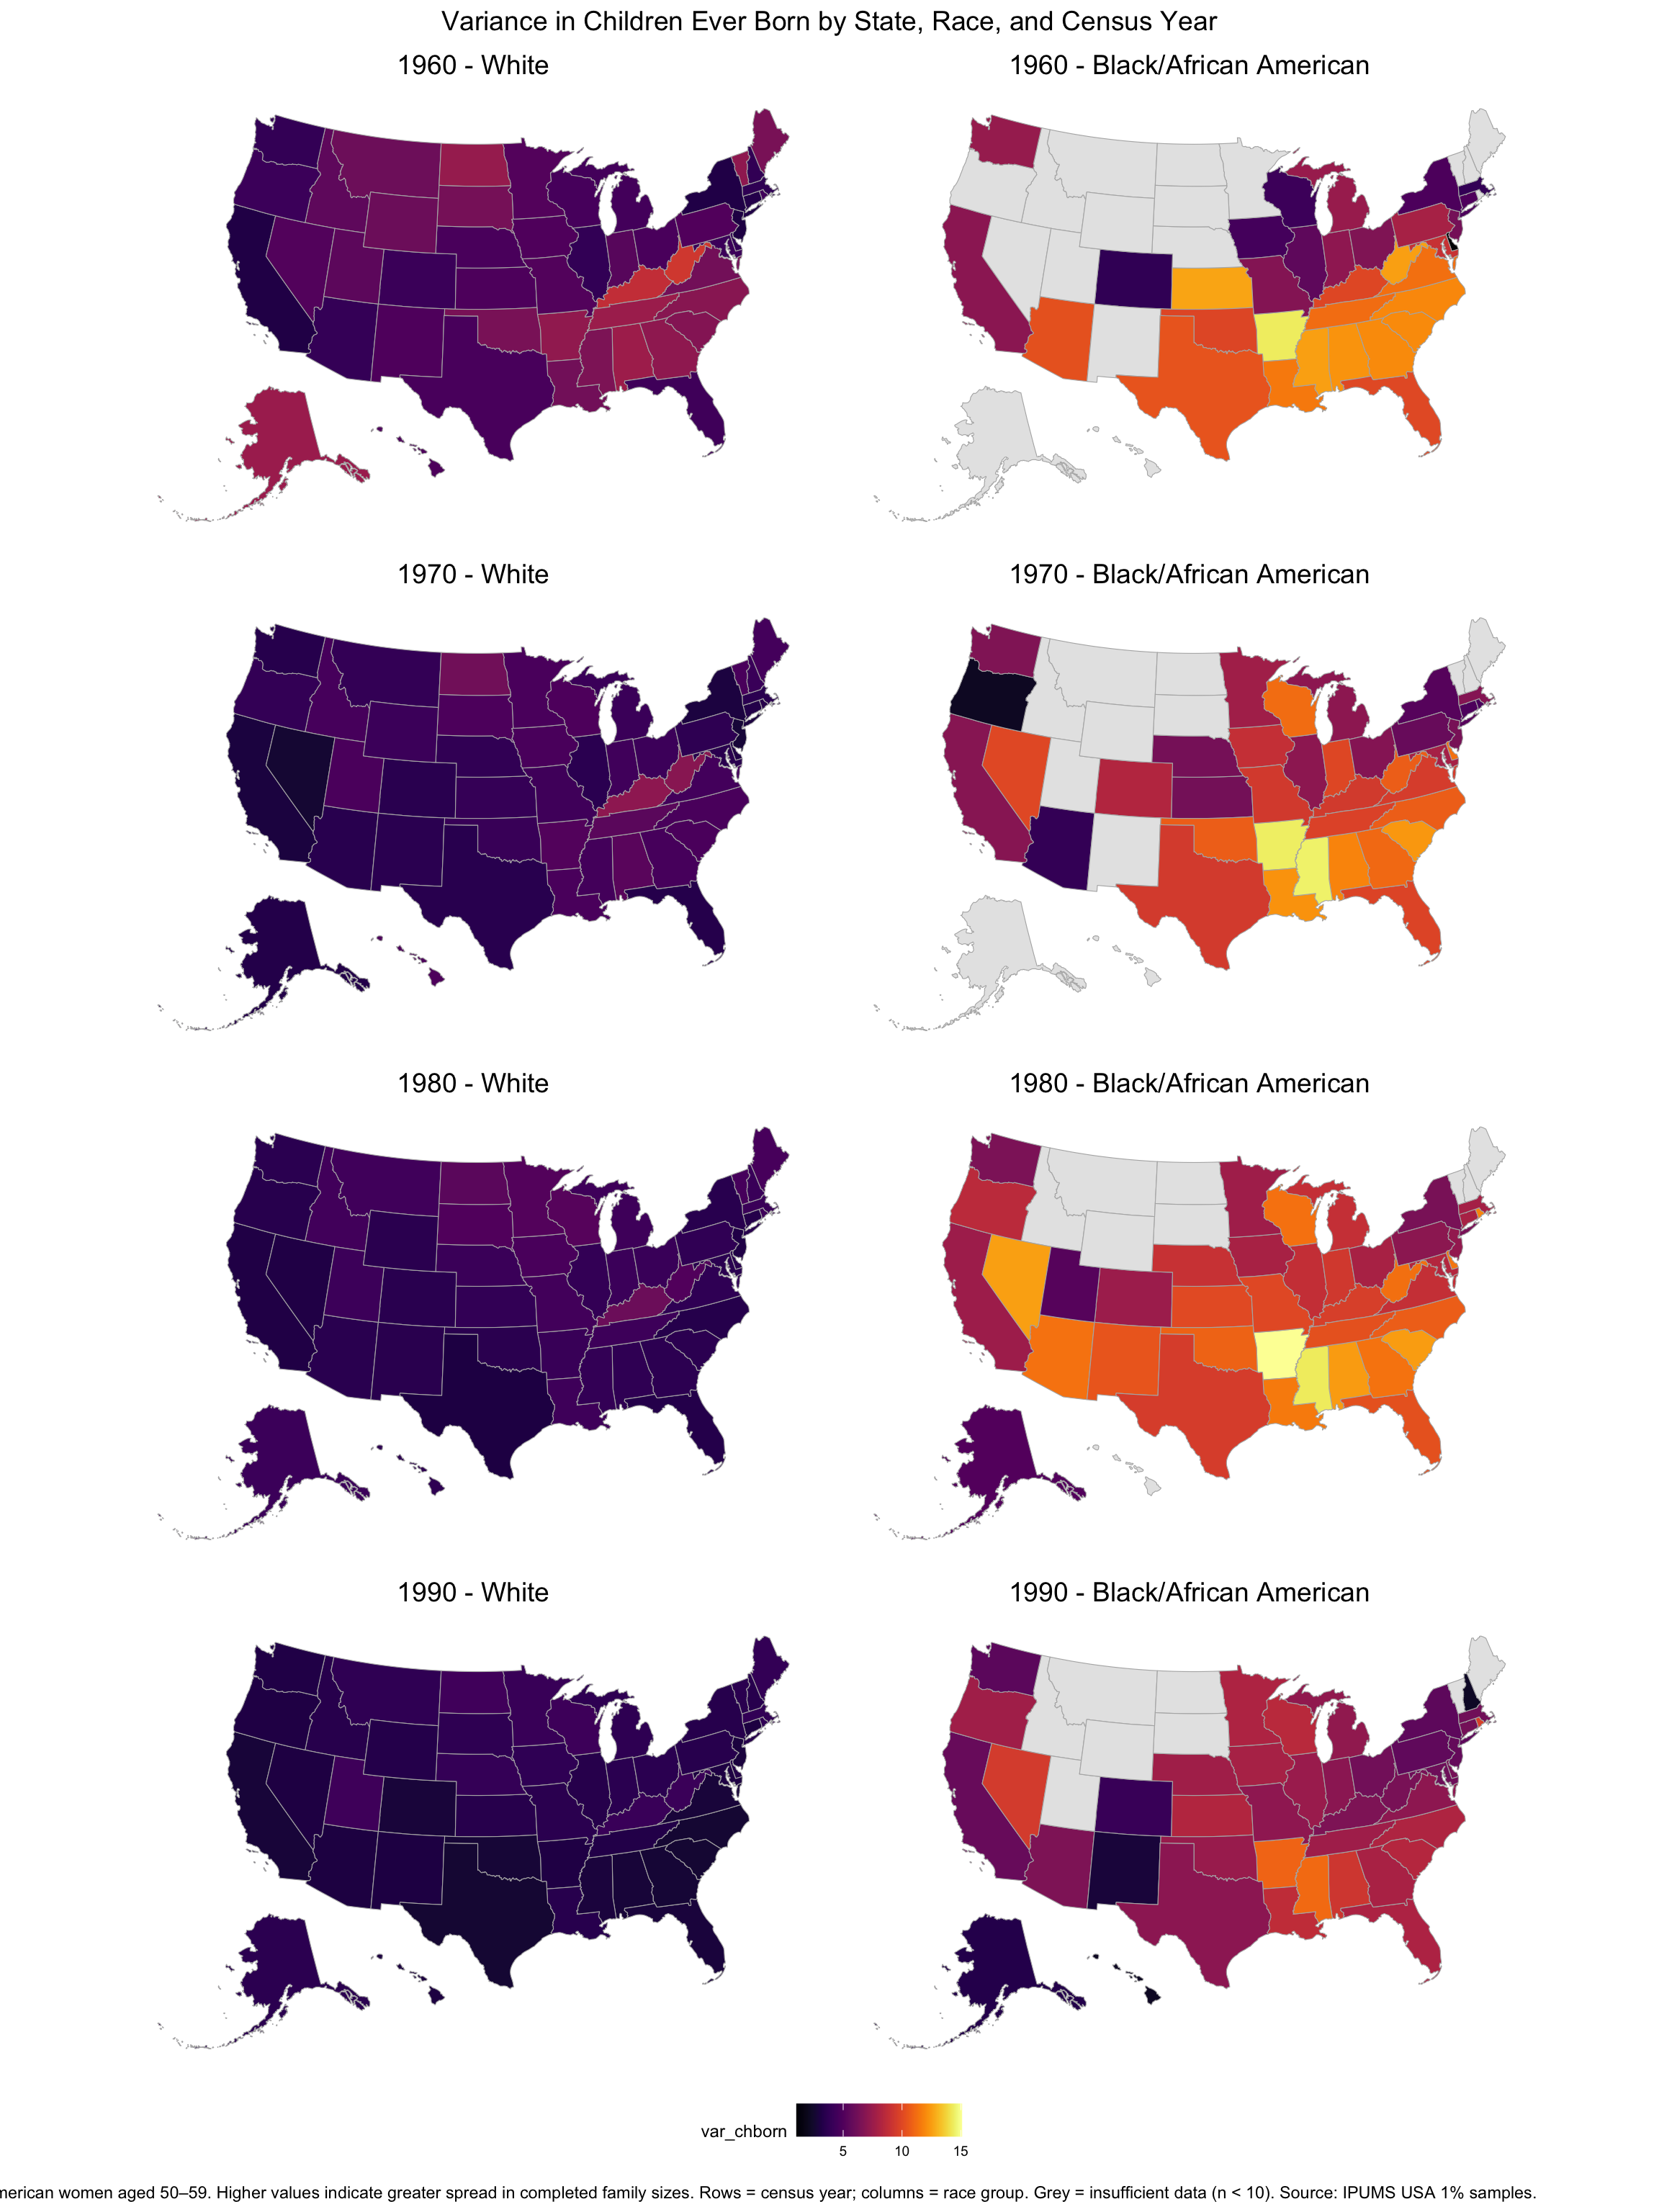
6. Choropleth maps: Zero inflation (proportion childless, age 50–59)
Women aged 50–59 have largely completed their fertility, making this age group a clean window onto childlessness patterns.
zero_inf_stats <- data %>%
  group_by(state_name, RACE, YEAR) %>%
  summarise(
    n_obs          = n(),
    n_zero_sample  = sum(chborn_num == 0),
    n_zero_pop     = sum(PERWT[chborn_num == 0]),
    n_total_pop    = sum(PERWT),
    prop_zero      = weighted.mean(chborn_num == 0, w = PERWT),
    .groups        = "drop"
  ) %>%
  mutate(across(c(n_zero_sample, n_zero_pop, n_total_pop, prop_zero),
                ~ if_else(n_obs < 10, NA_real_, .))) %>%
  rename(state = state_name)

# Summary table: estimated childless women by race and year
zero_inf_stats %>%
  group_by(RACE, YEAR) %>%
  summarise(
    n_zero_sample = sum(n_zero_sample, na.rm = TRUE),
    n_zero_pop    = sum(n_zero_pop, na.rm = TRUE),
    n_total_pop   = sum(n_total_pop, na.rm = TRUE),
    .groups = "drop"
  ) %>%
  mutate(
    pct_zero    = scales::percent(n_zero_pop / n_total_pop, accuracy = 0.1),
    n_zero_pop  = scales::comma(n_zero_pop),
    n_total_pop = scales::comma(n_total_pop)
  ) %>%
  arrange(RACE, YEAR) %>%
  print(n = Inf)
# A tibble: 8 × 6
RACE YEAR n_zero_sample n_zero_pop n_total_pop pct_zero
<fct> <int> <dbl> <chr> <chr> <chr>
1 White 1960 15286 1,522,777 7,610,779 20.0%
2 White 1970 37961 3,796,100 19,256,500 19.7%
3 White 1980 67702 1,354,040 10,332,280 13.1%
4 White 1990 48170 951,874 9,044,575 10.5%
5 Black/African American 1960 2204 219,563 766,775 28.6%
6 Black/African American 1970 5162 516,200 1,983,300 26.0%
7 Black/African American 1980 10654 213,080 1,184,260 18.0%
8 Black/African American 1990 6219 142,484 1,219,995 11.7% plot_maps(zero_inf_stats, "prop_zero",
"Proportion Childless by State, Race, and Census Year\nWomen aged 50\u201359",
caption = "Proportion of women reporting zero children ever born (CHBORN = 0), weighted by PERWT. Women aged 50–59 are used as a completed-fertility proxy. Rows = census year; columns = race group. Grey = insufficient data (n < 10). Source: IPUMS USA 1% samples.",
palette_option = "viridis")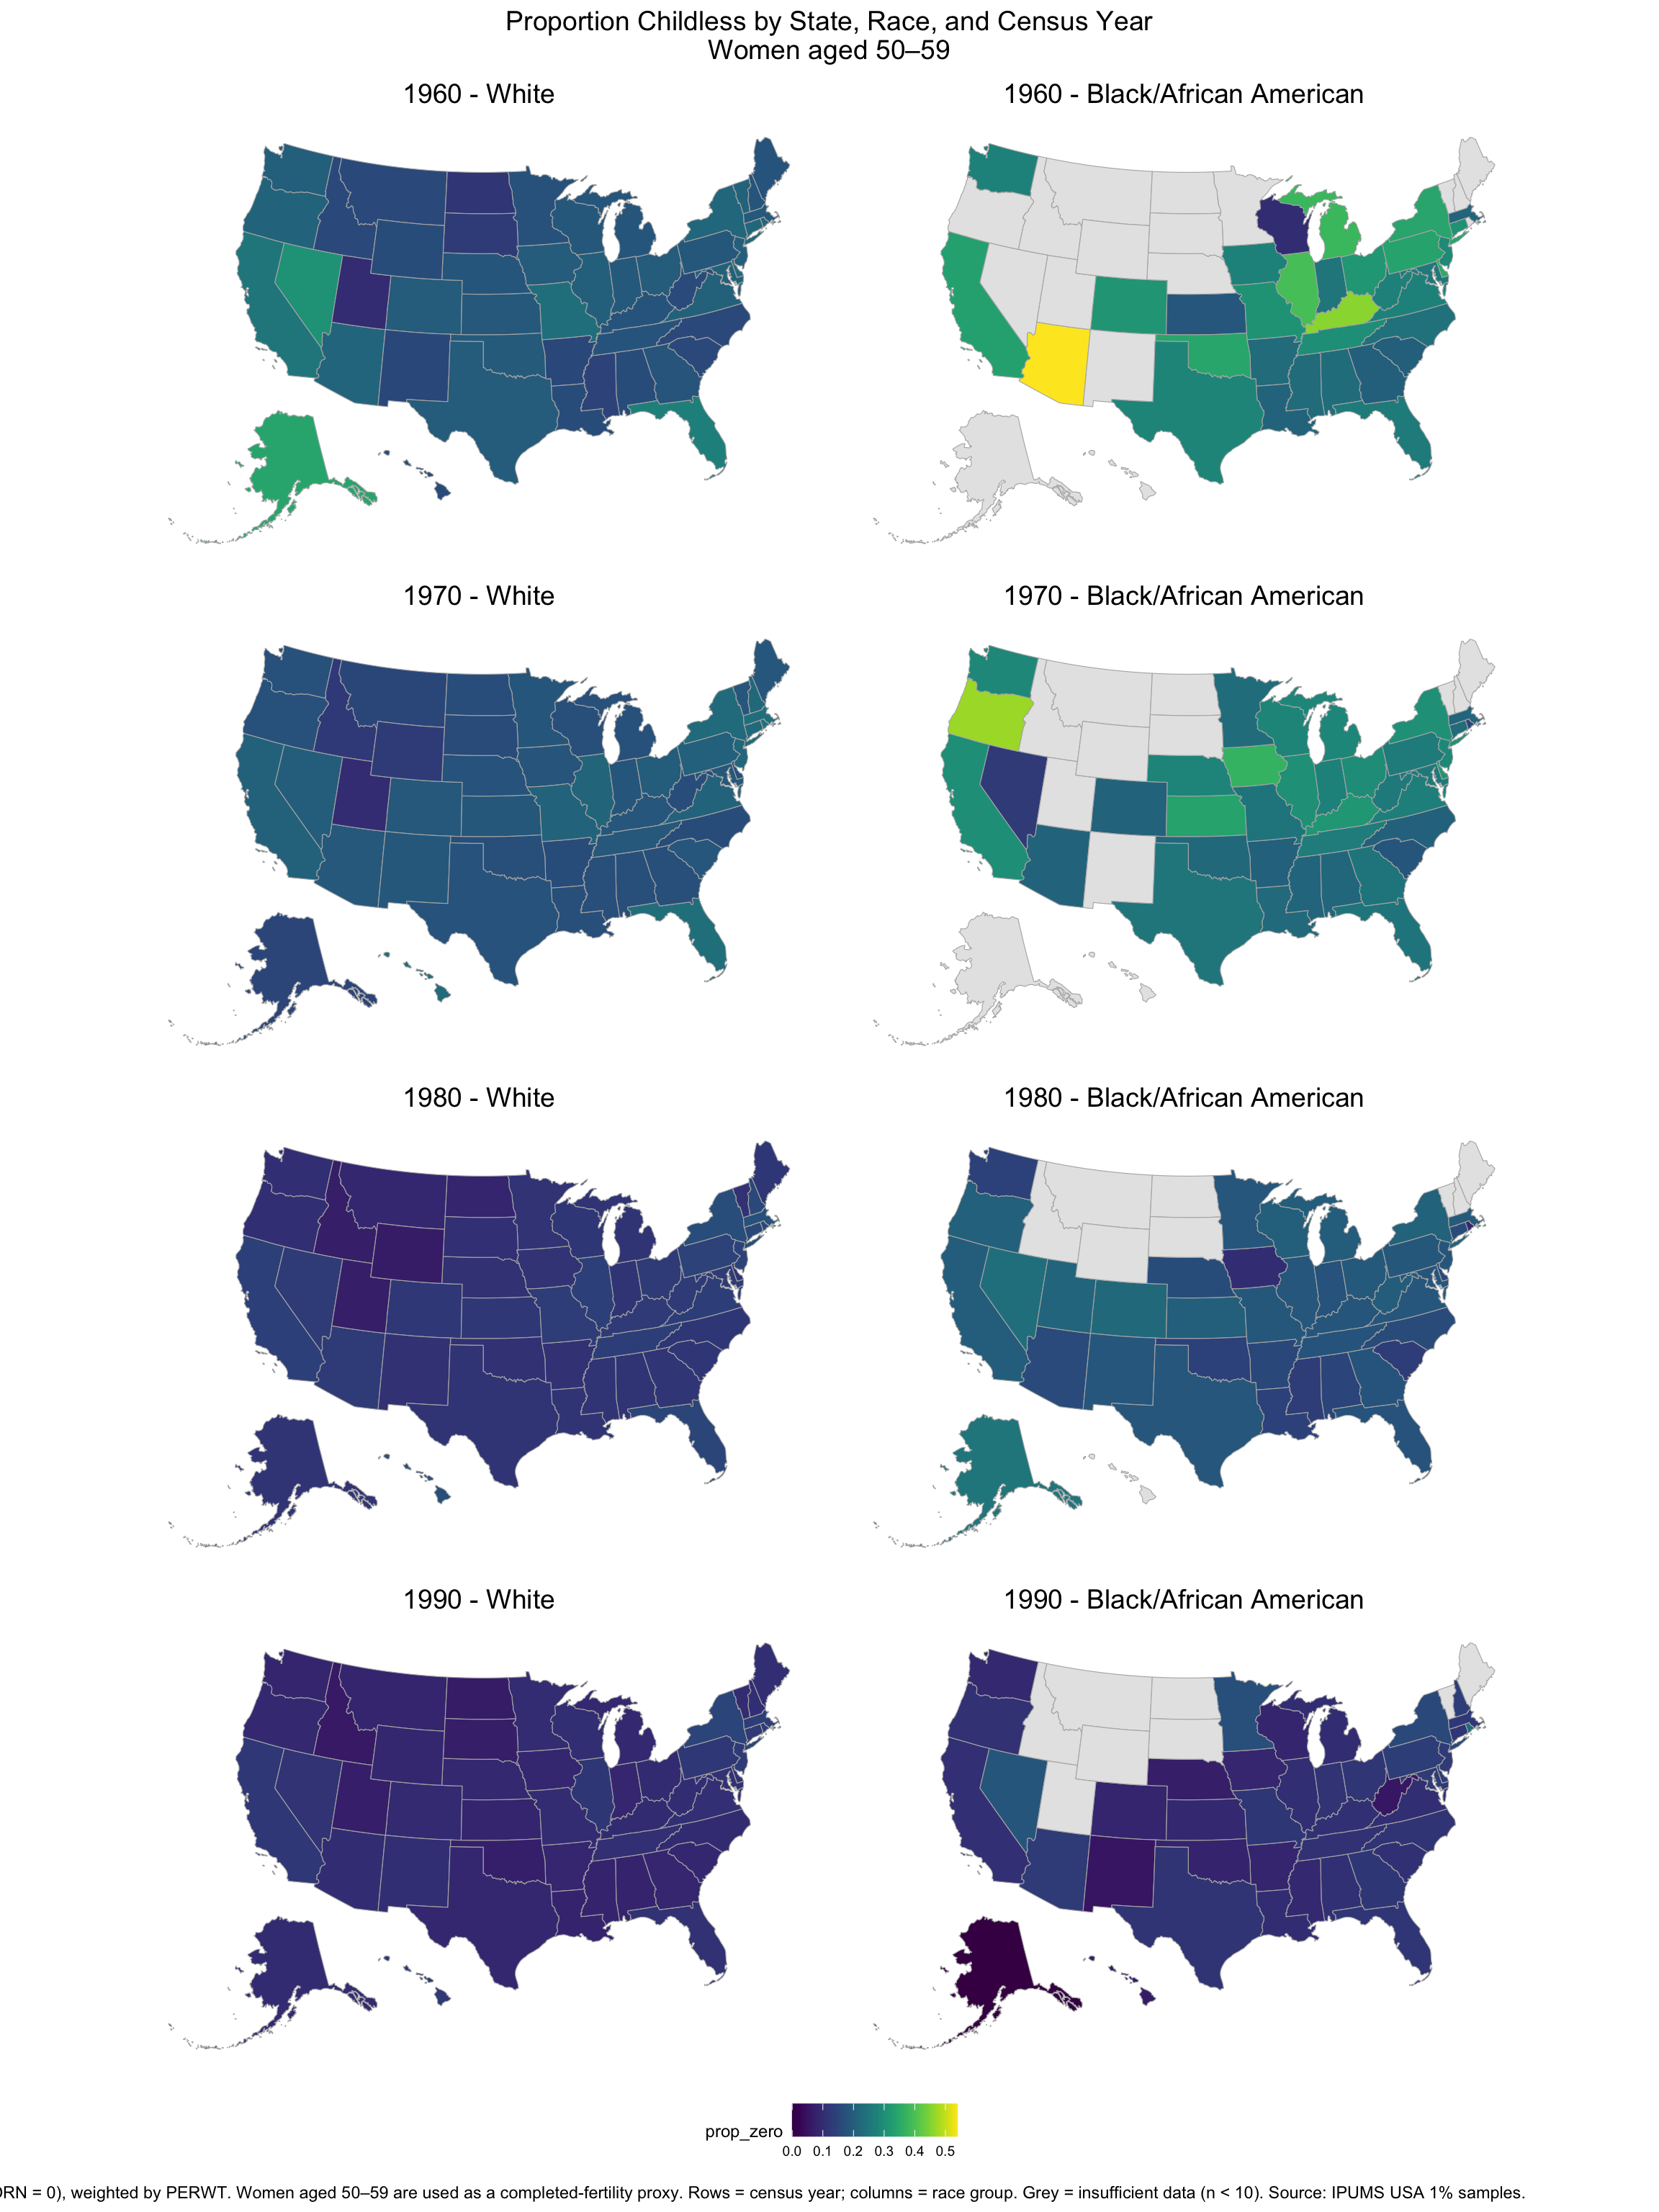
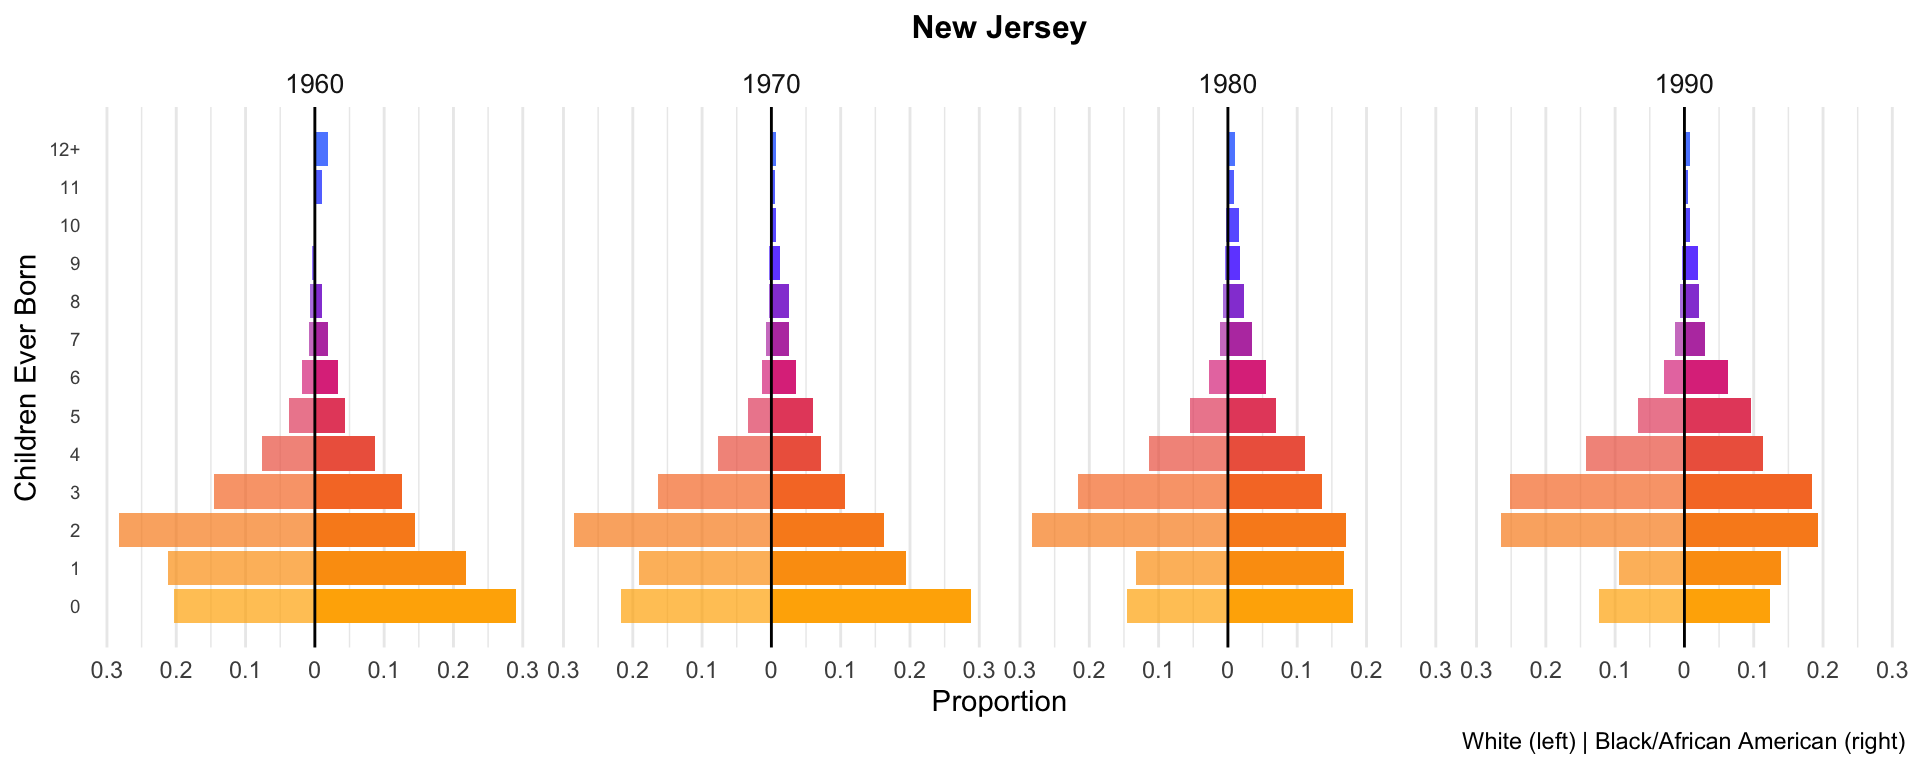
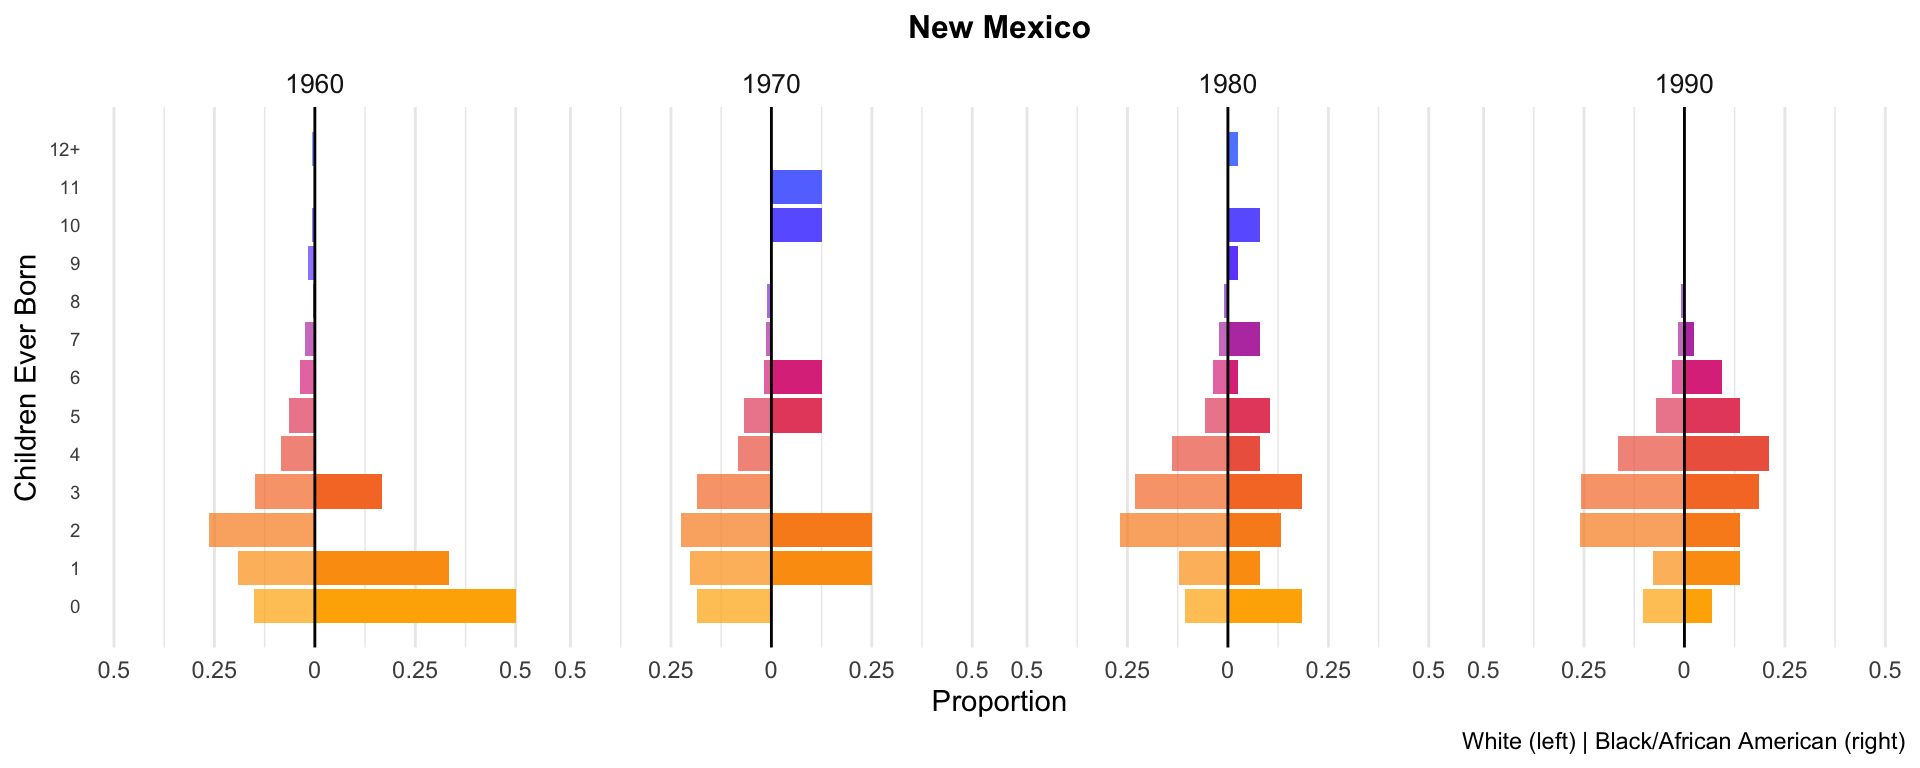
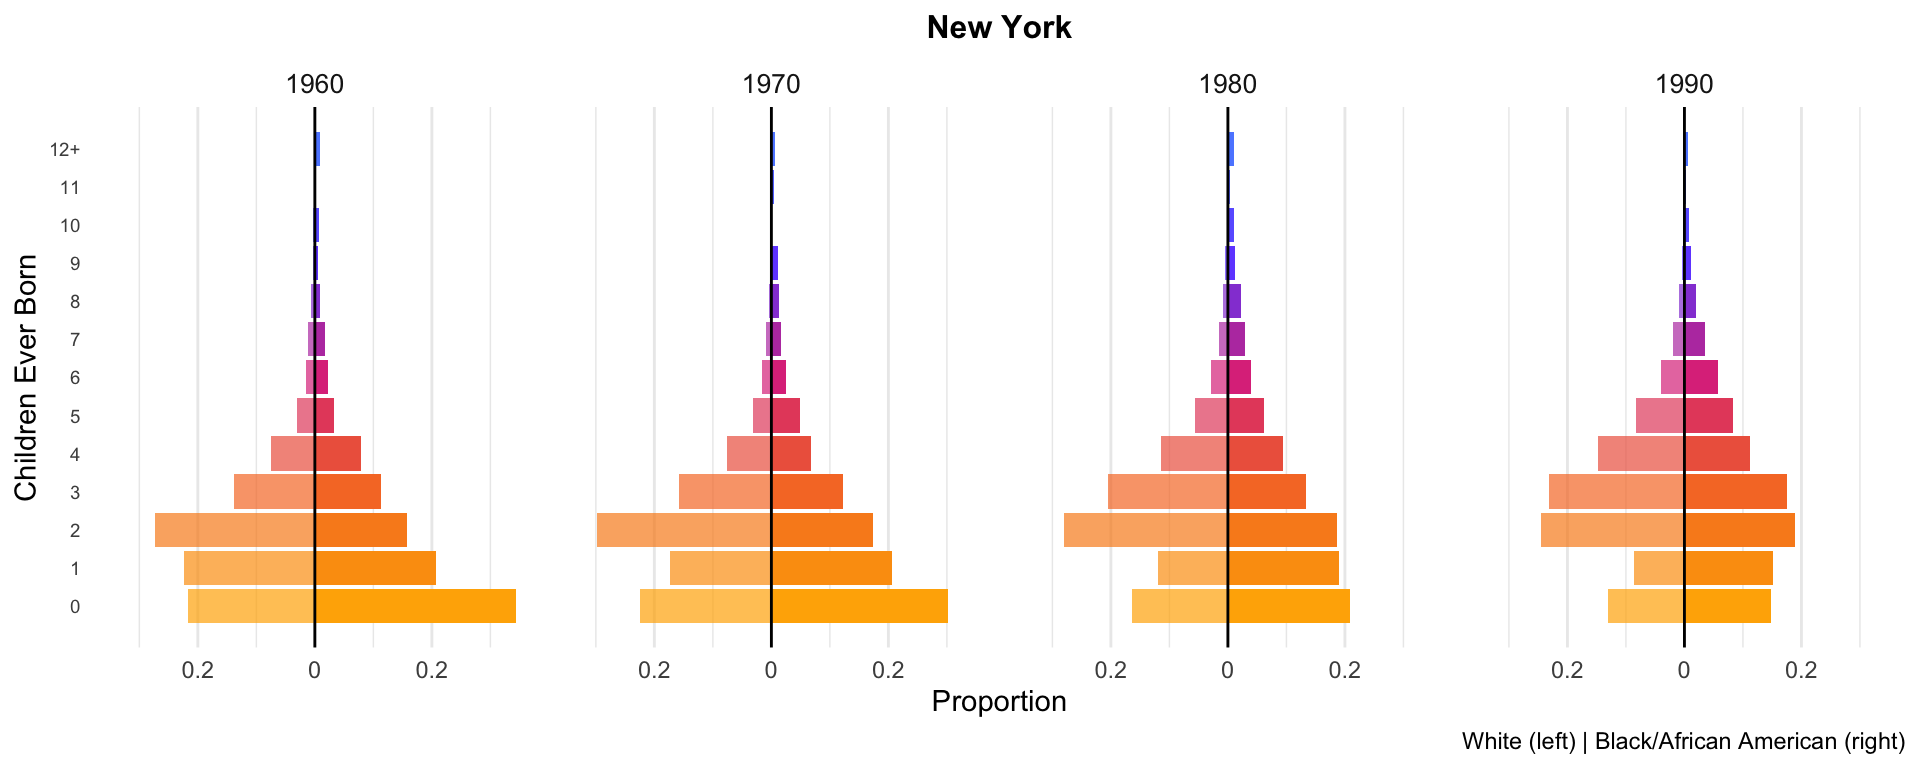
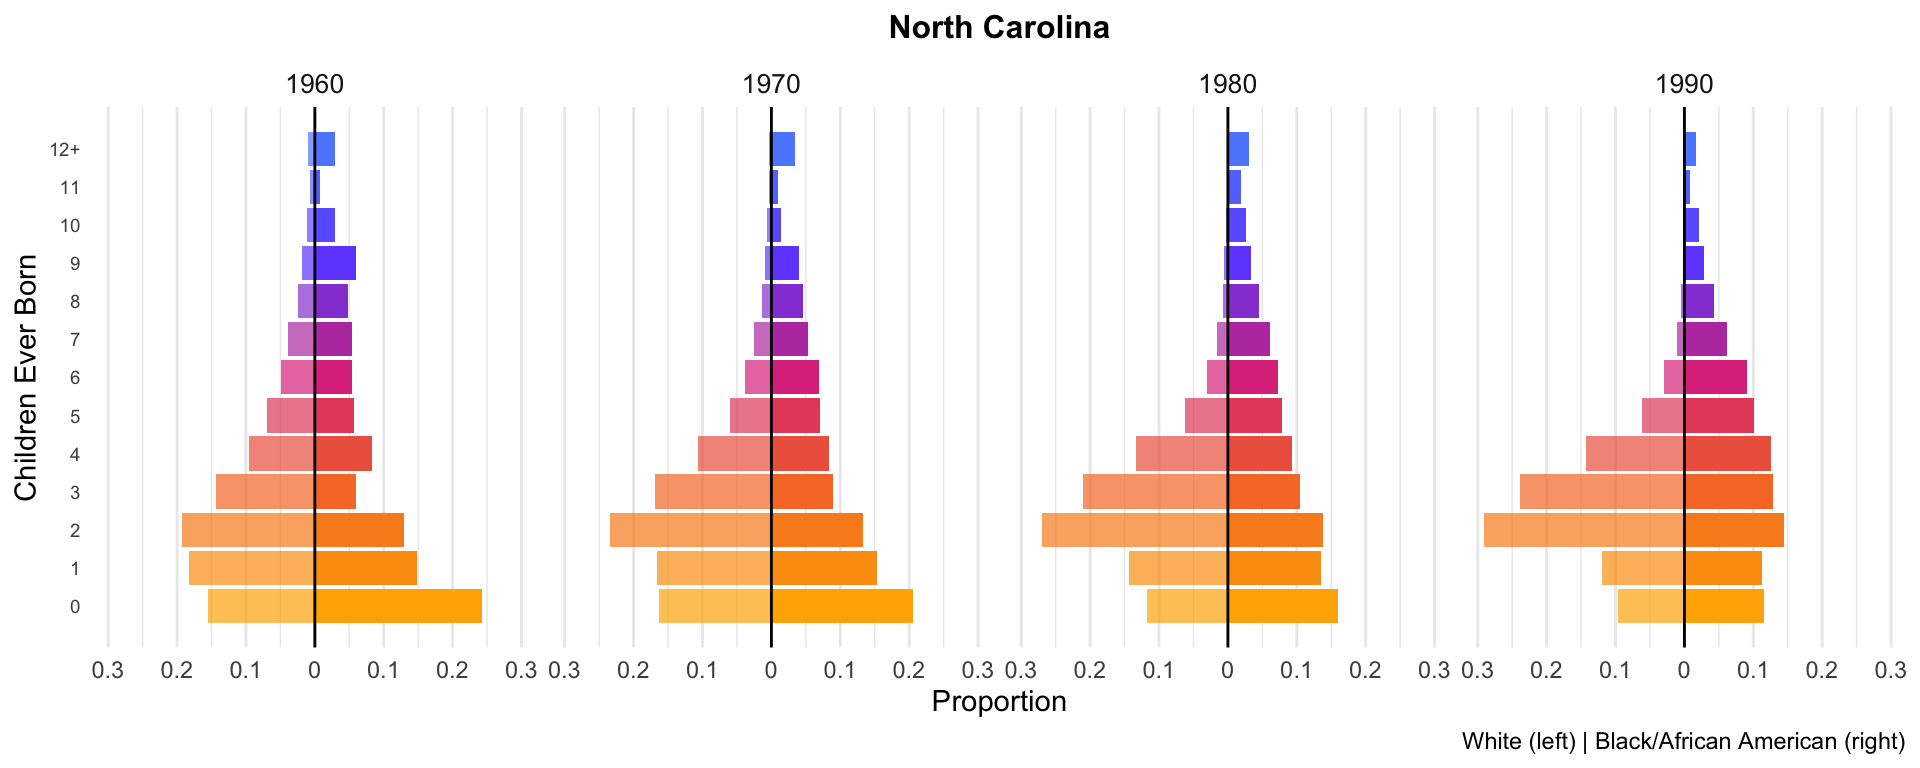
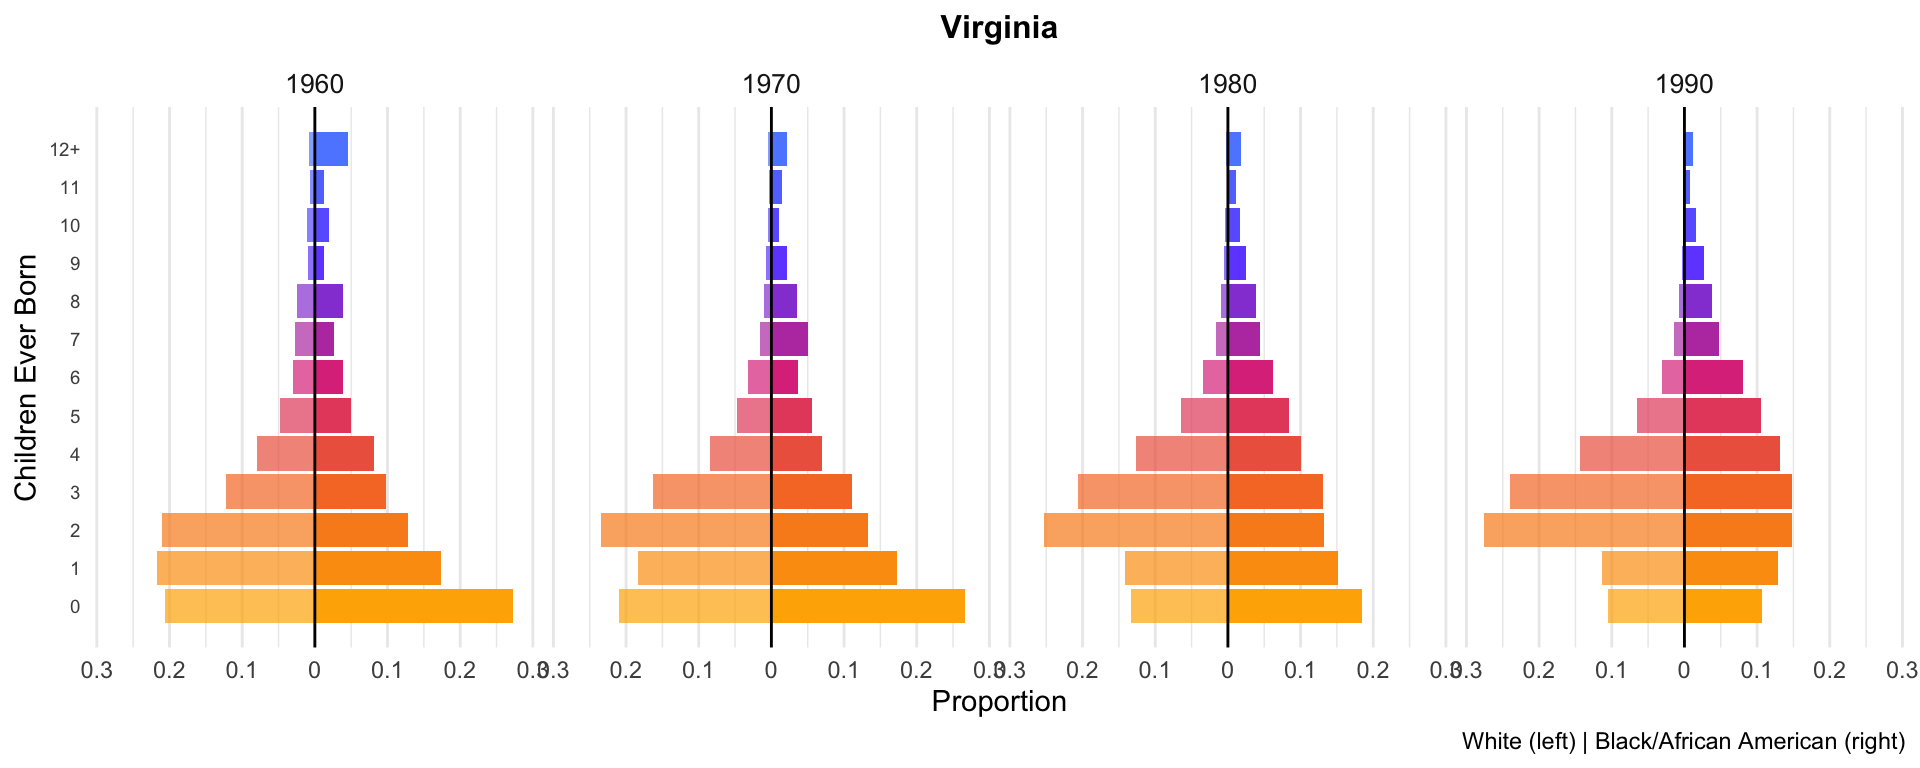
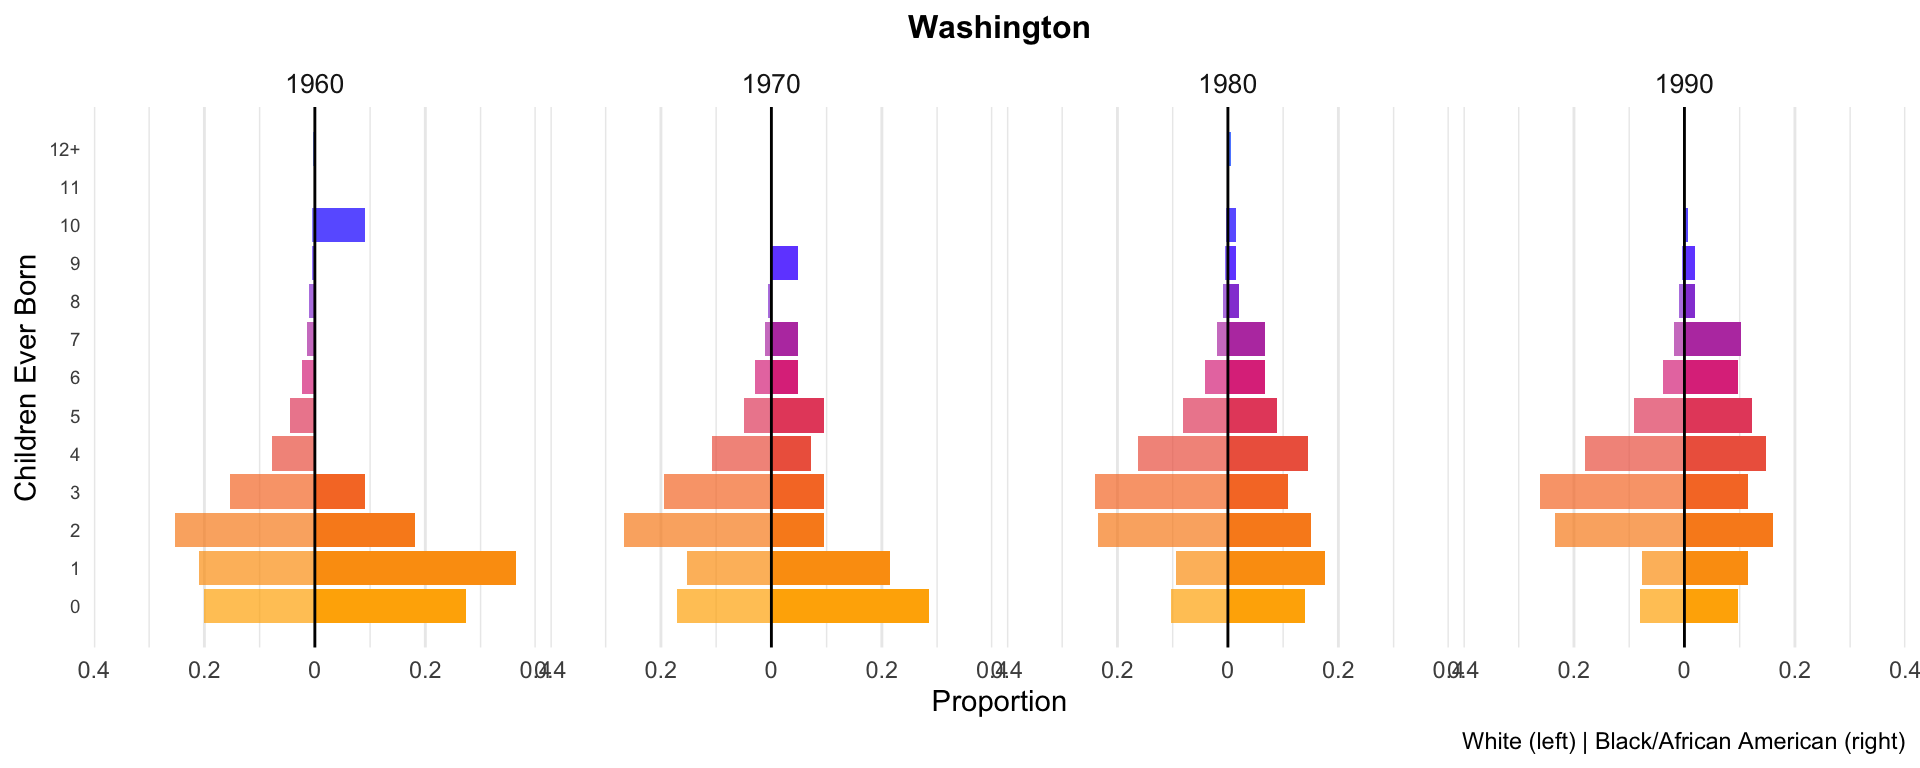
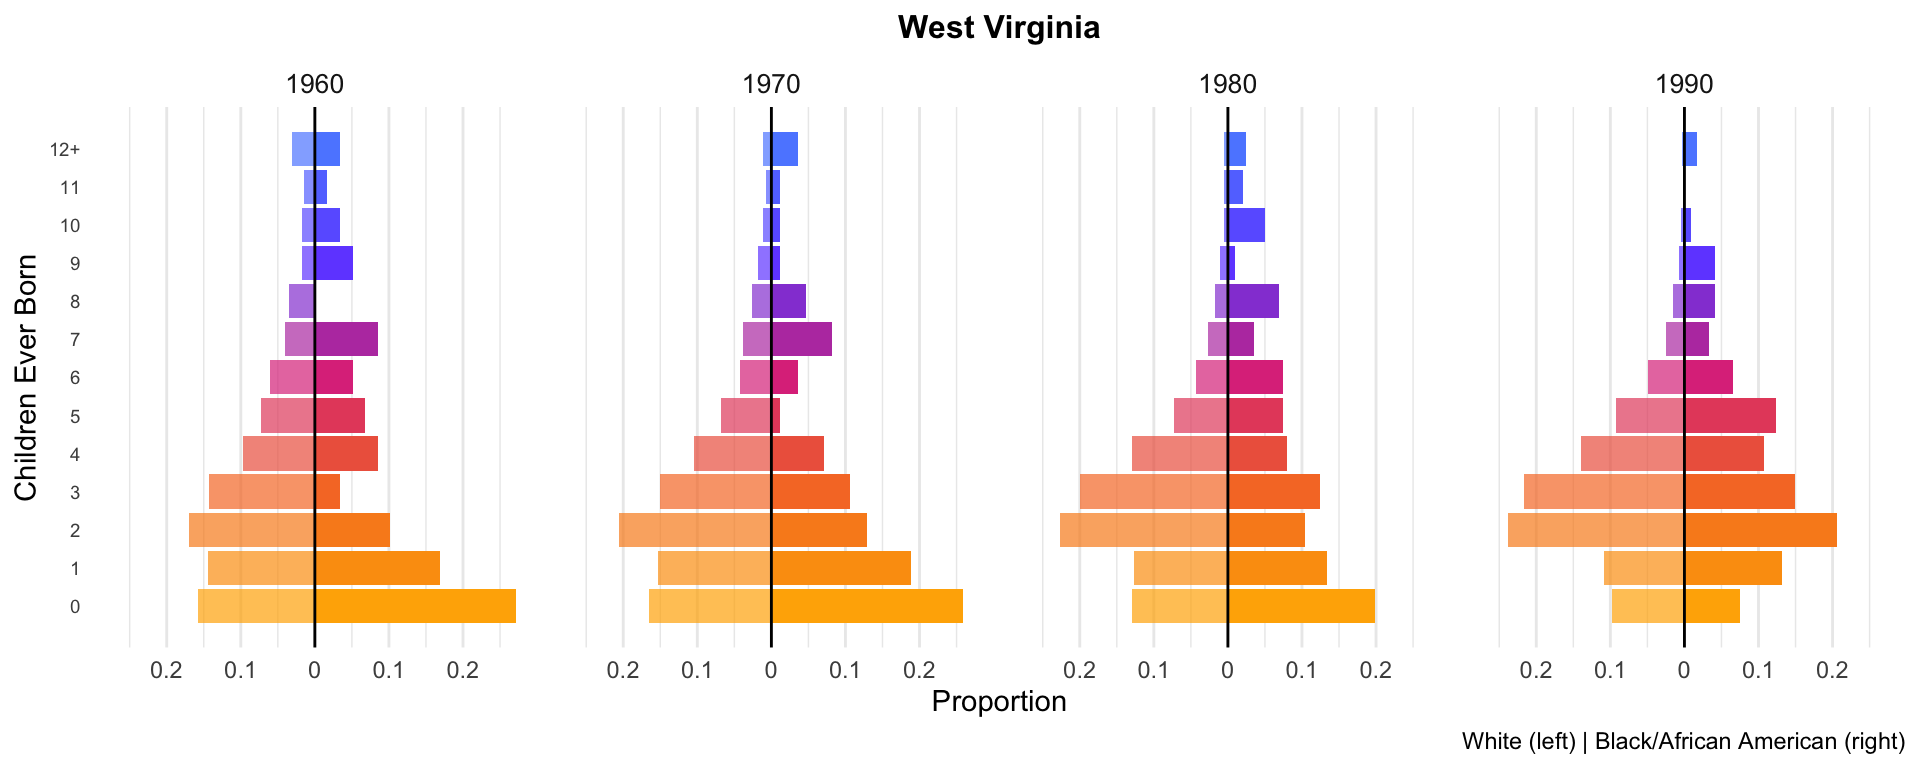
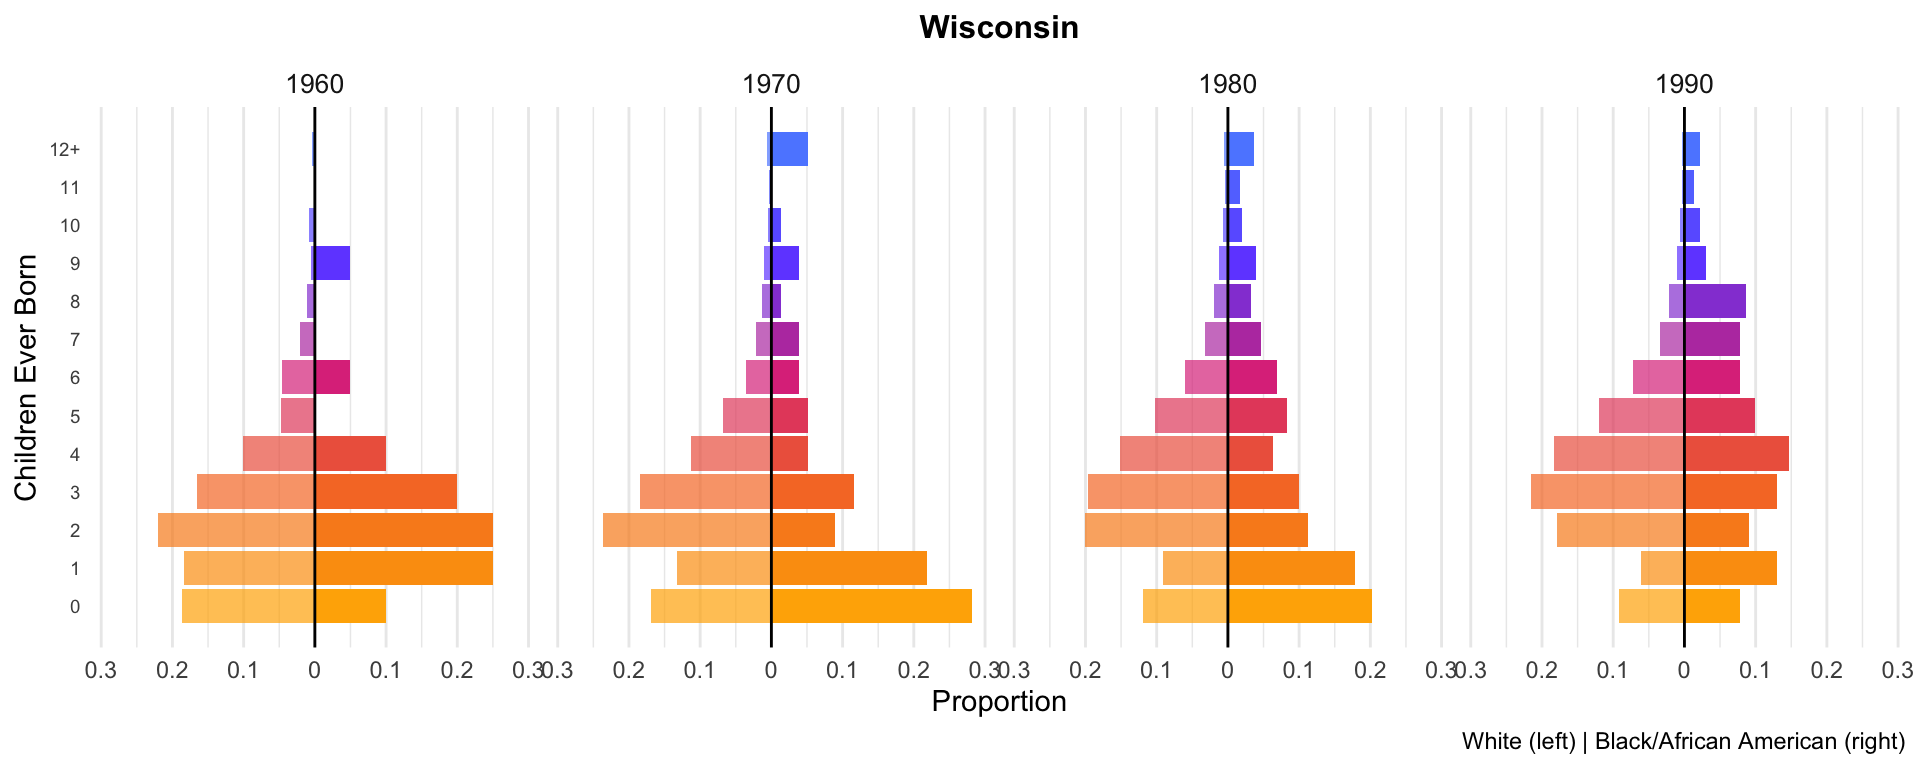
7. Per-state mirrored bar charts
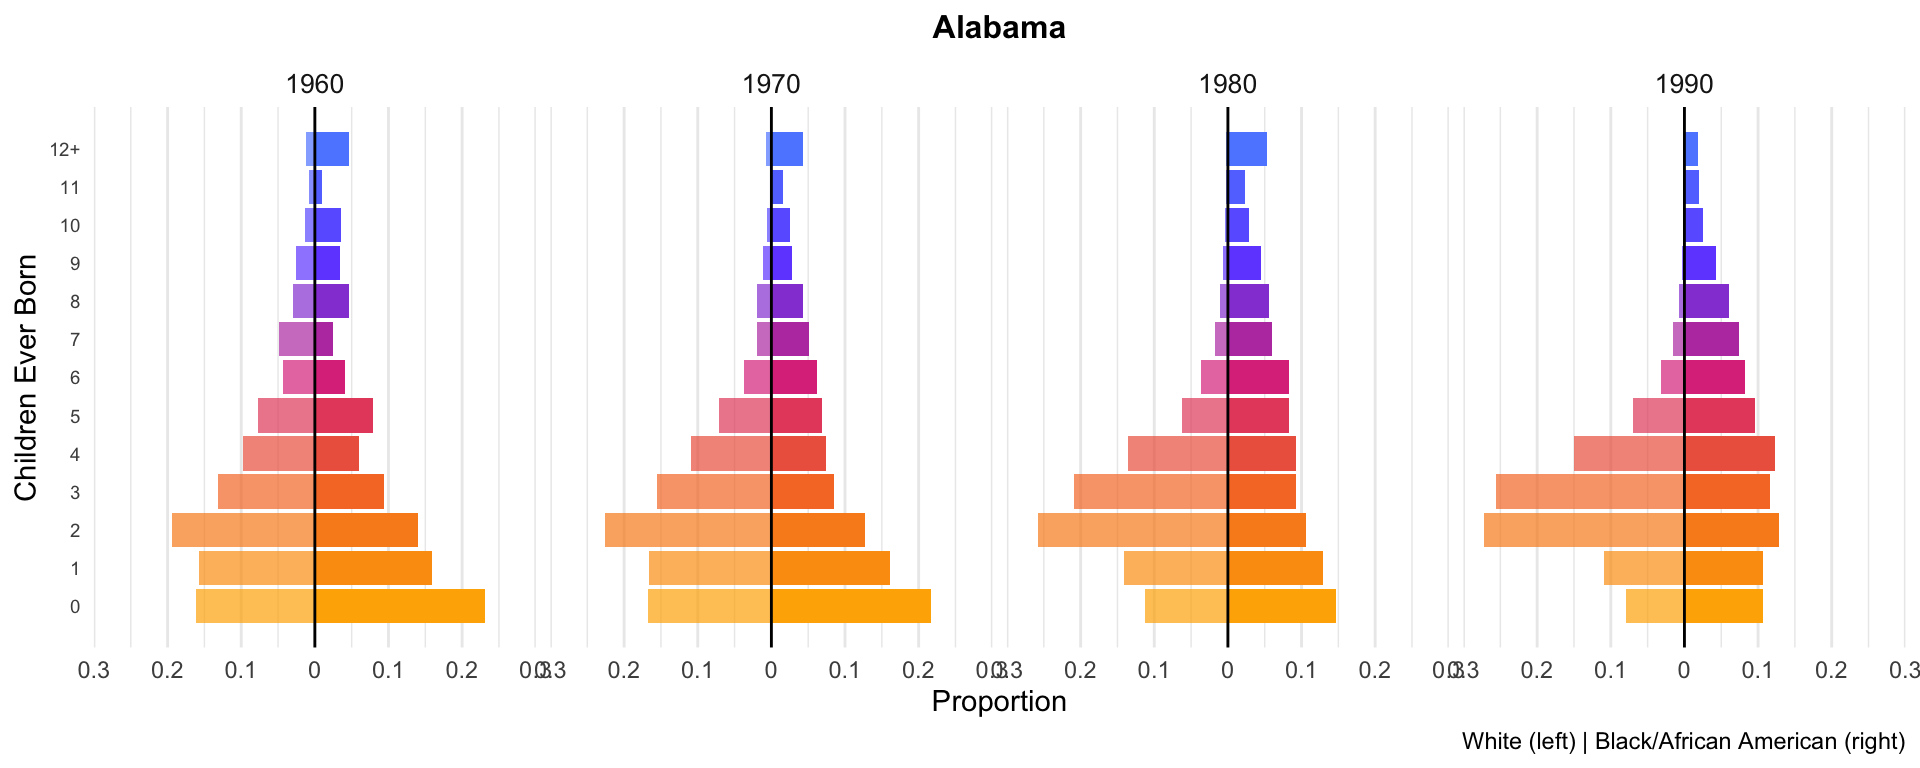
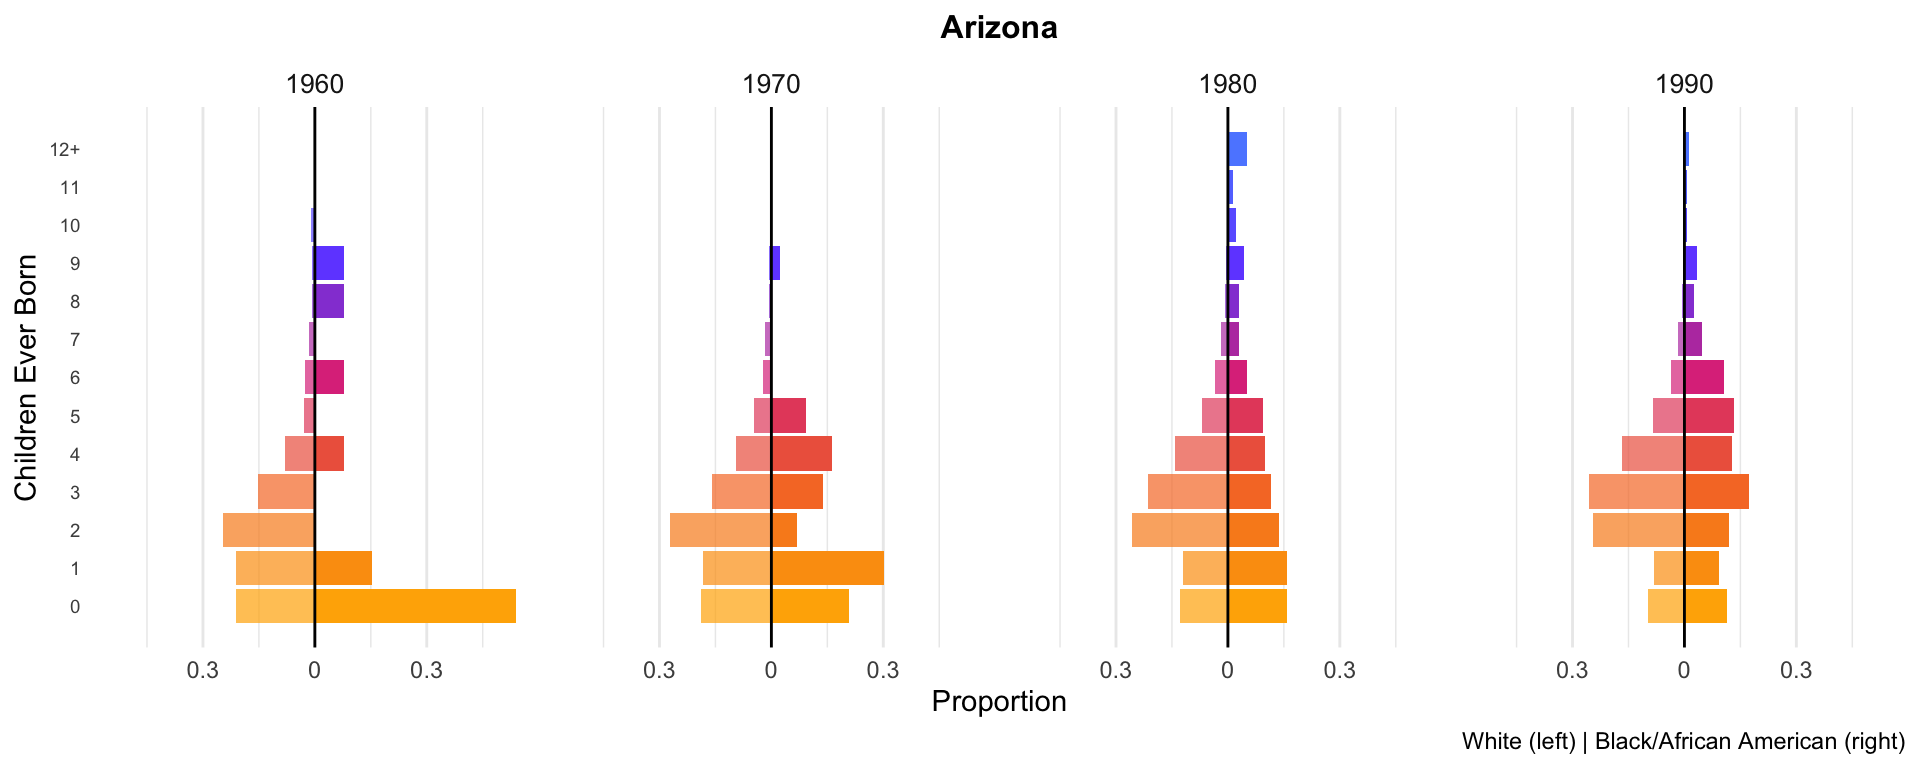
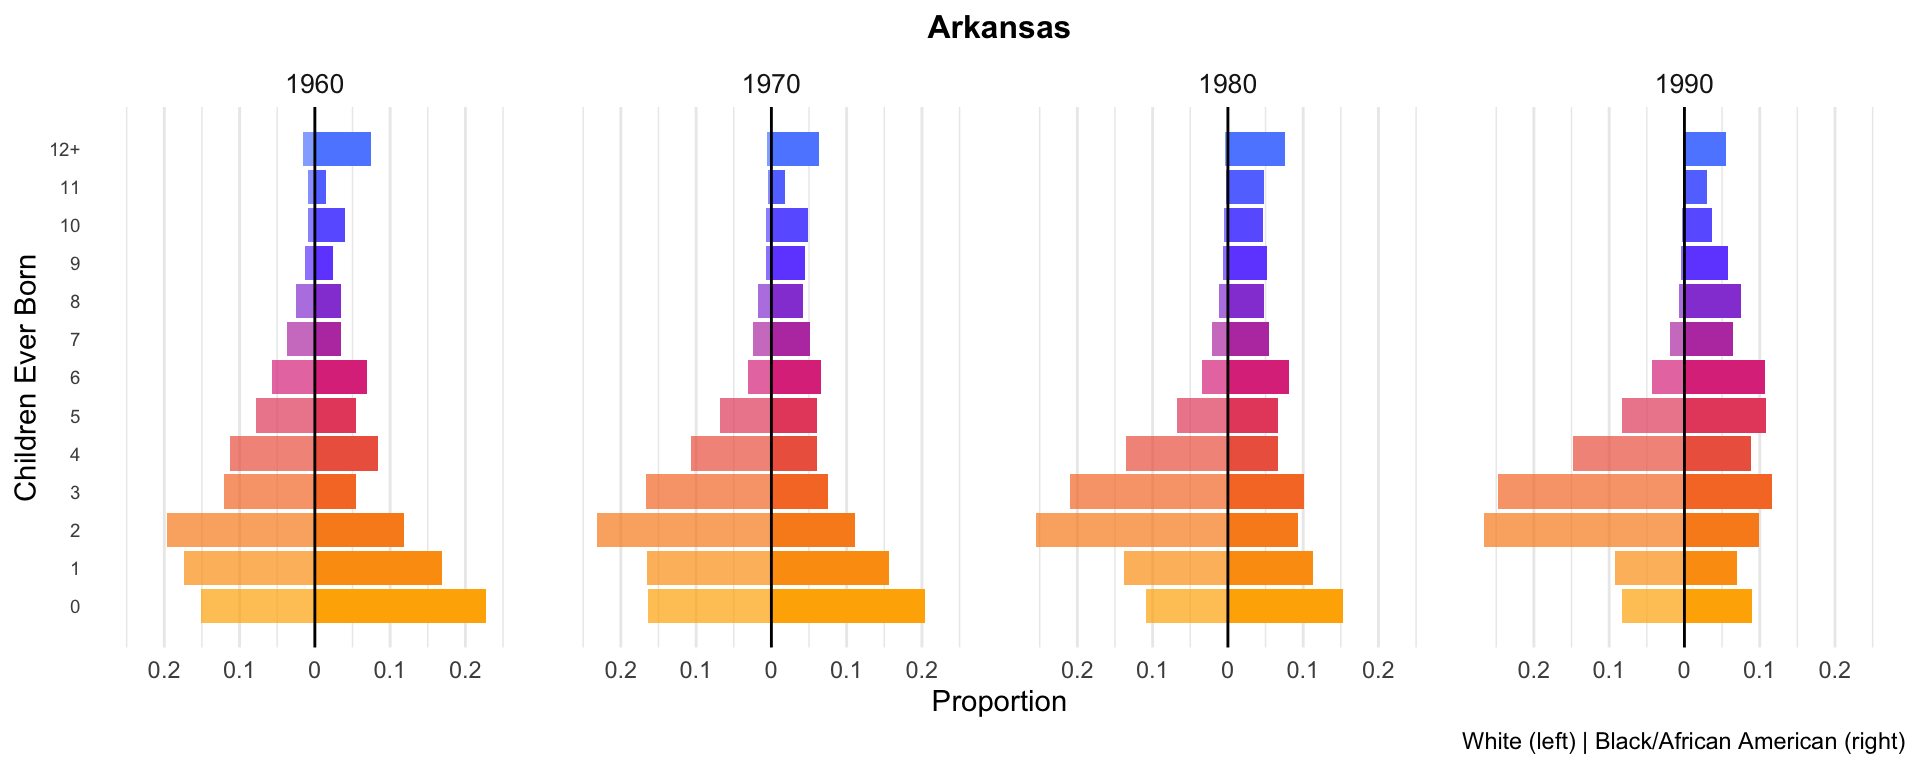
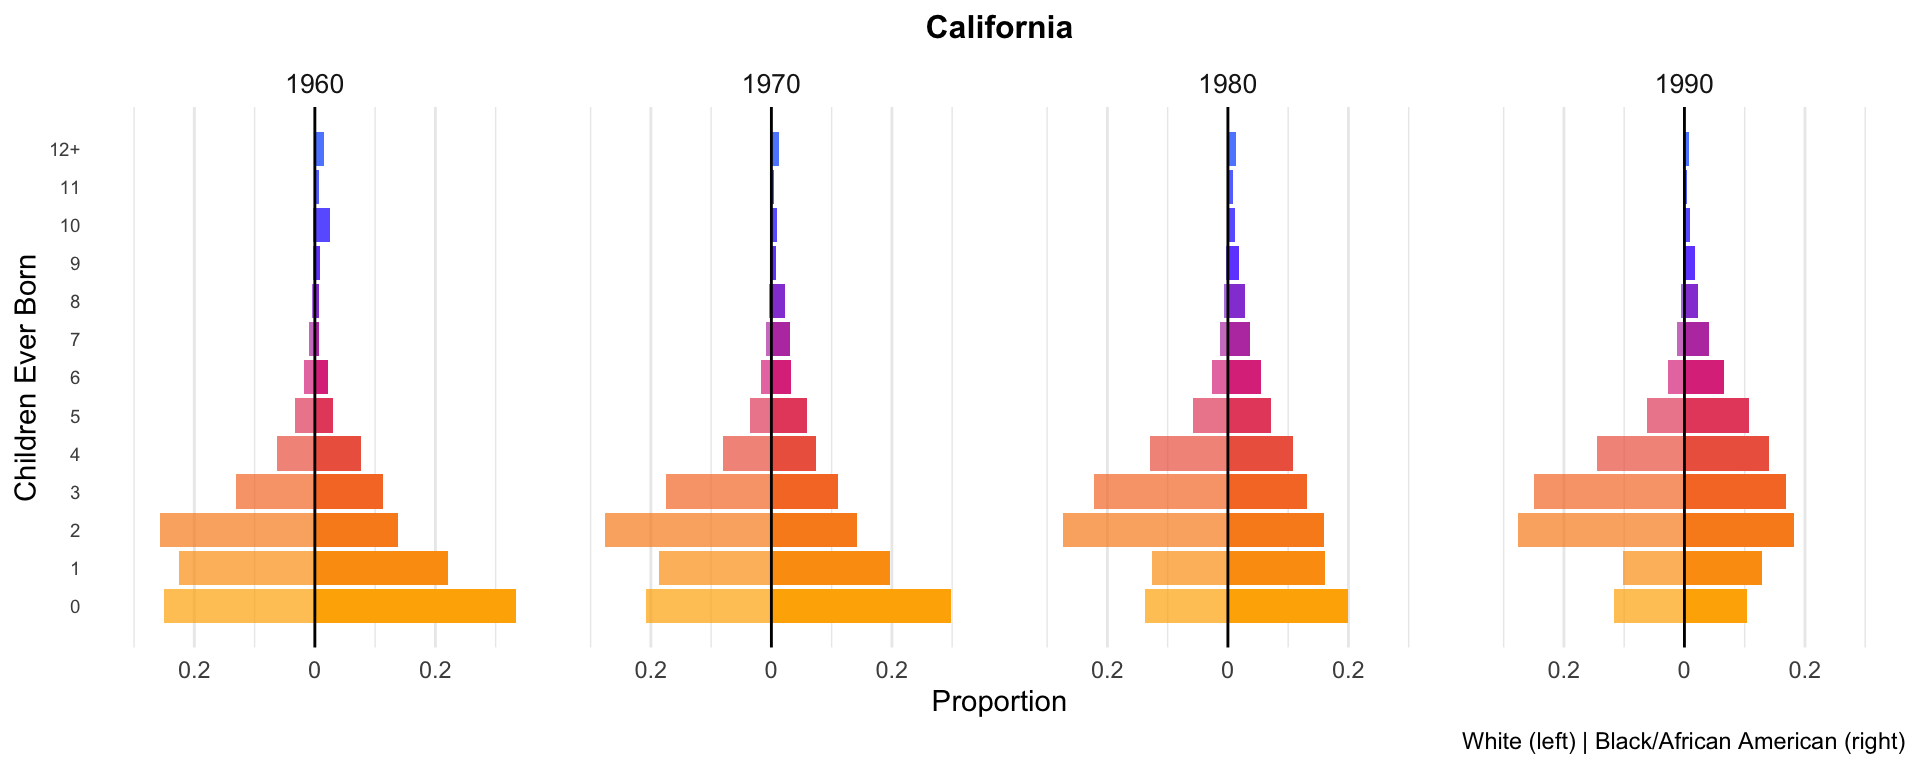
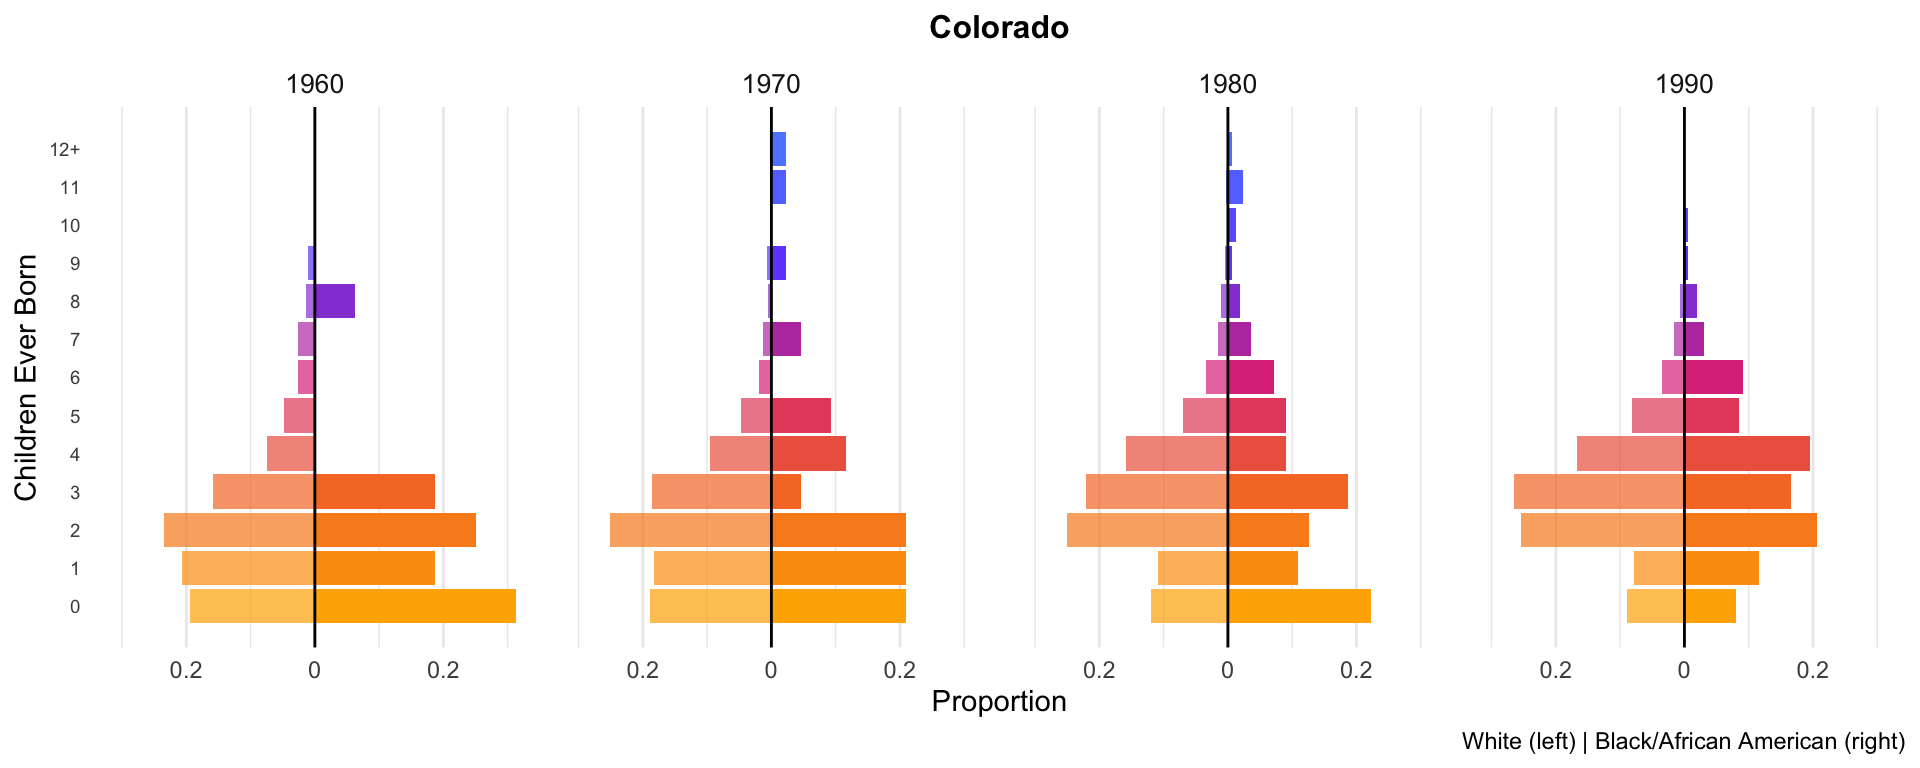
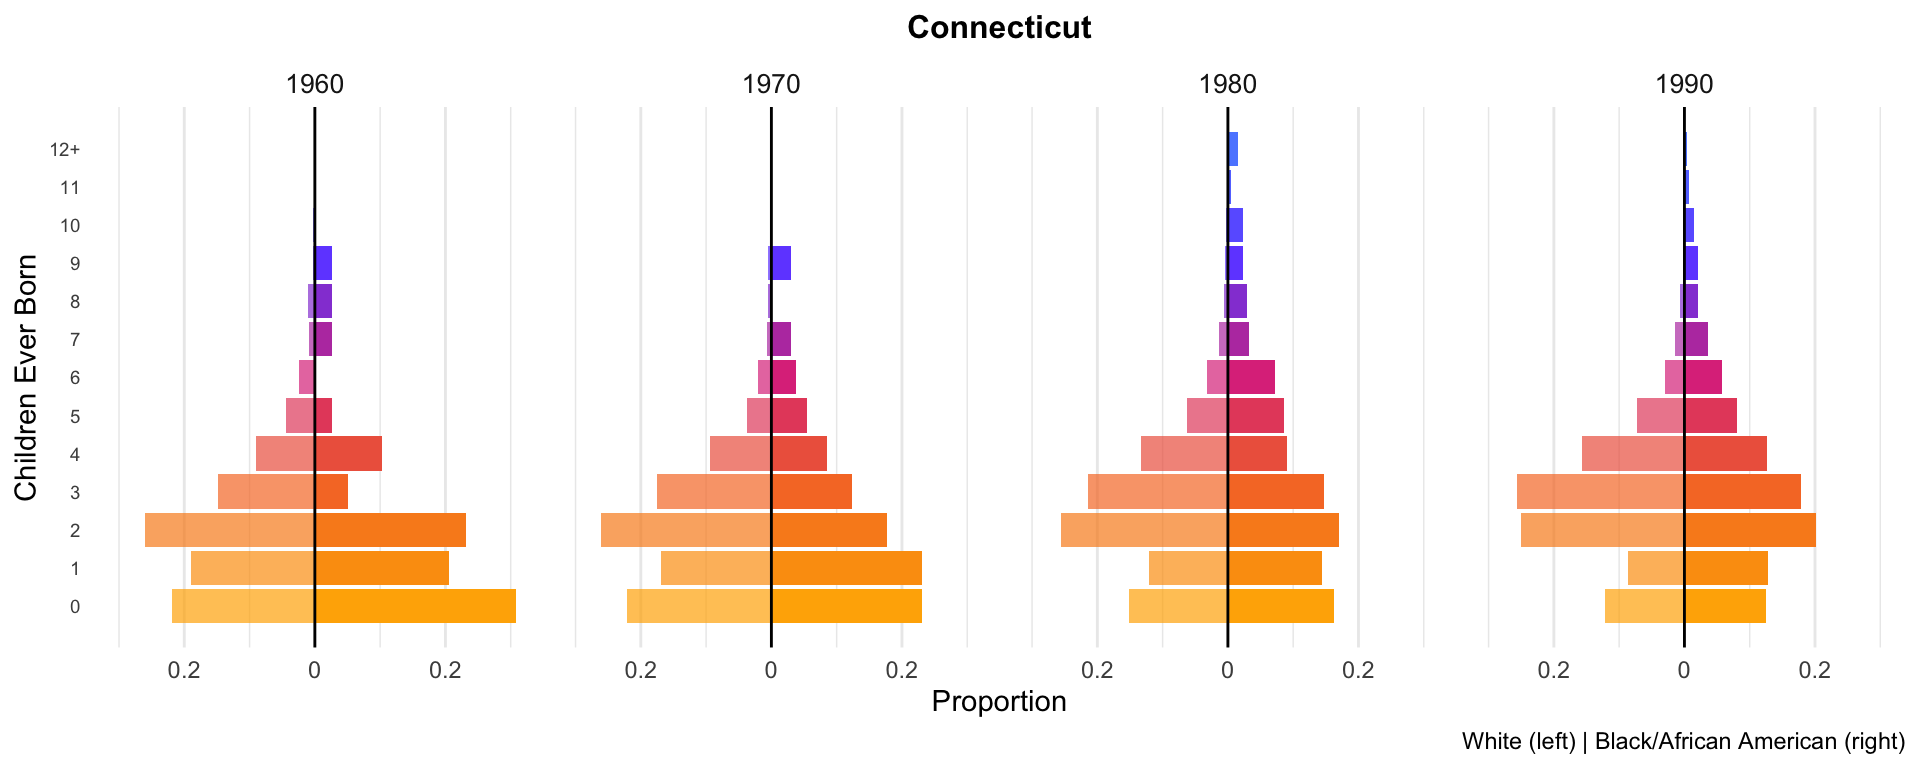
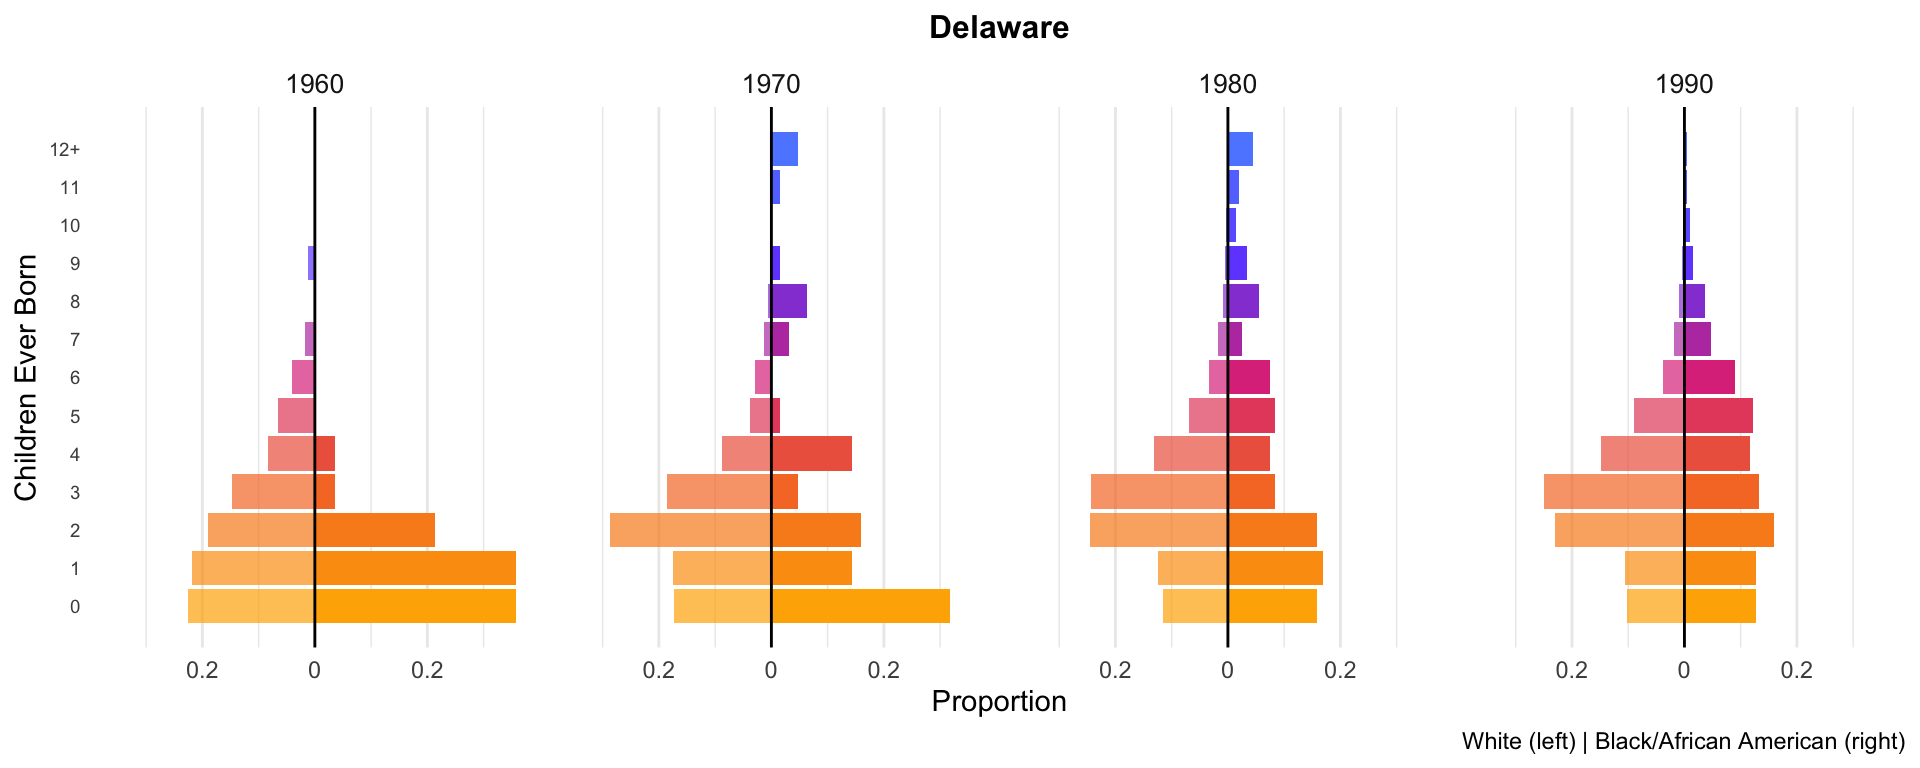
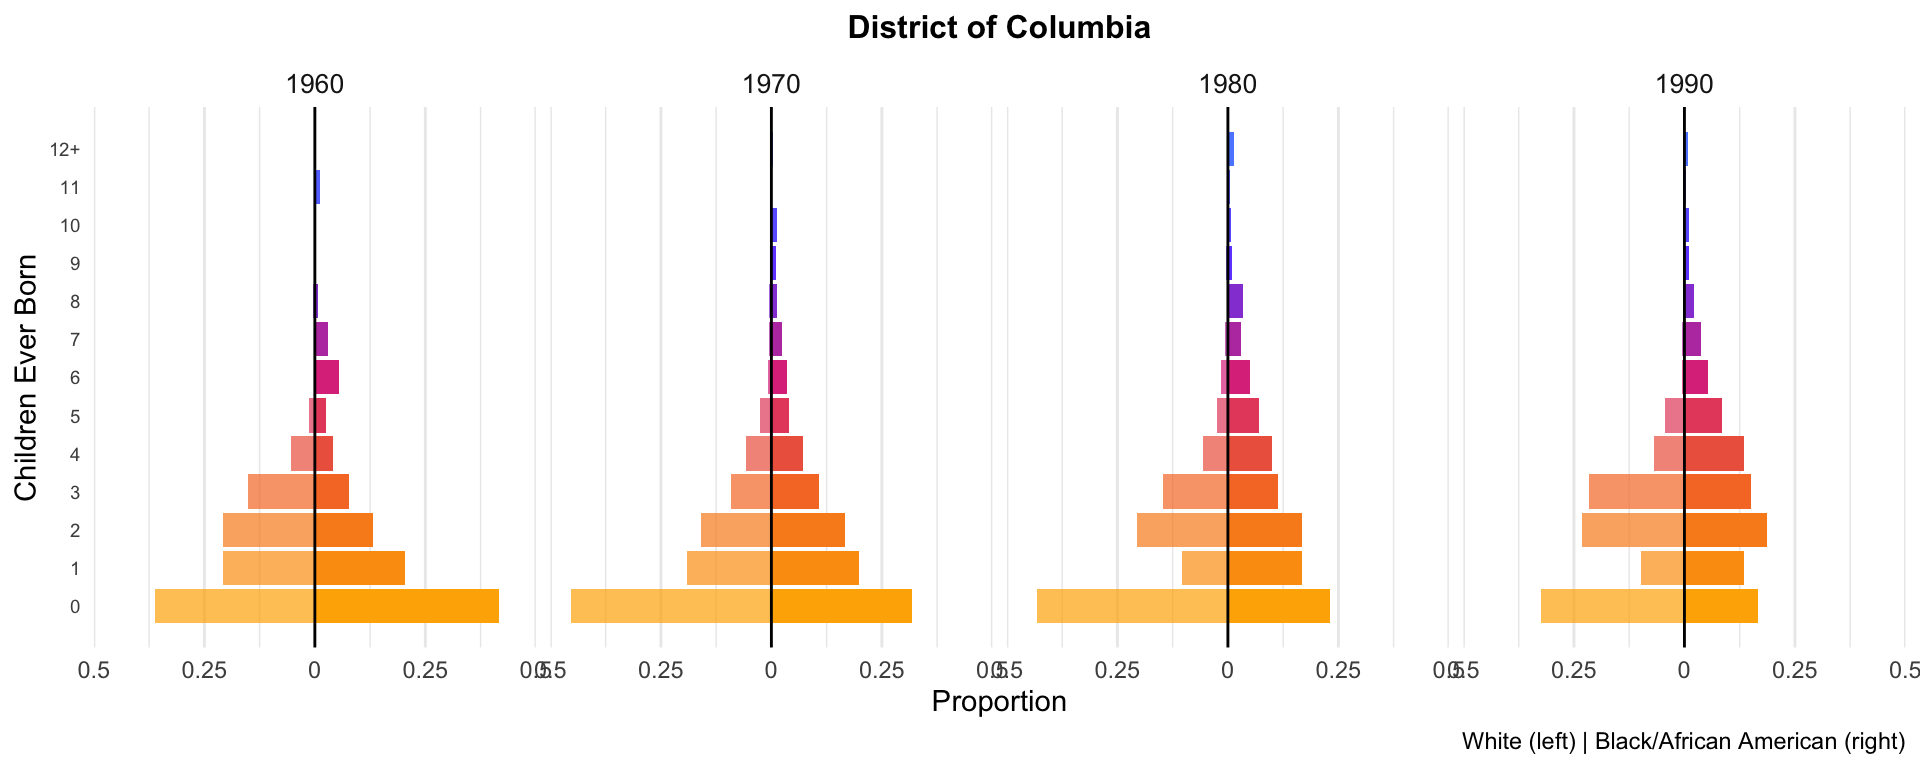
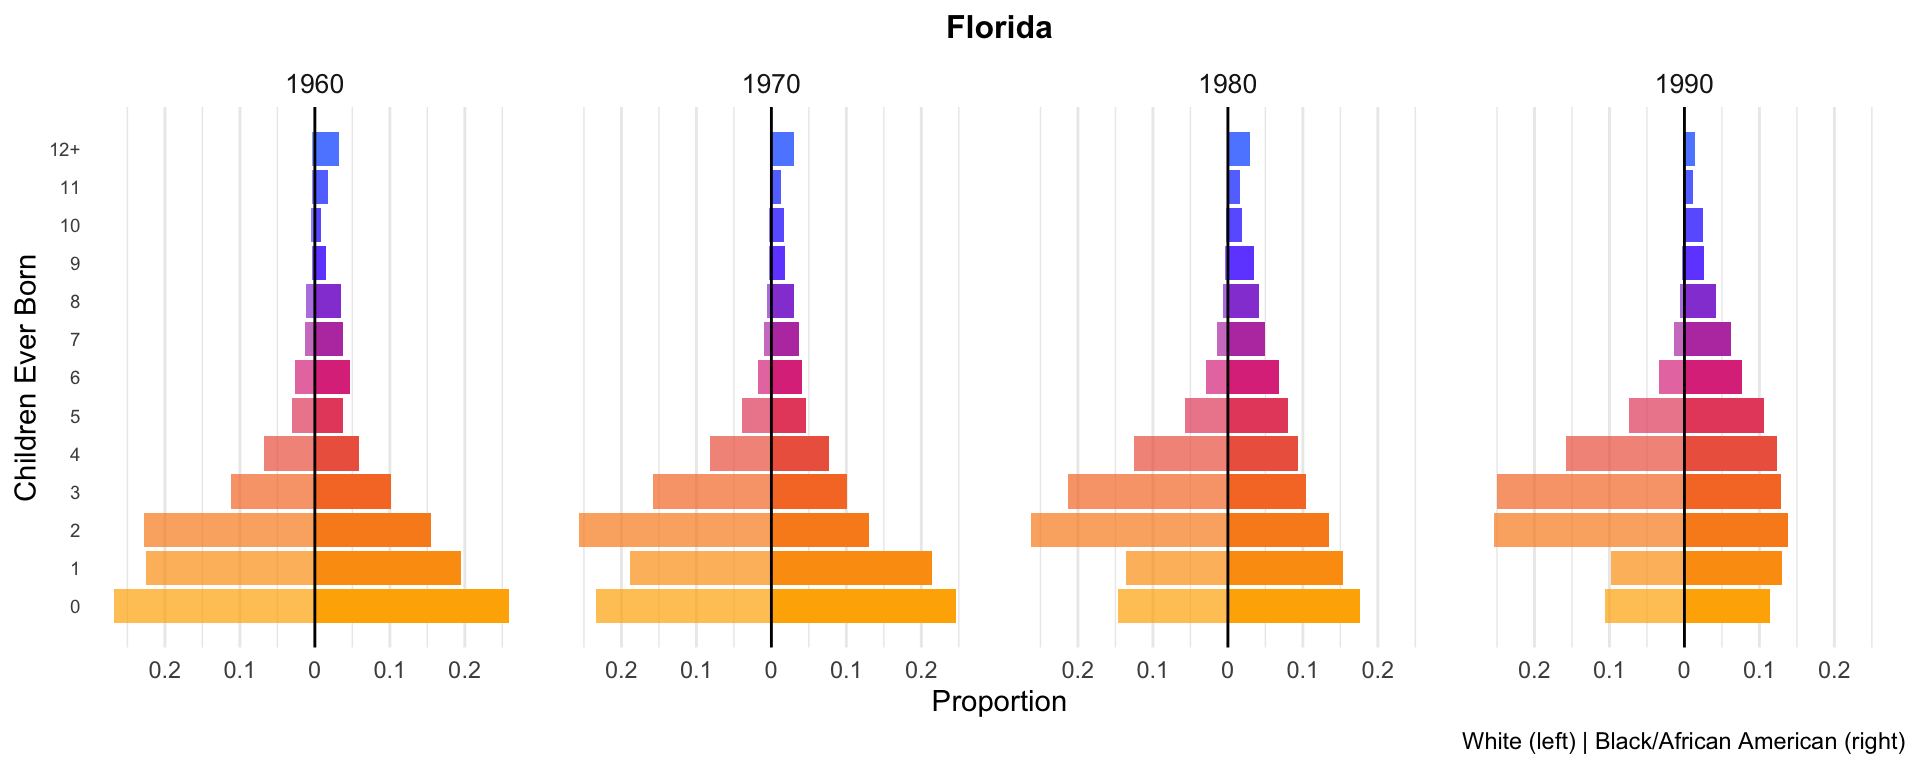
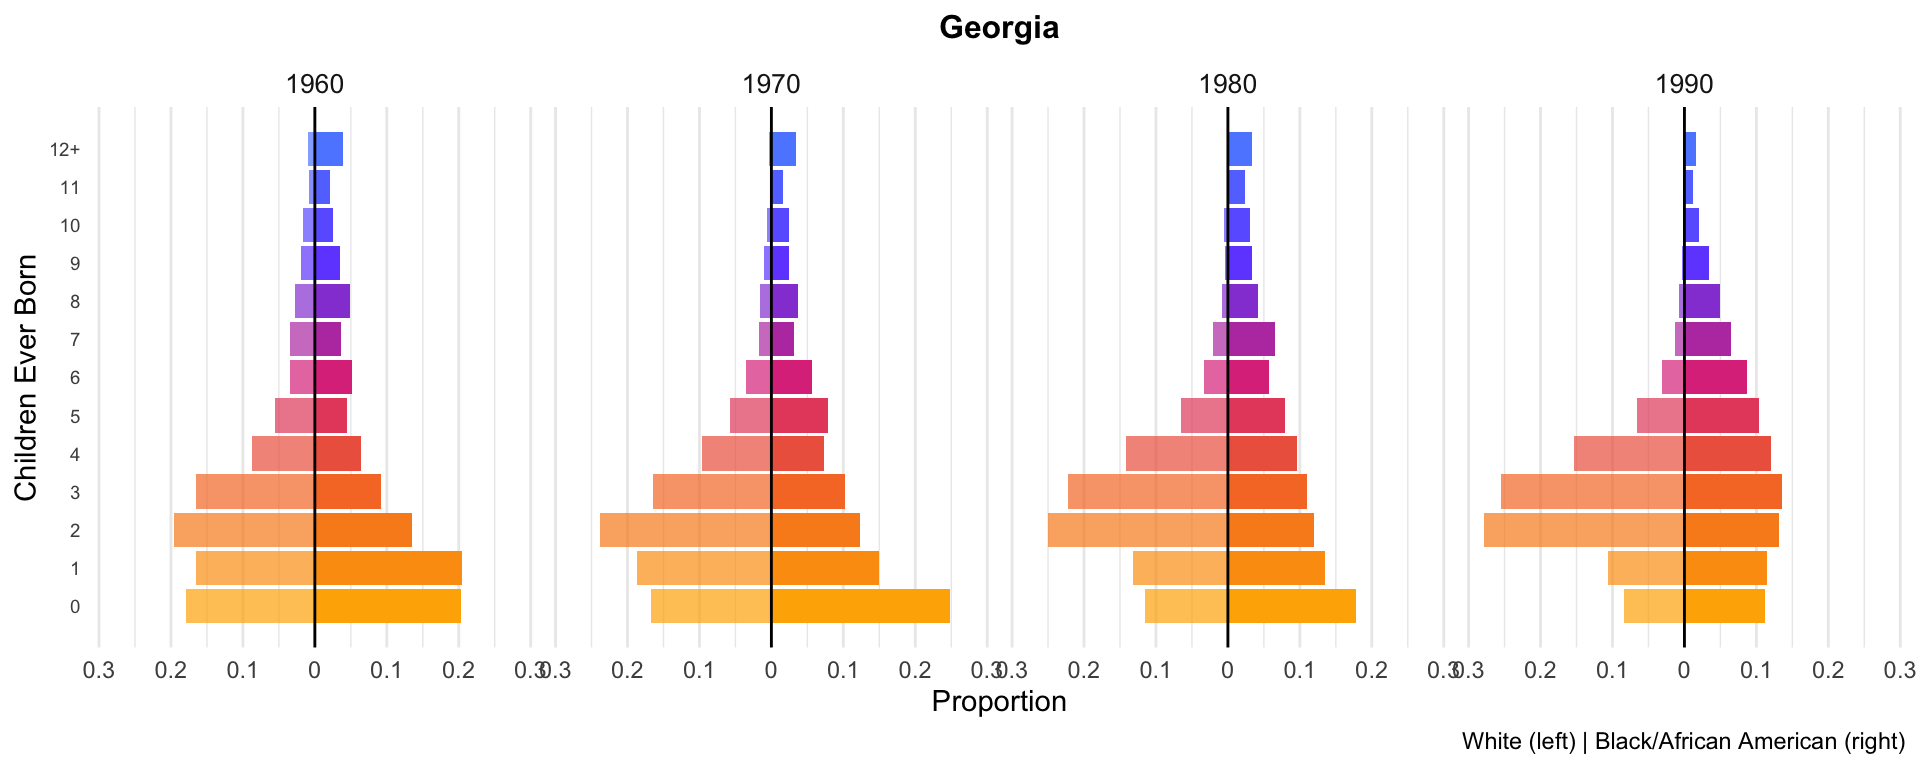
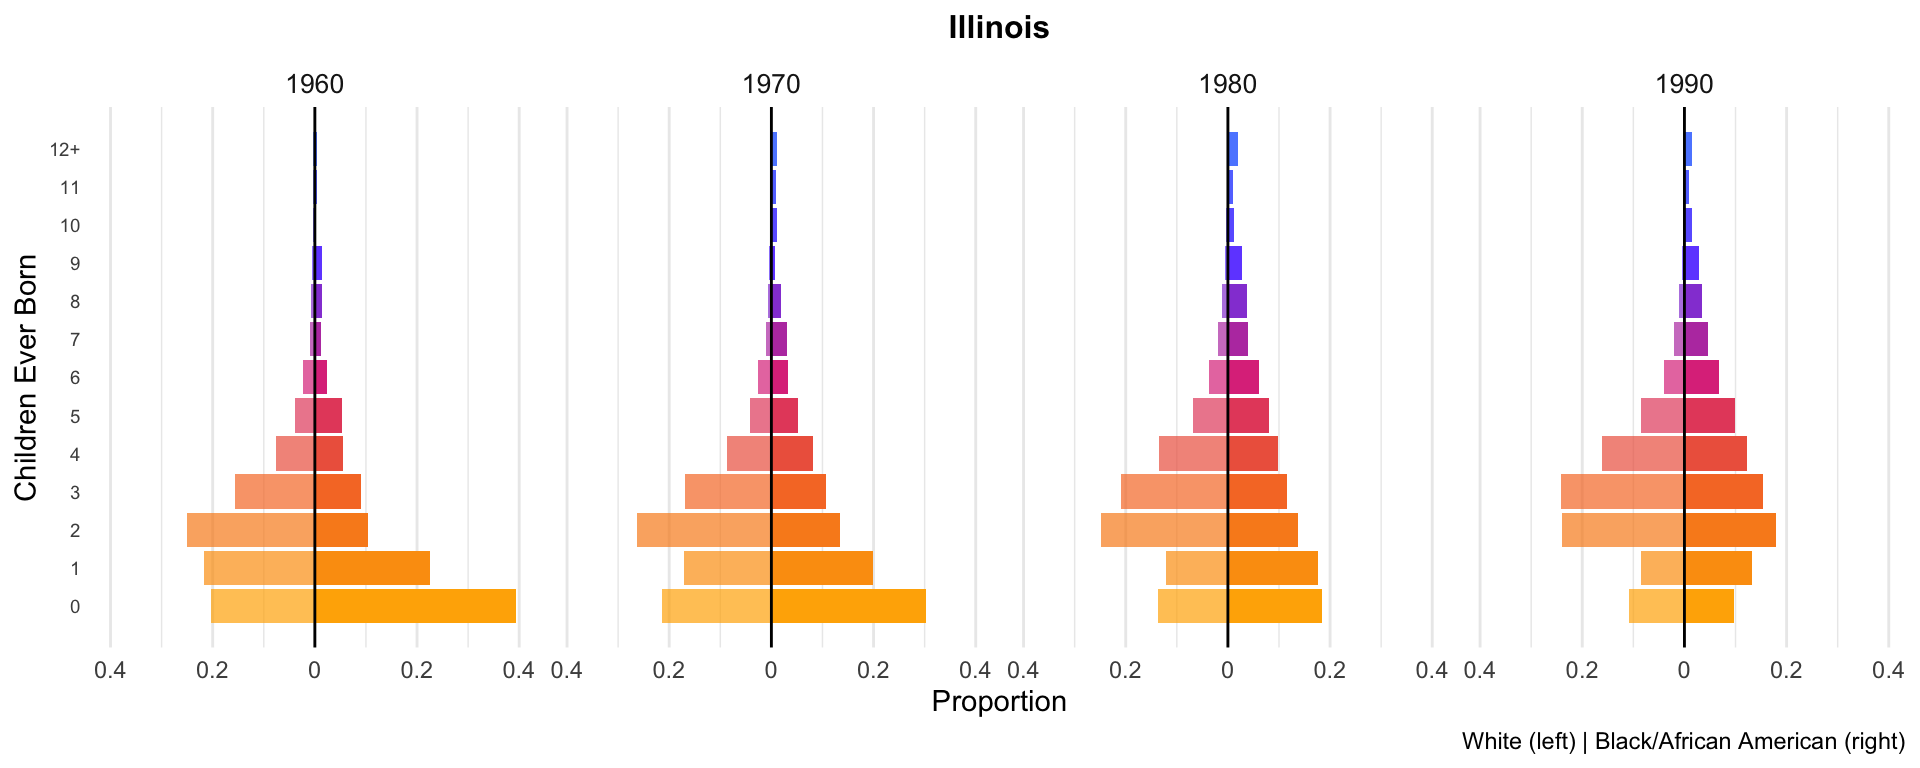
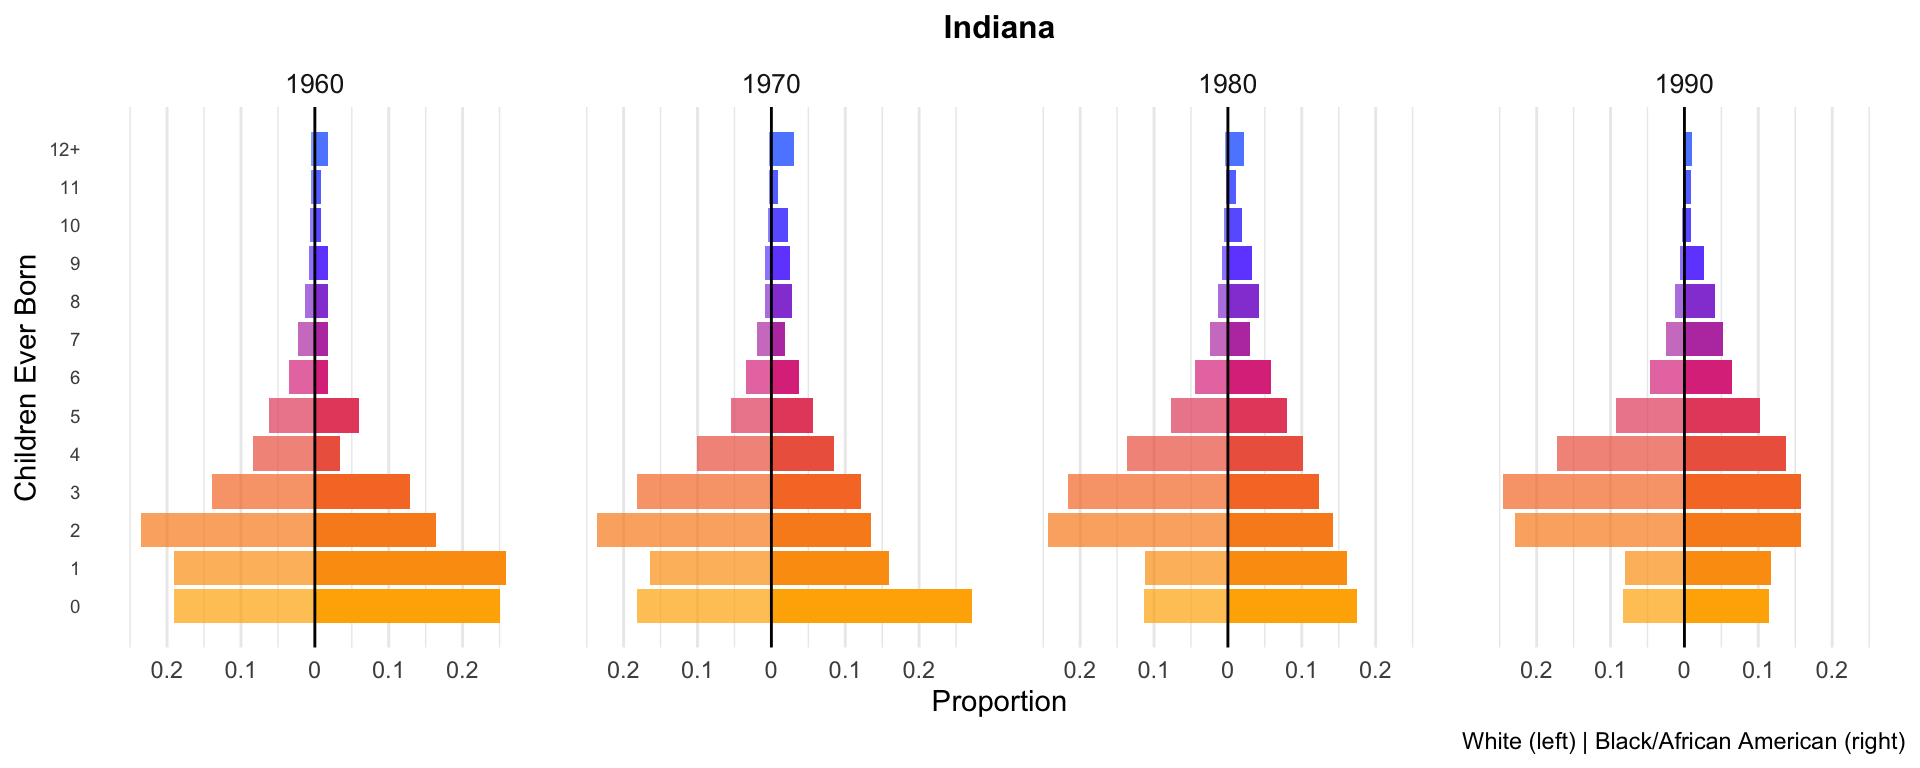
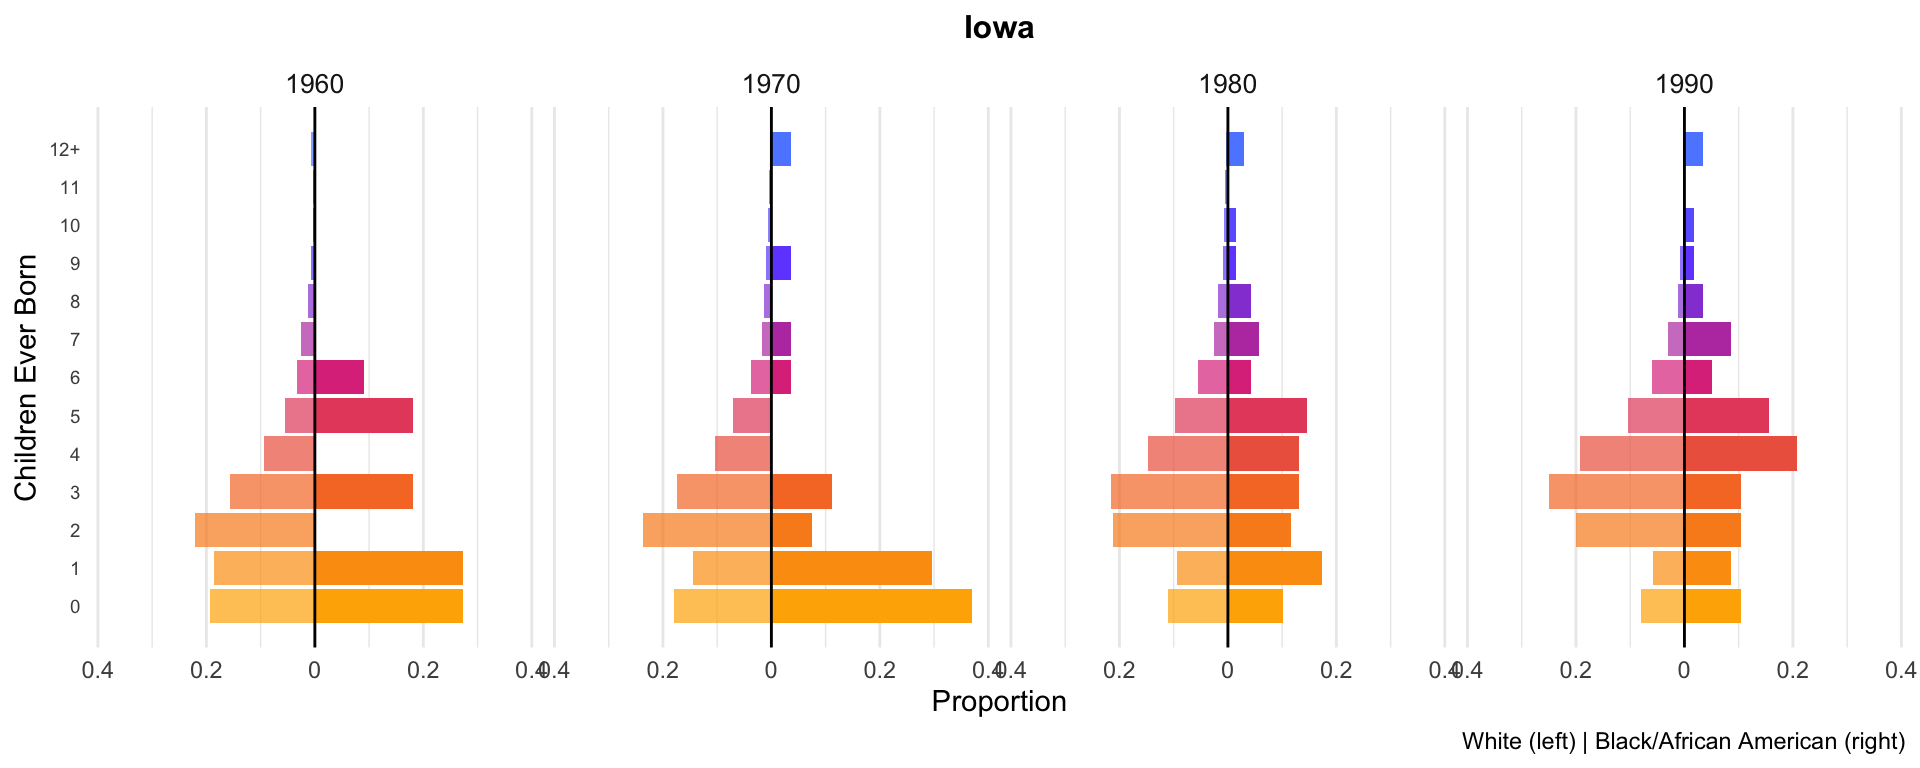
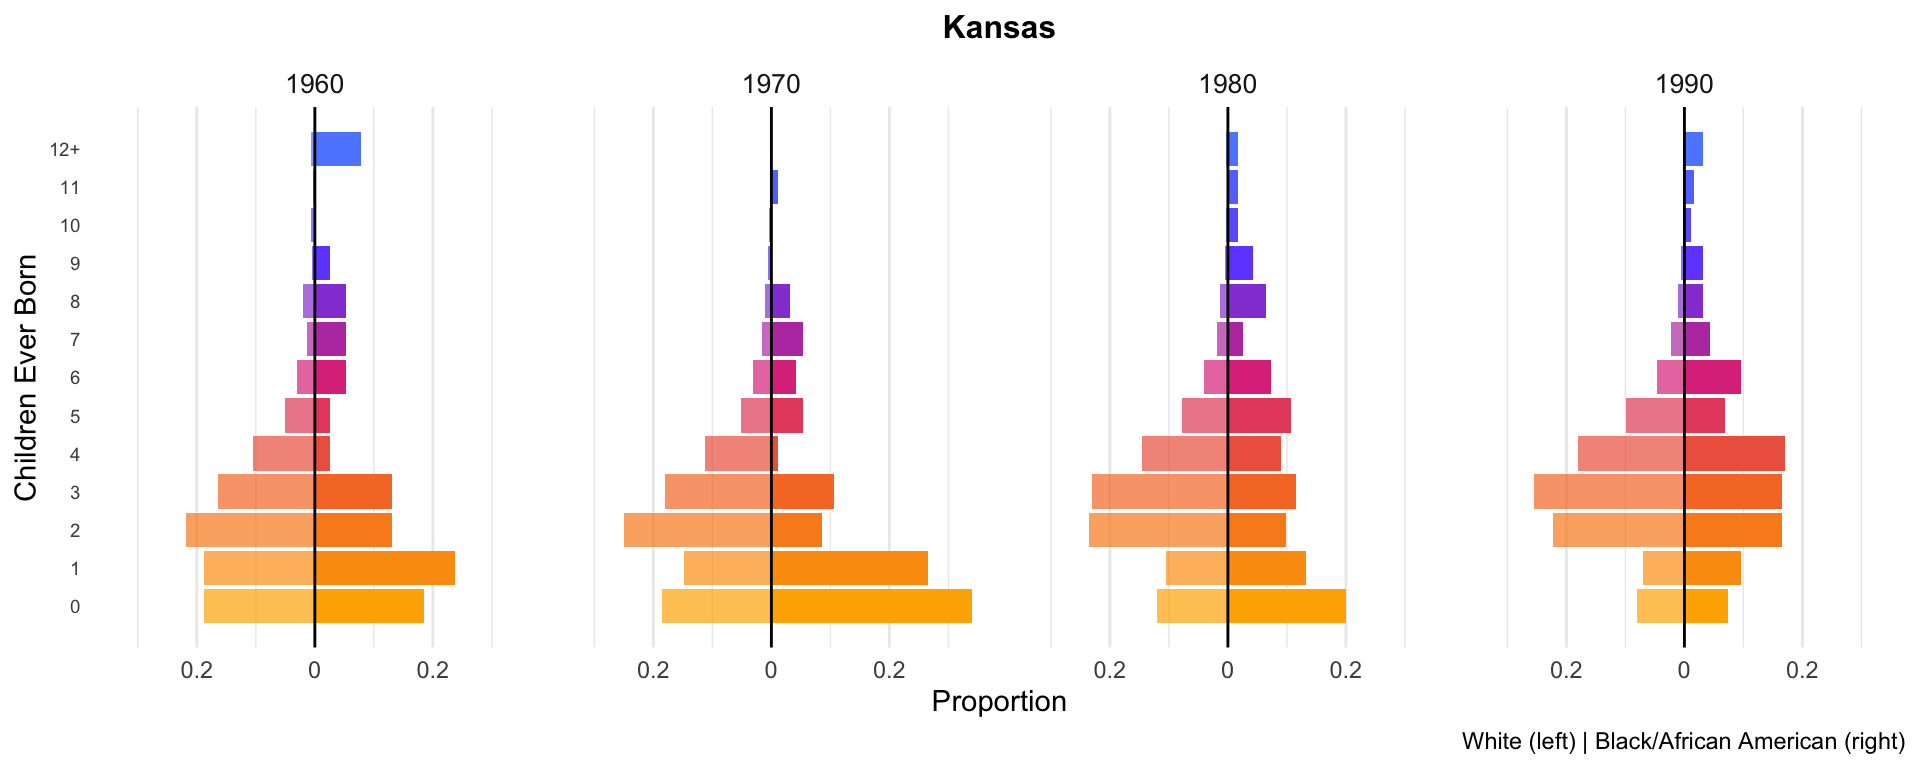
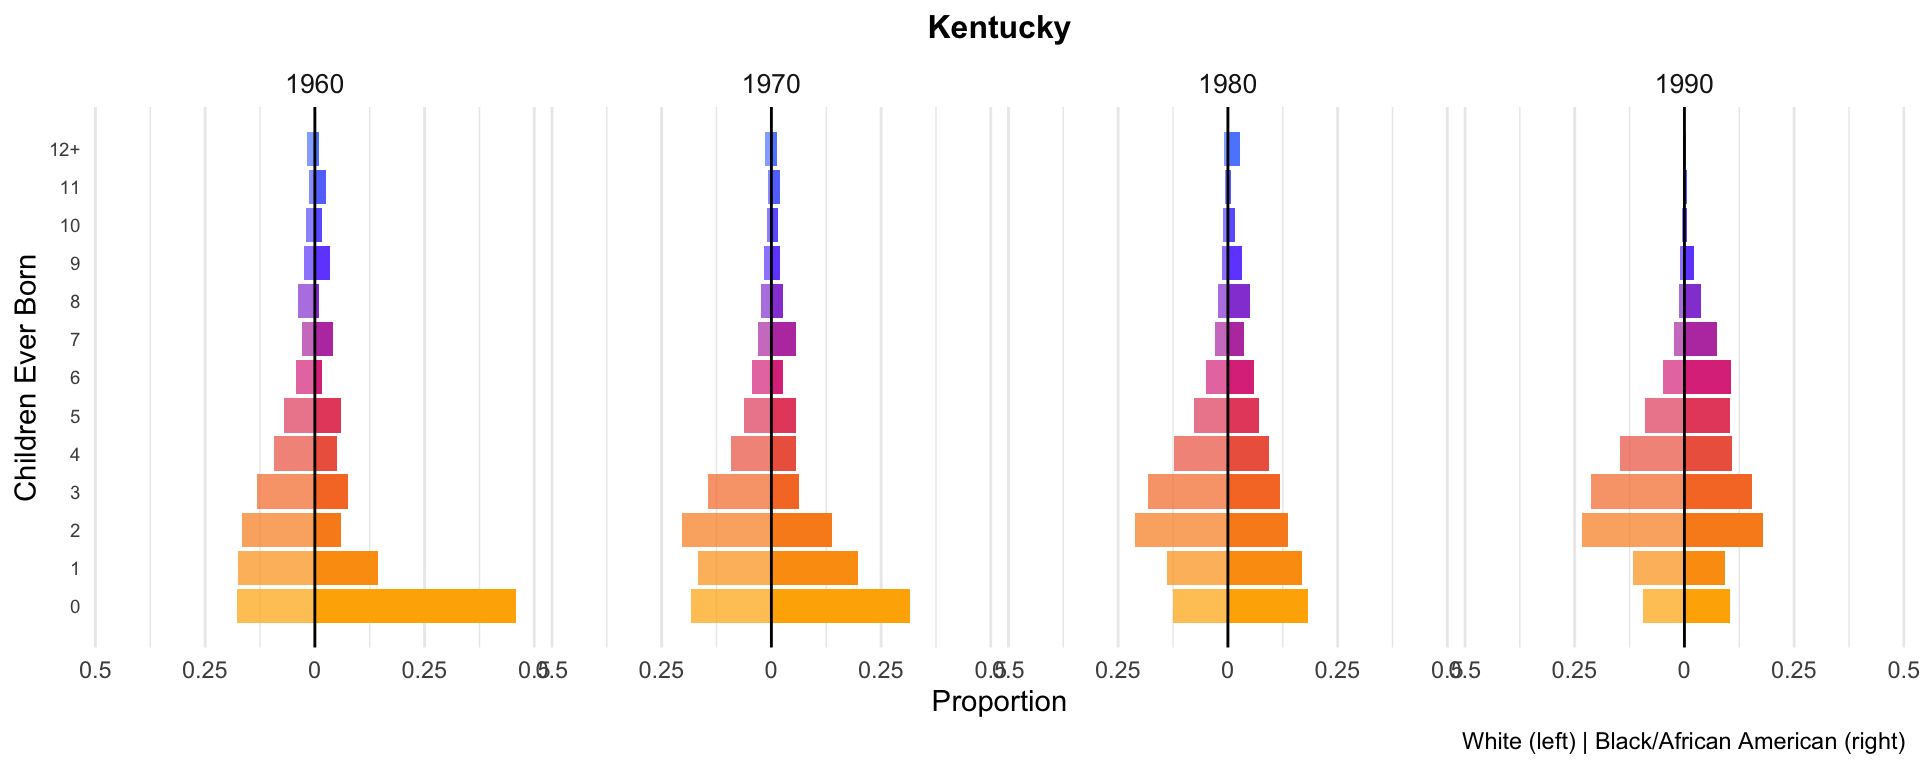
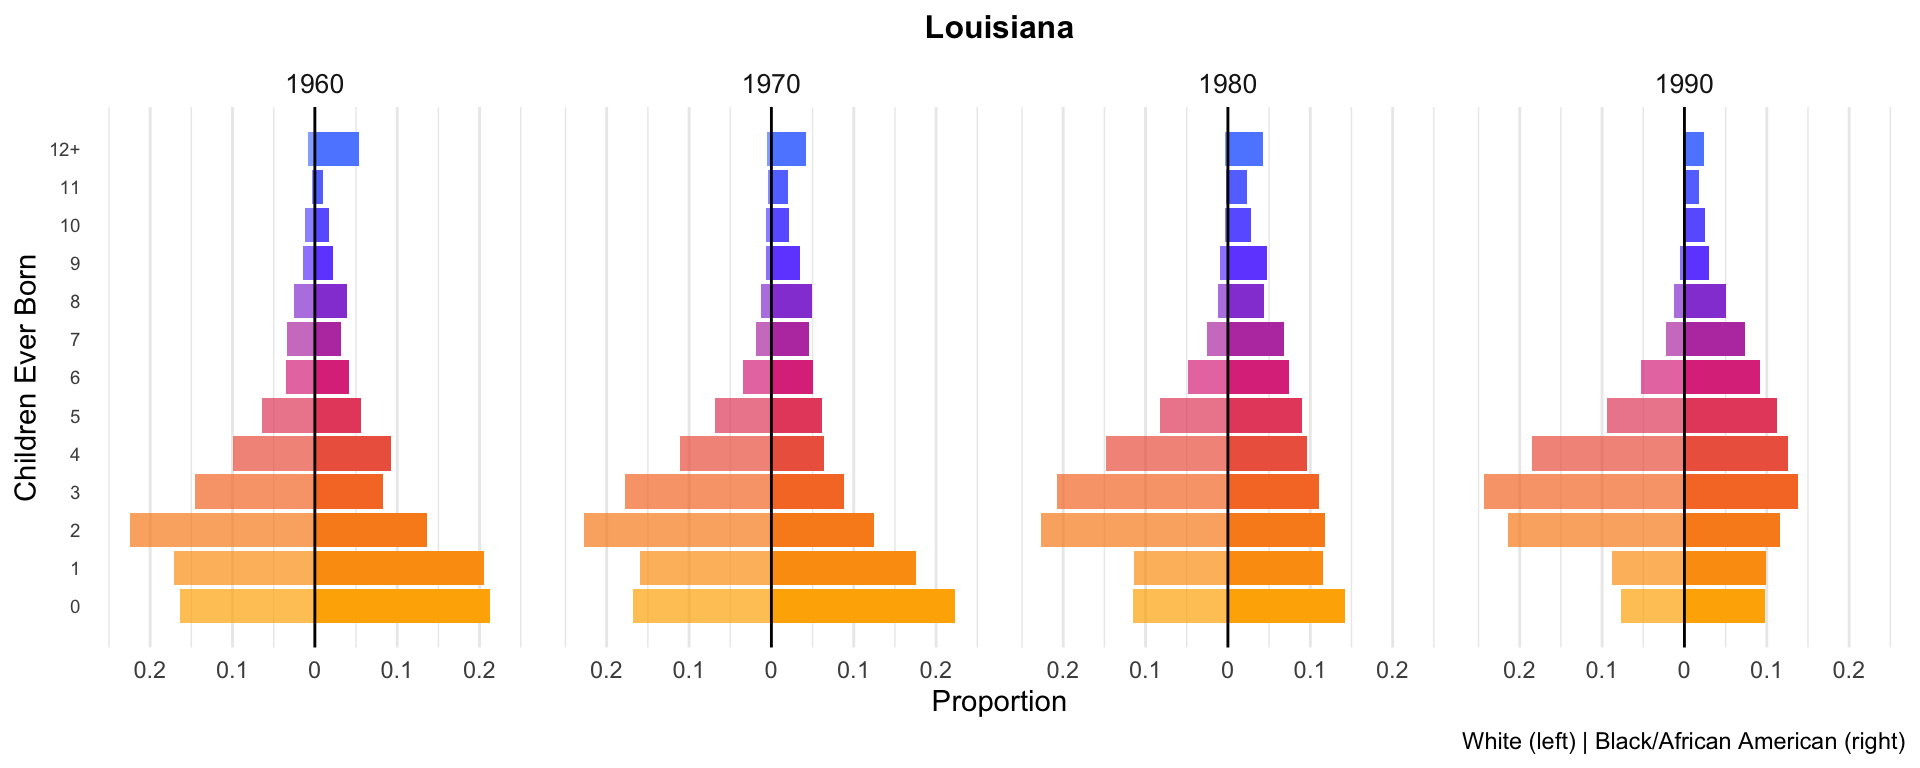
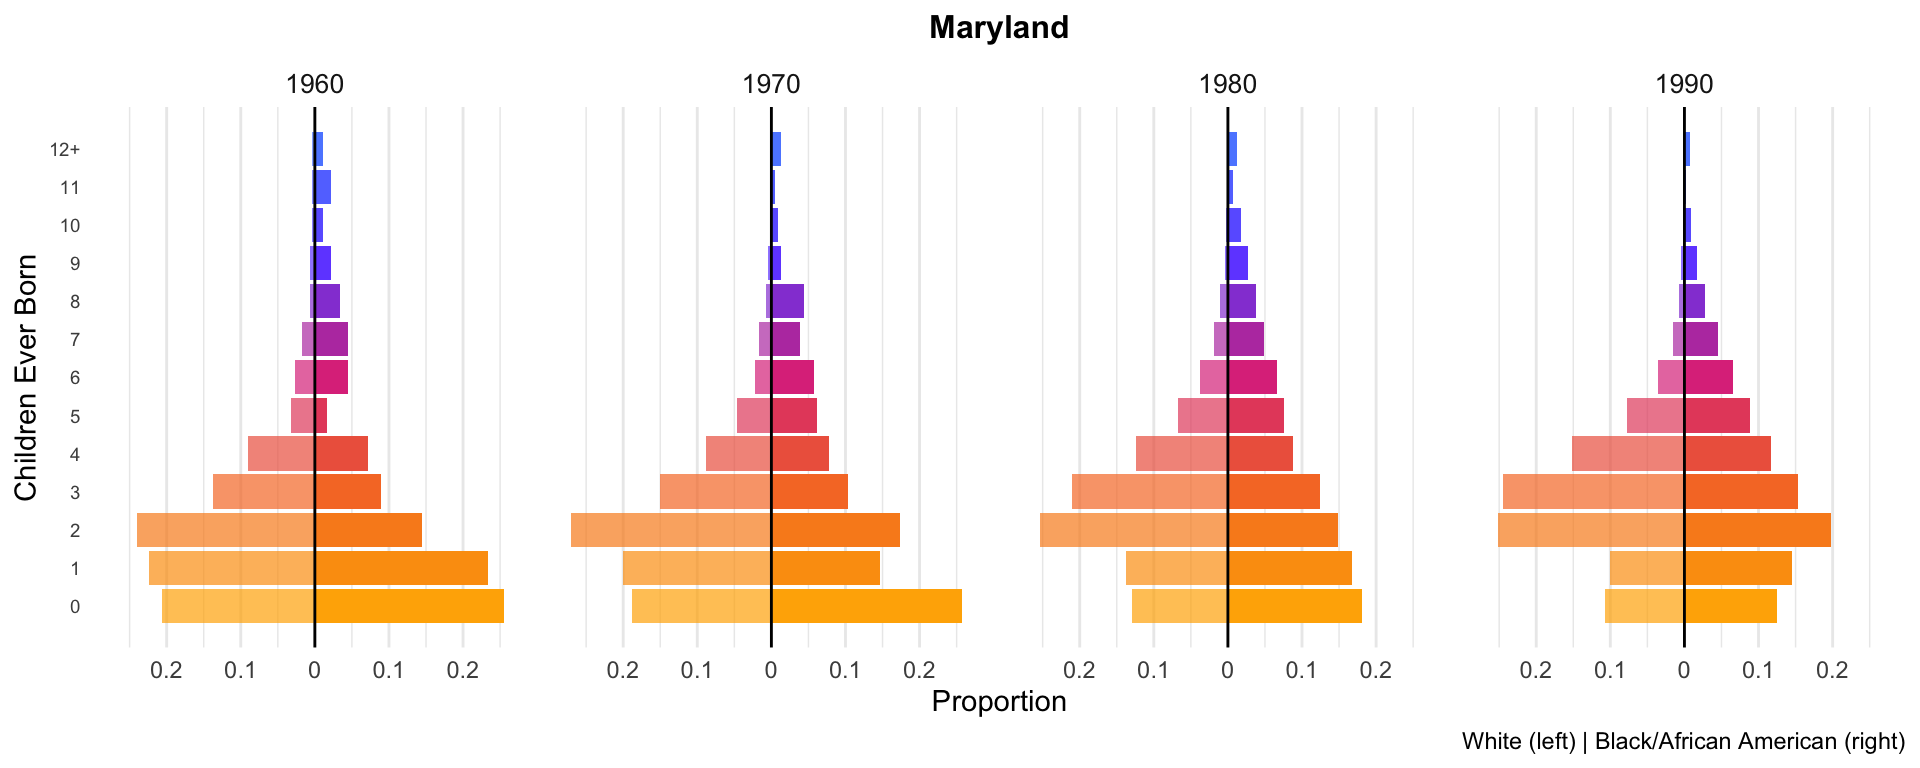
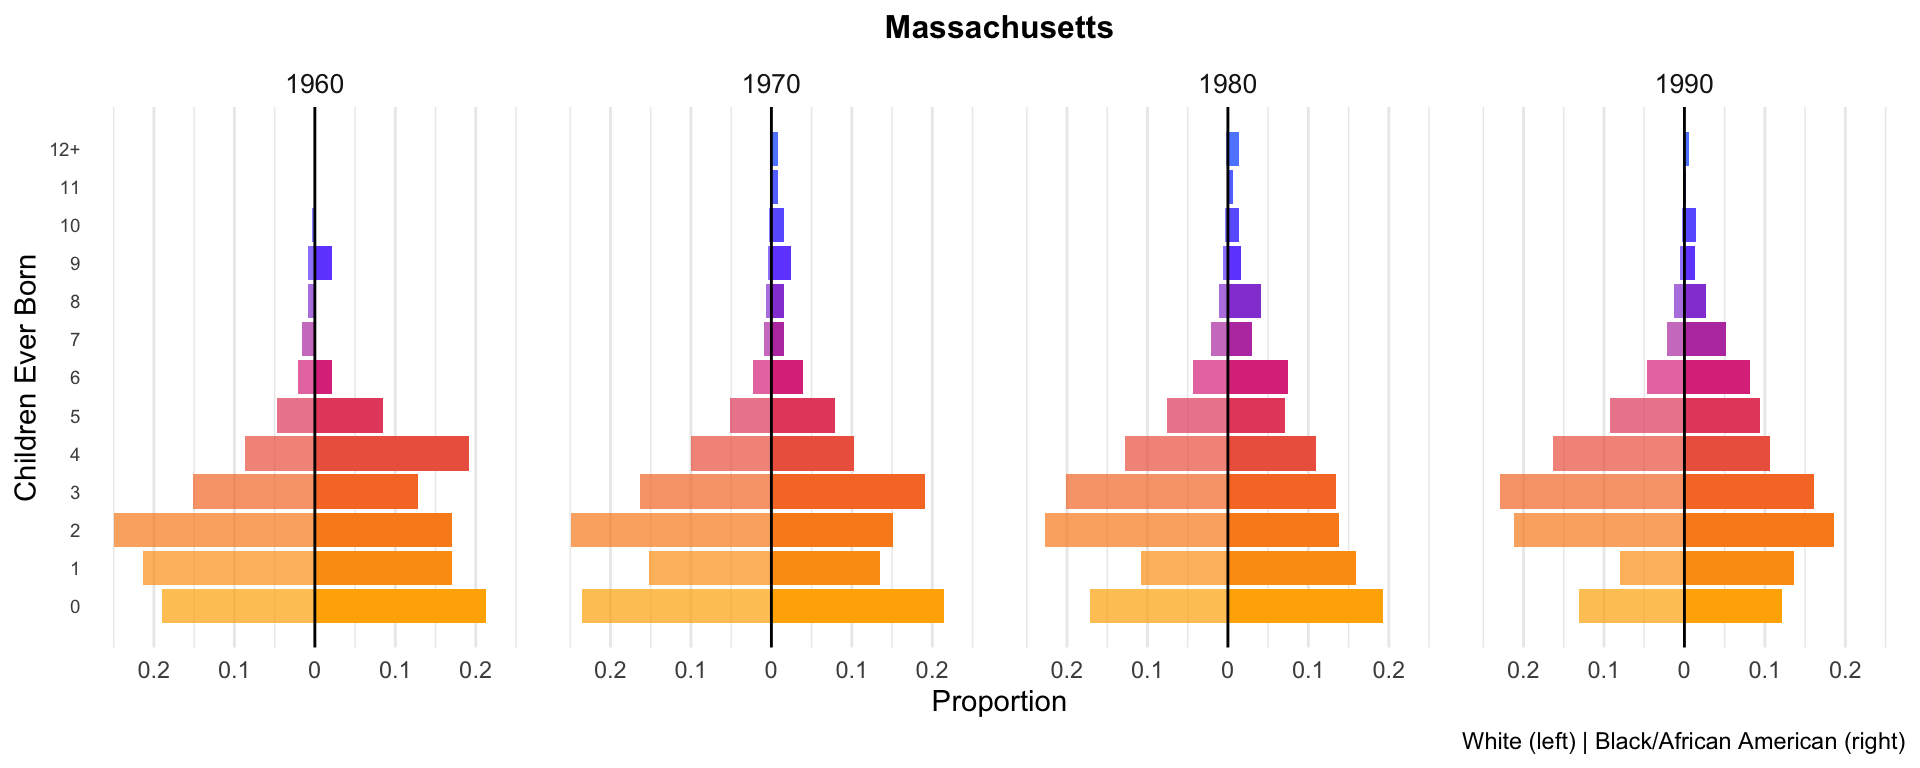
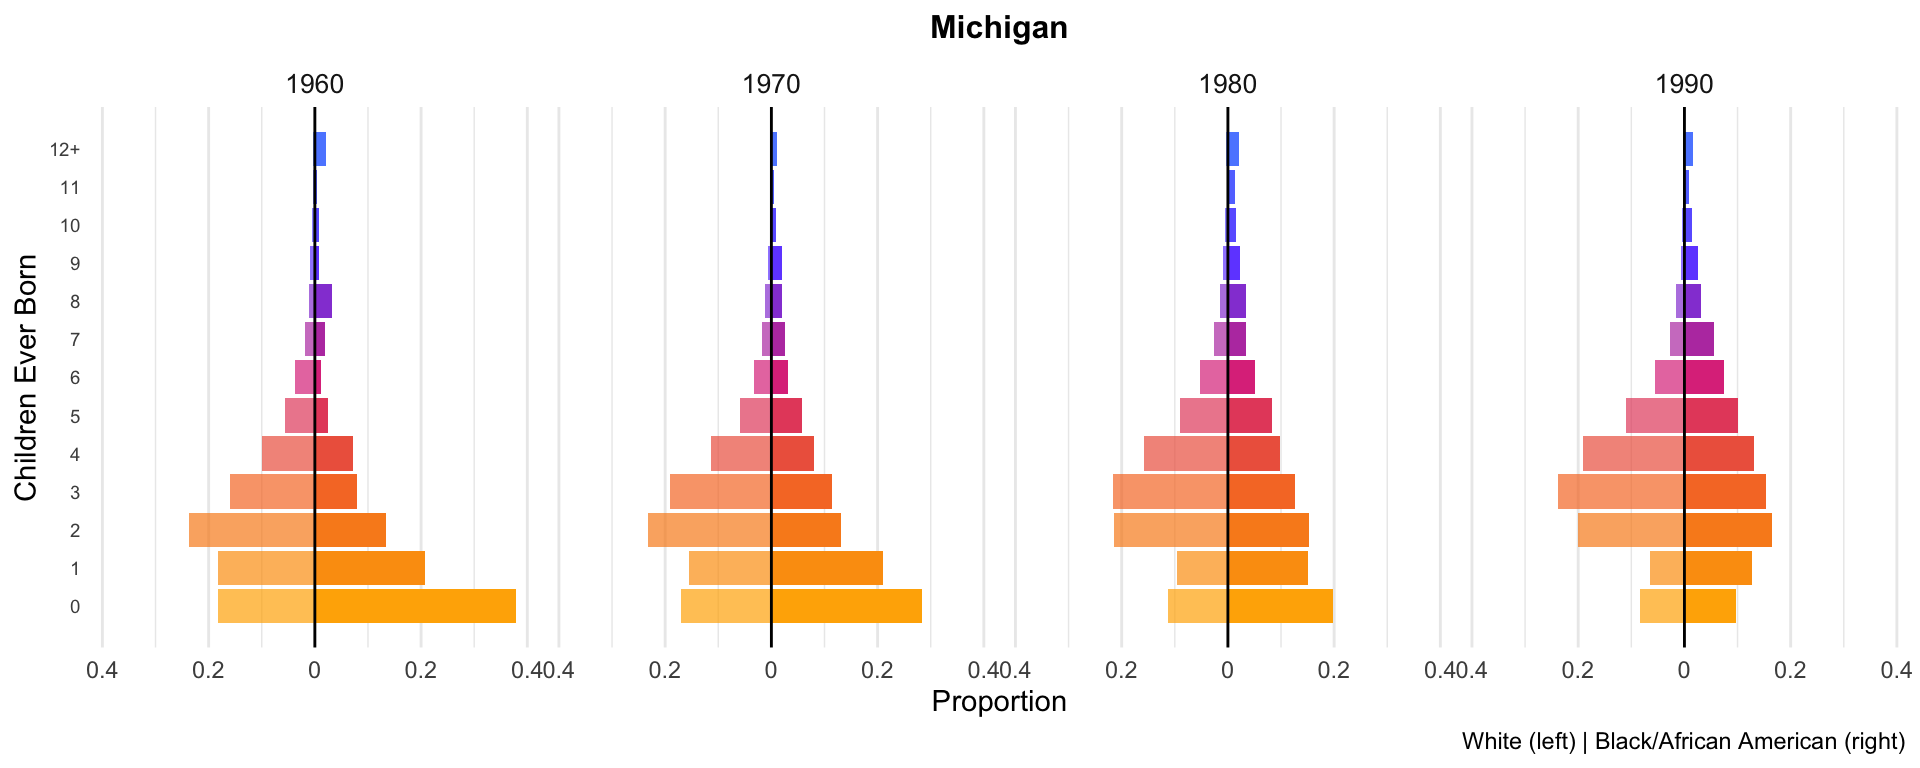
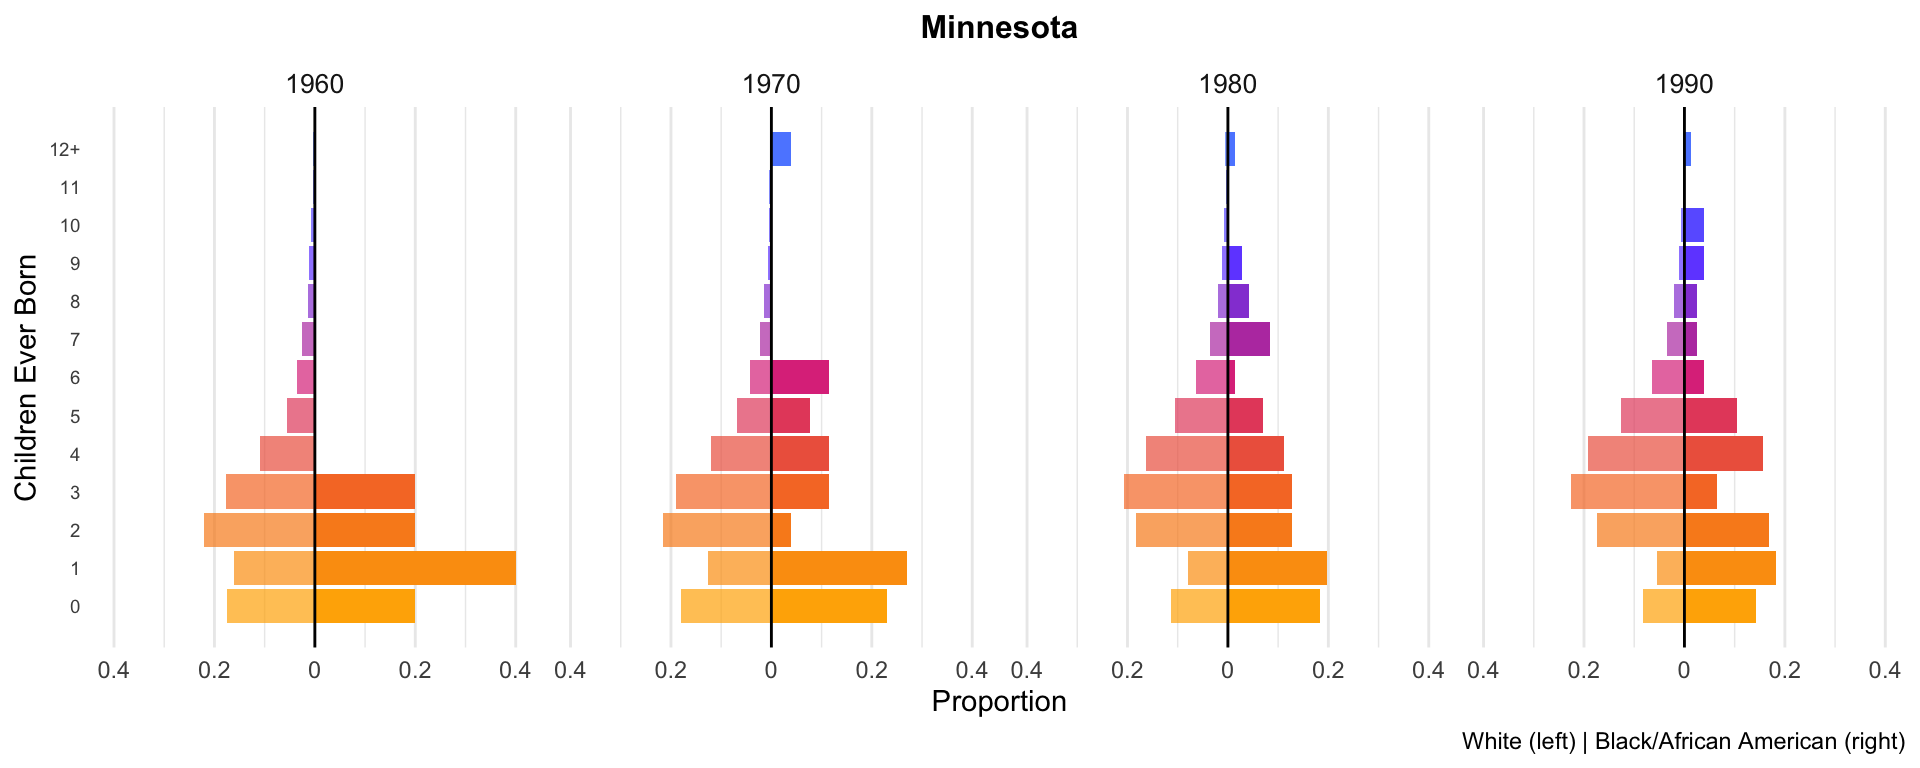
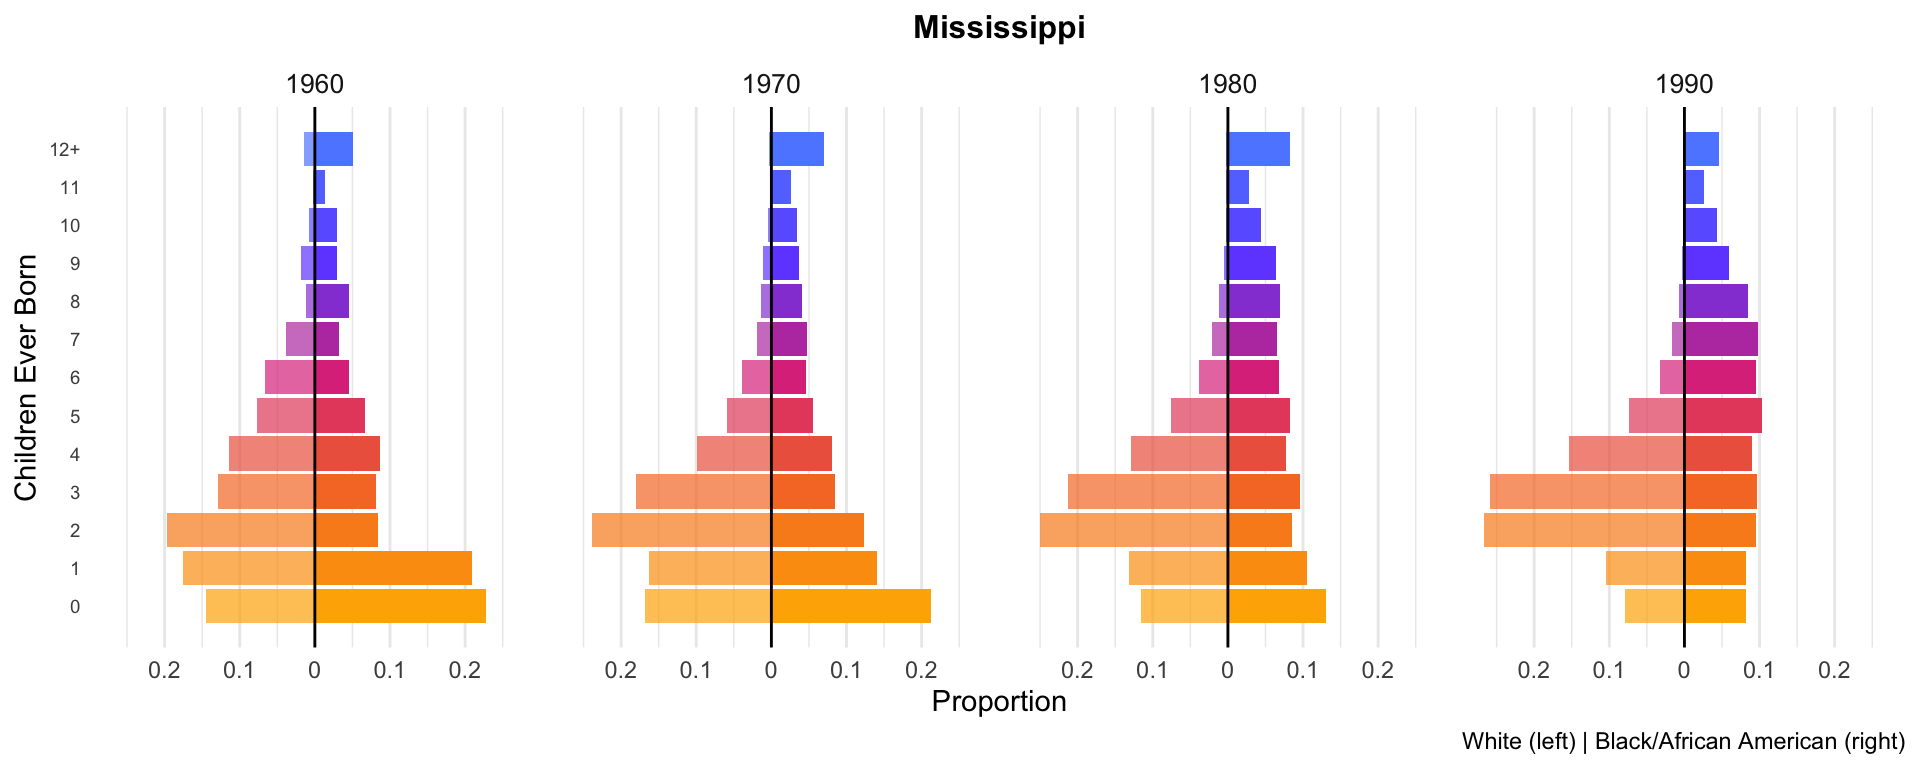
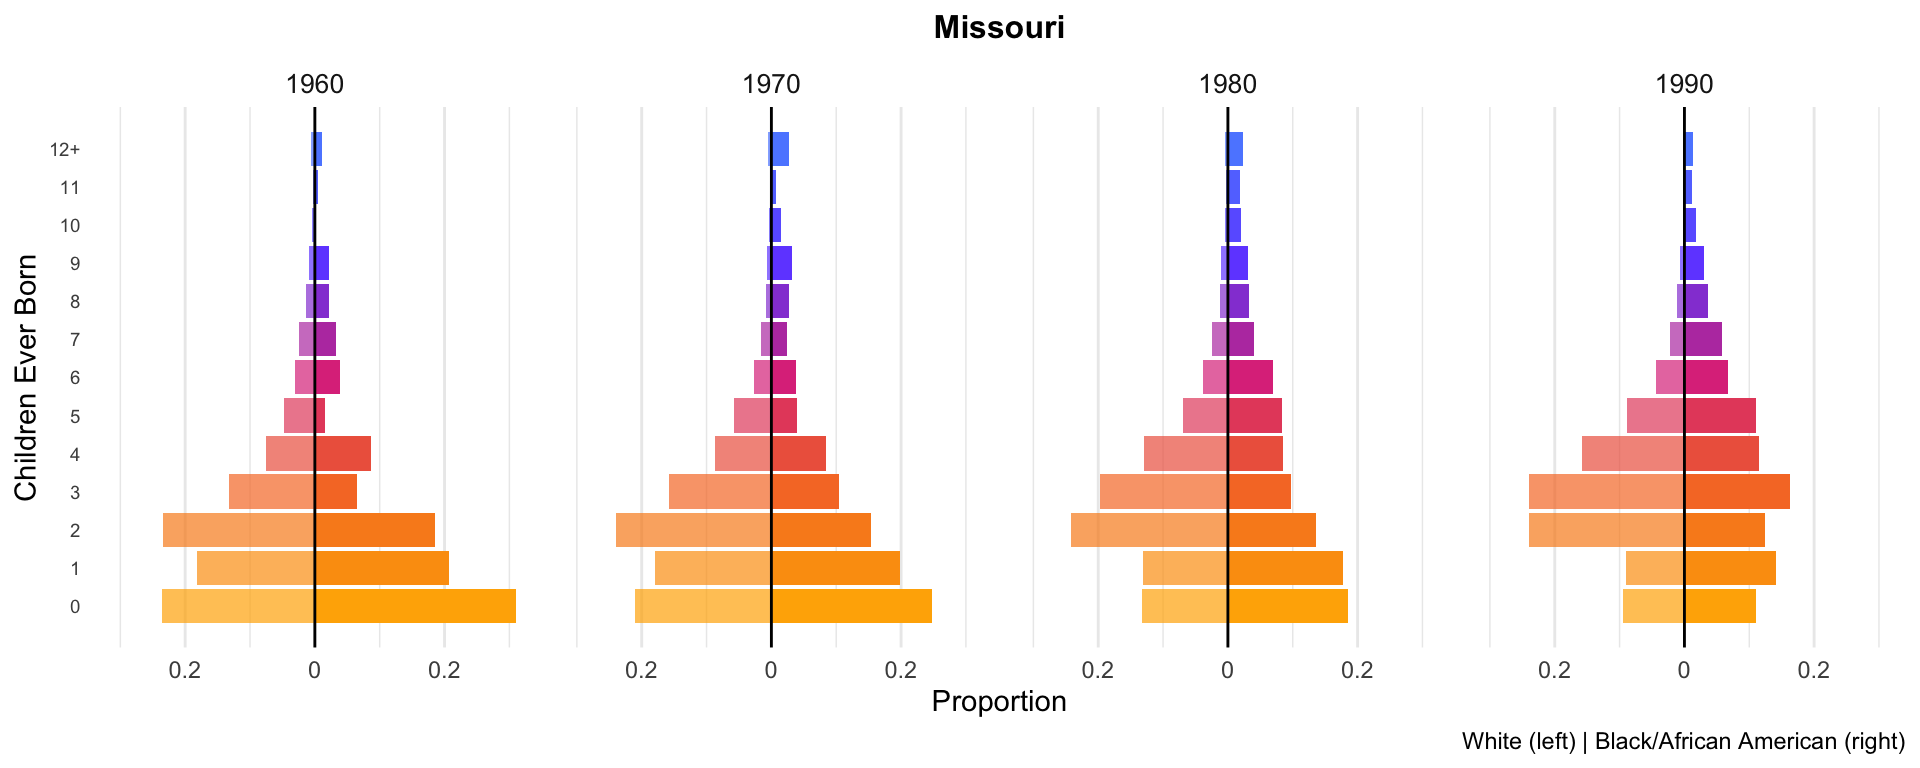
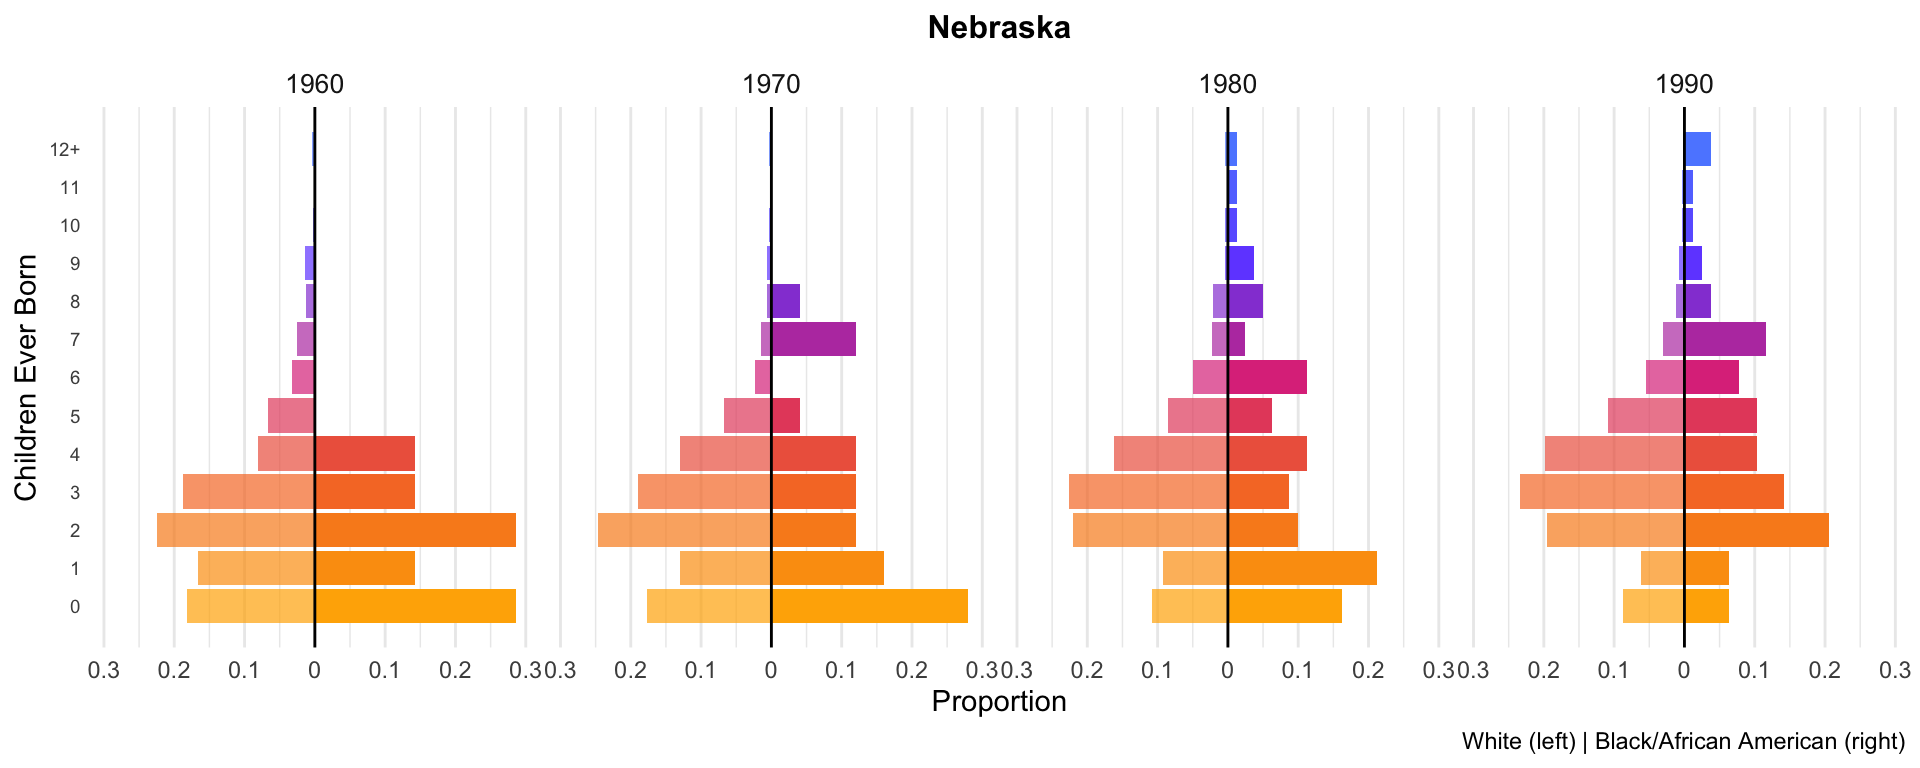
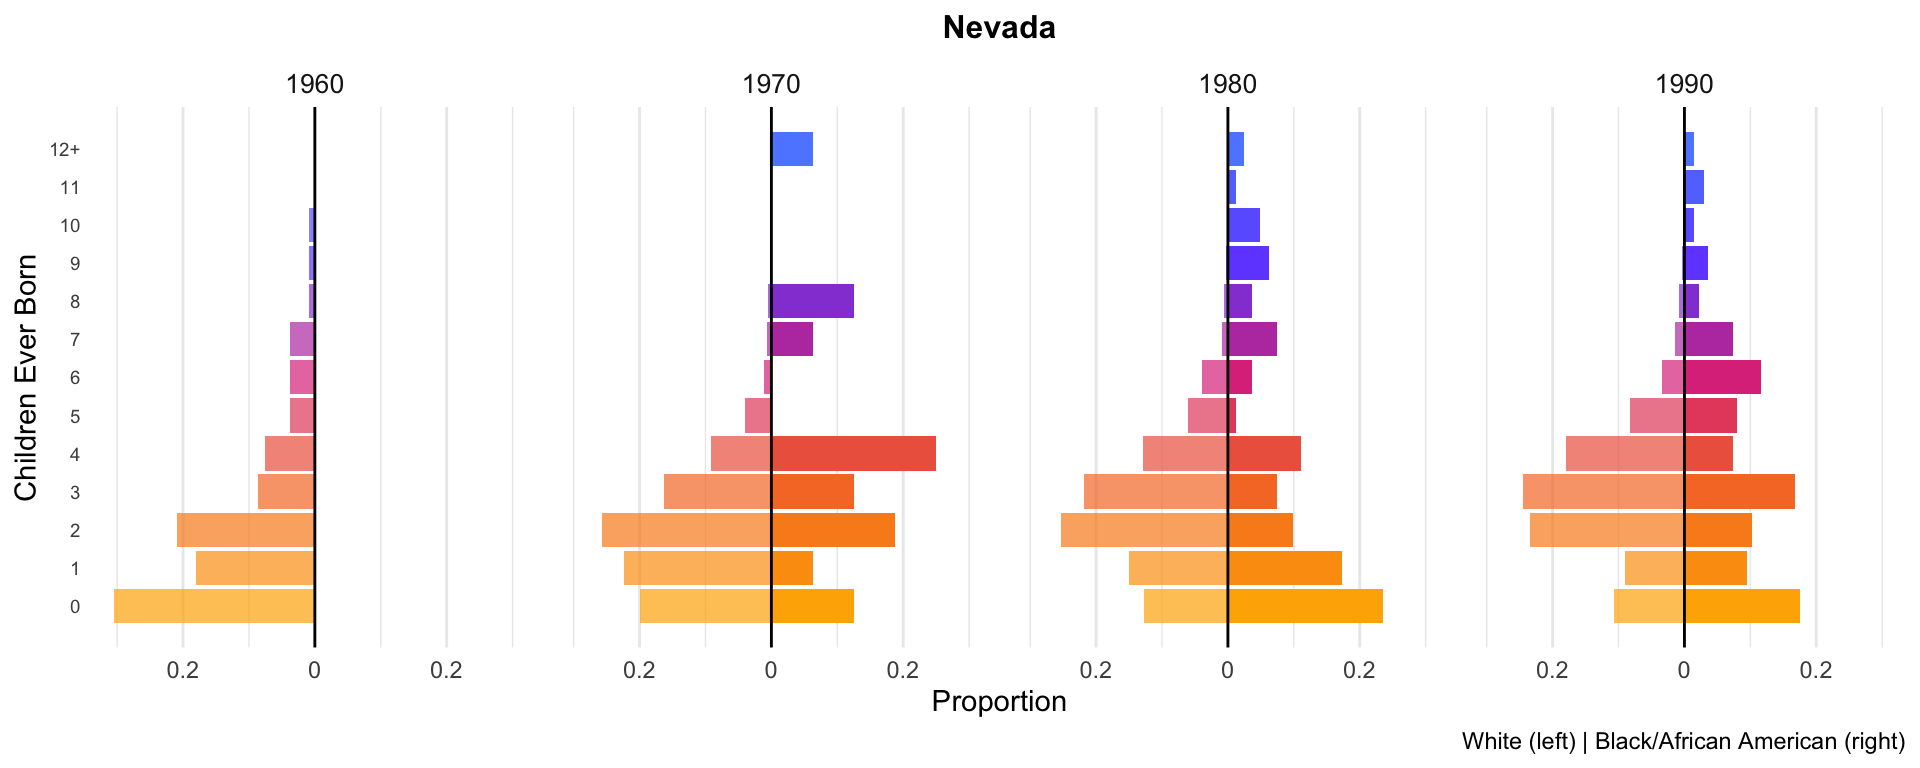
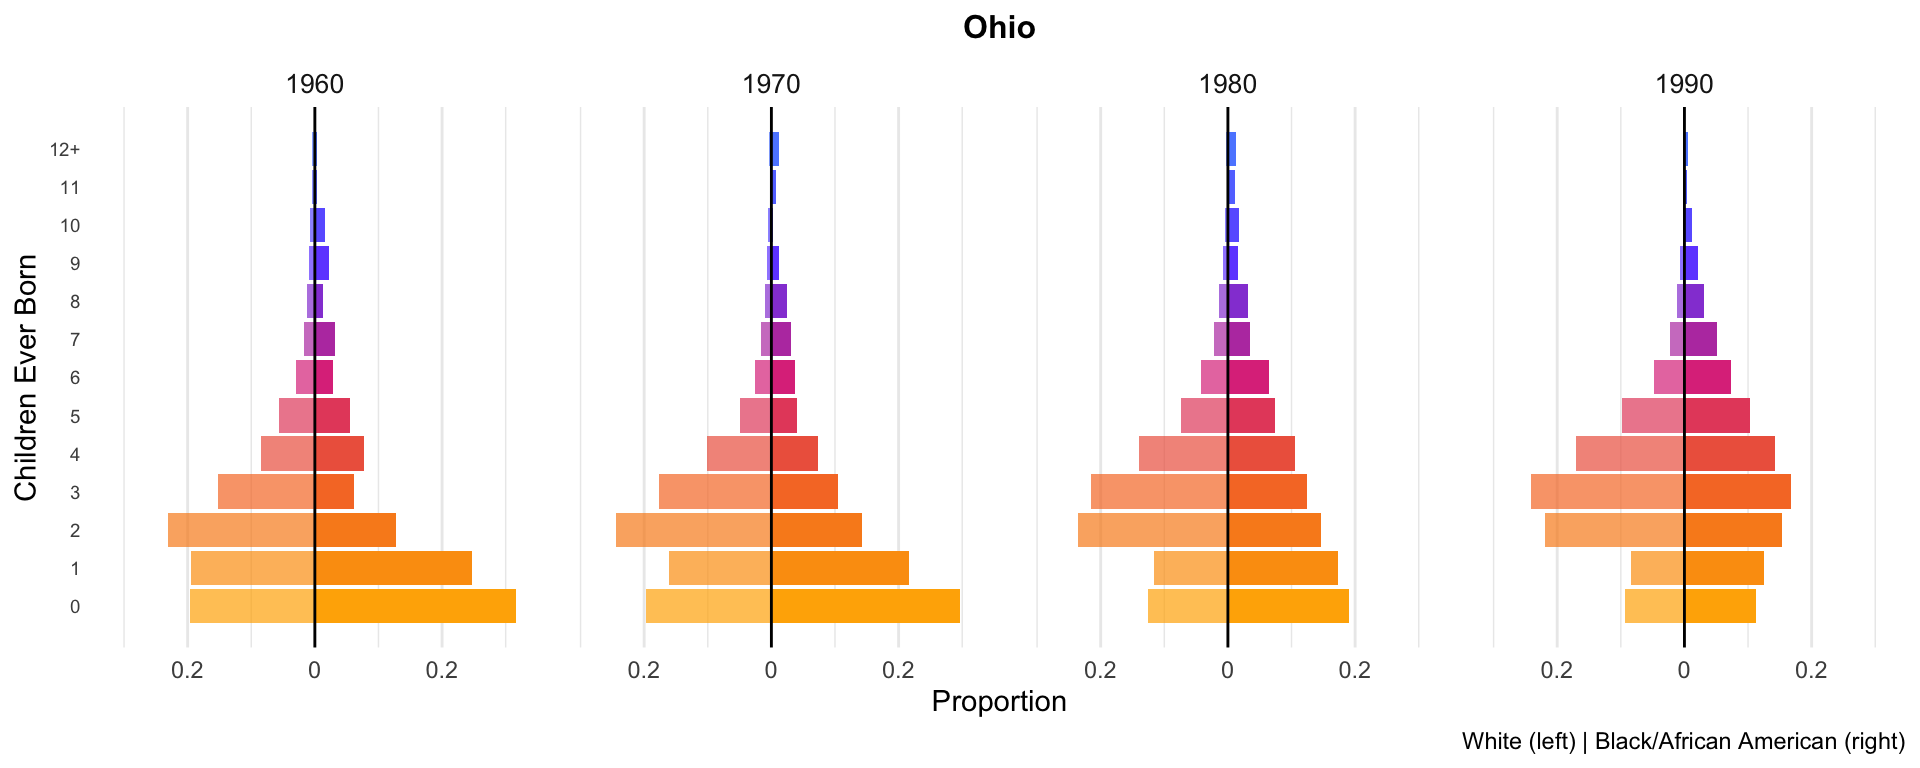
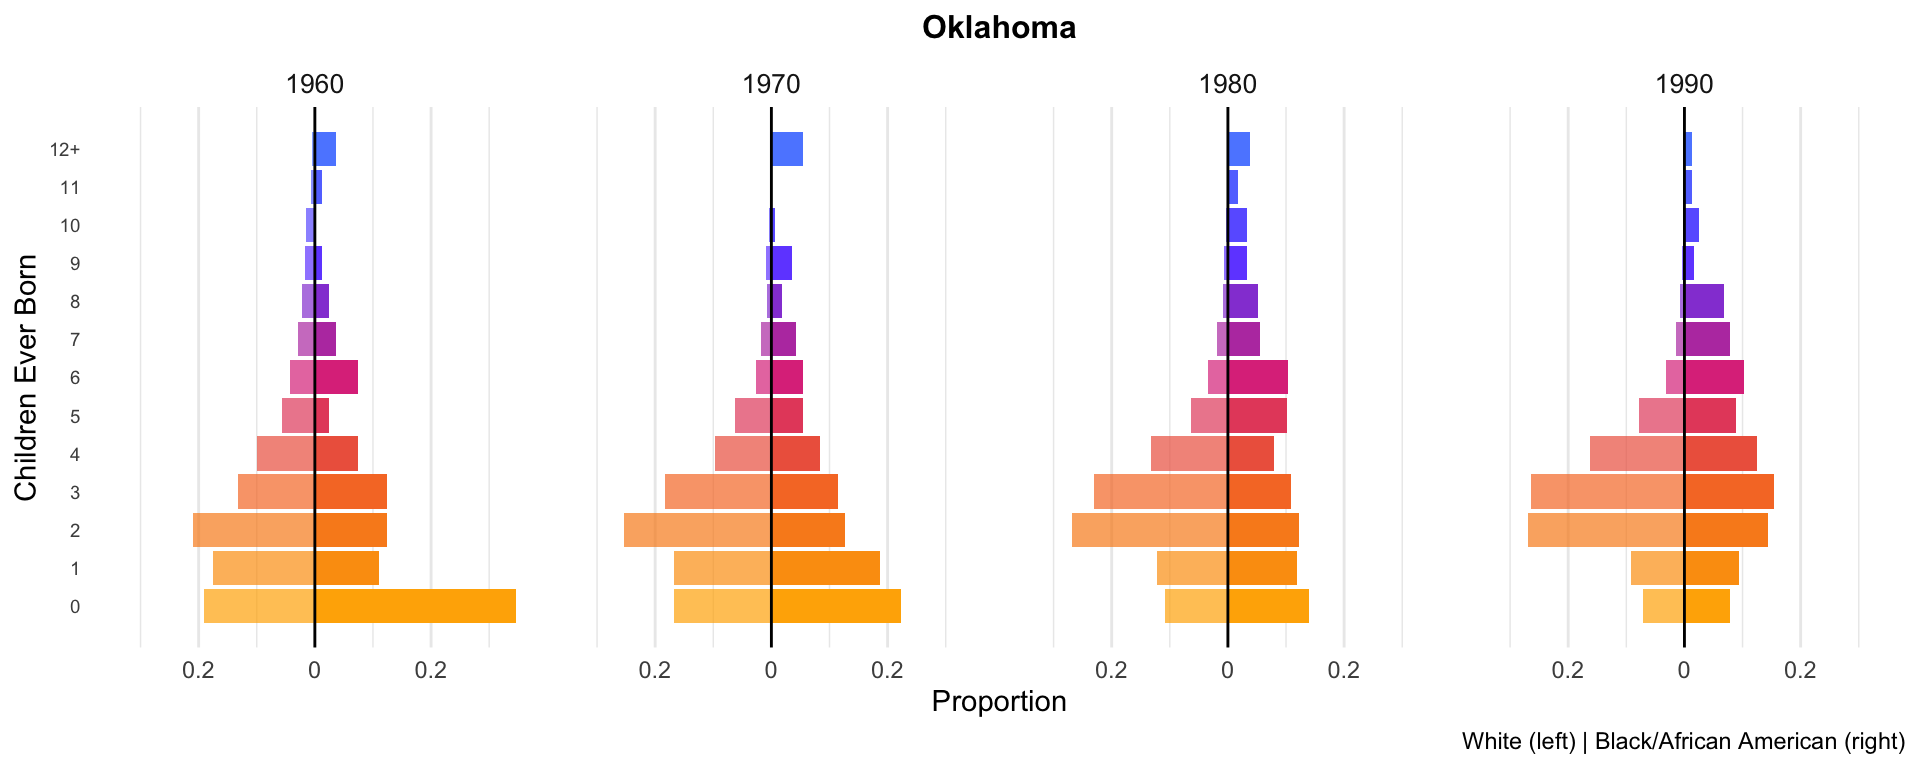
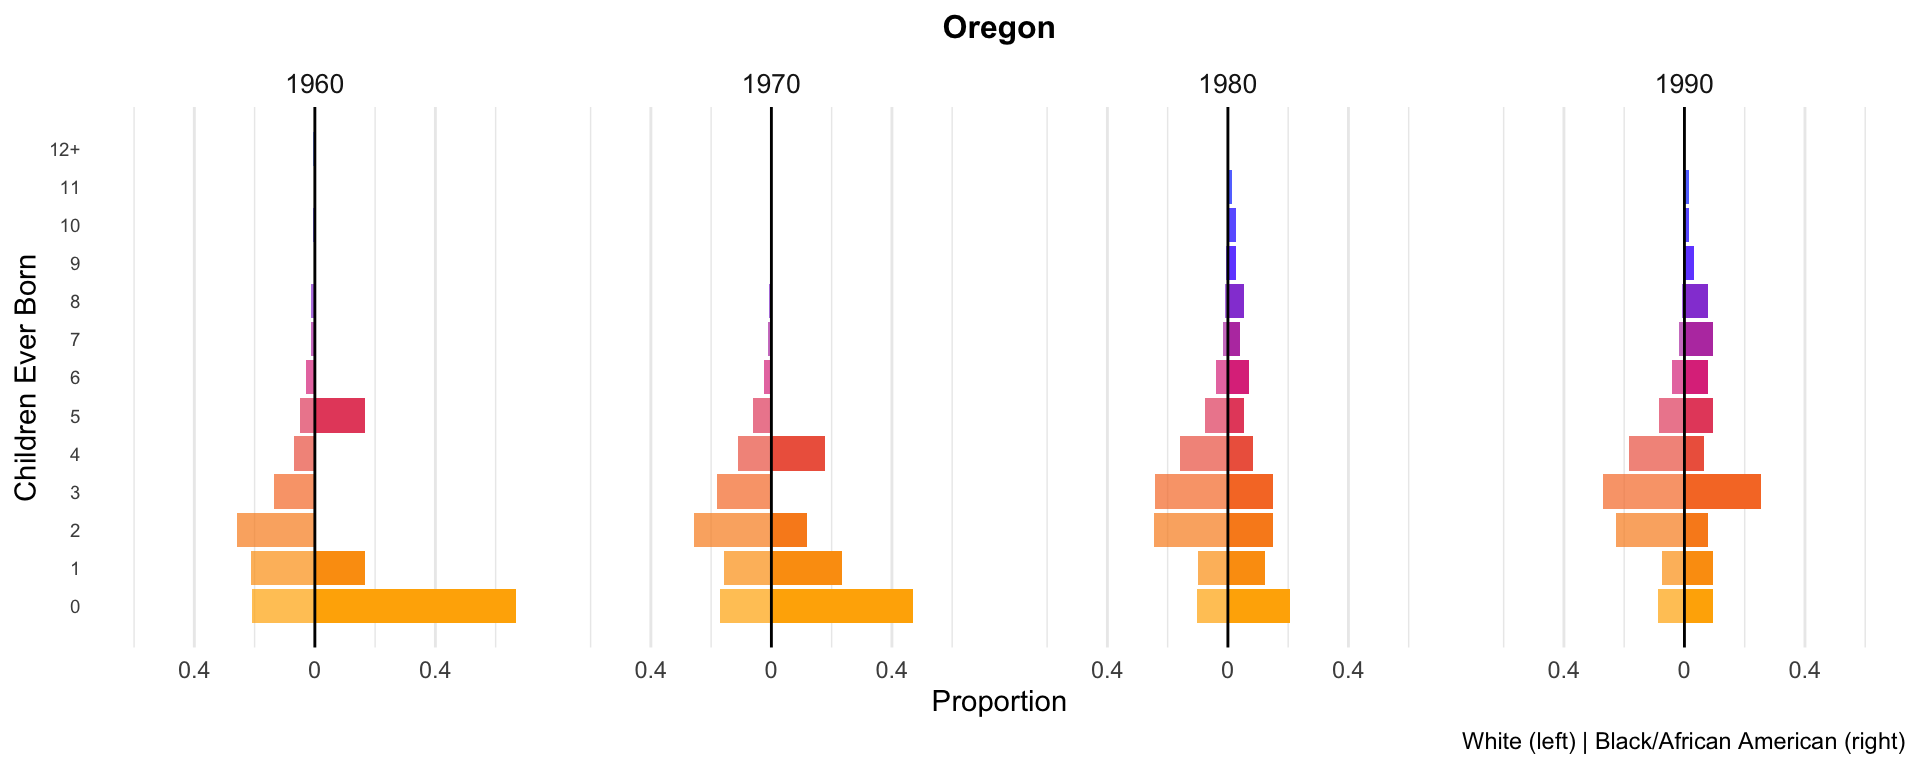
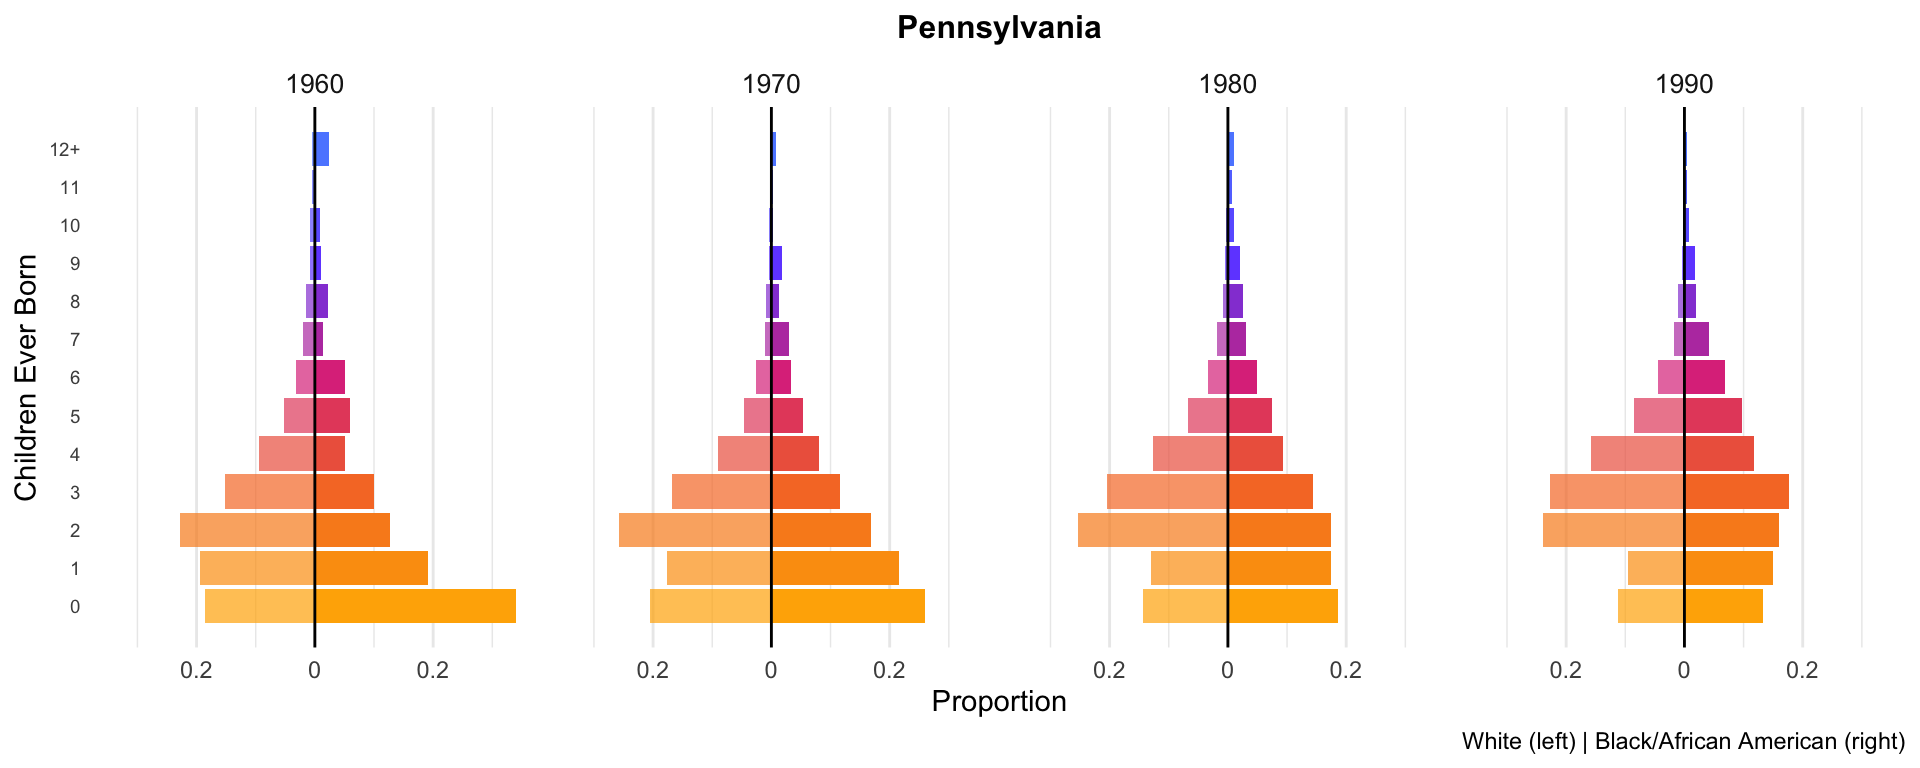
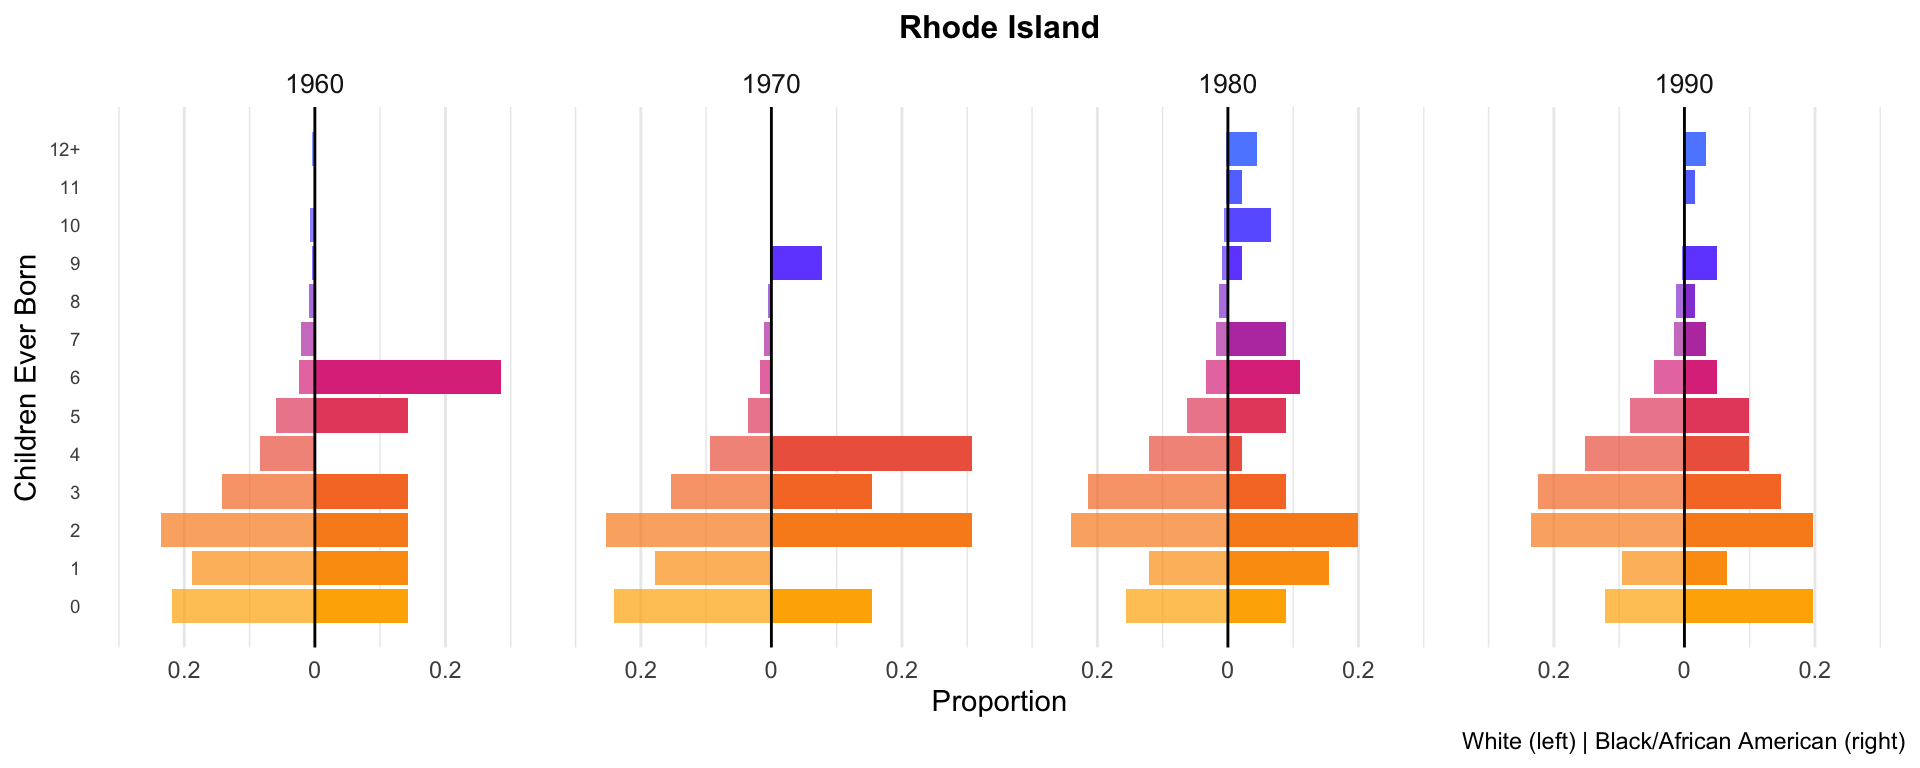
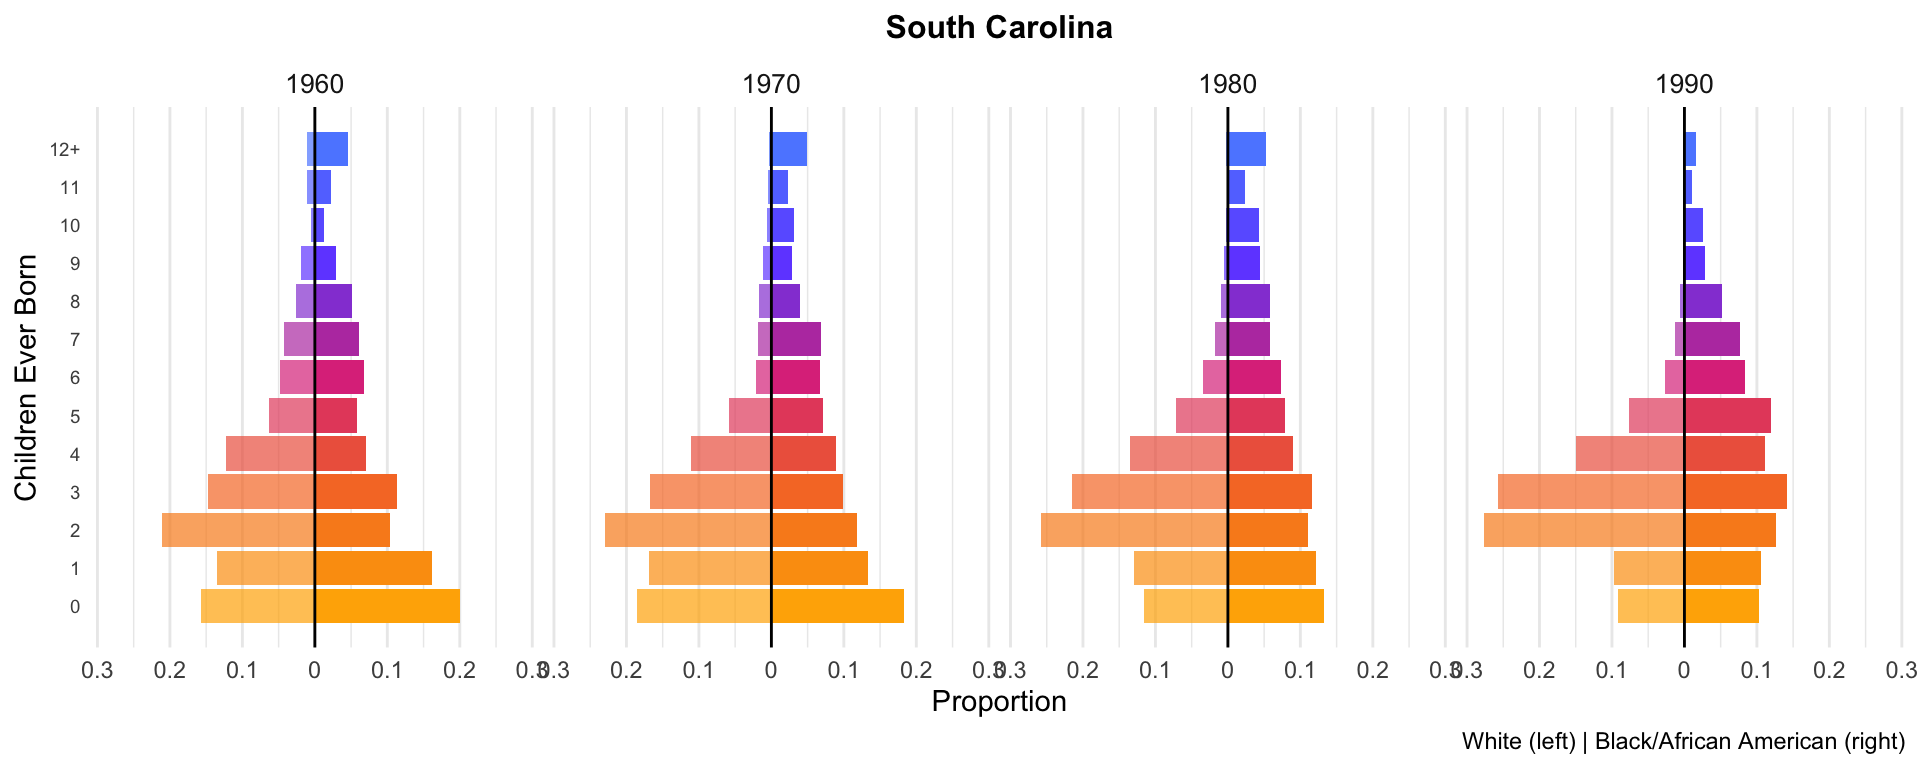
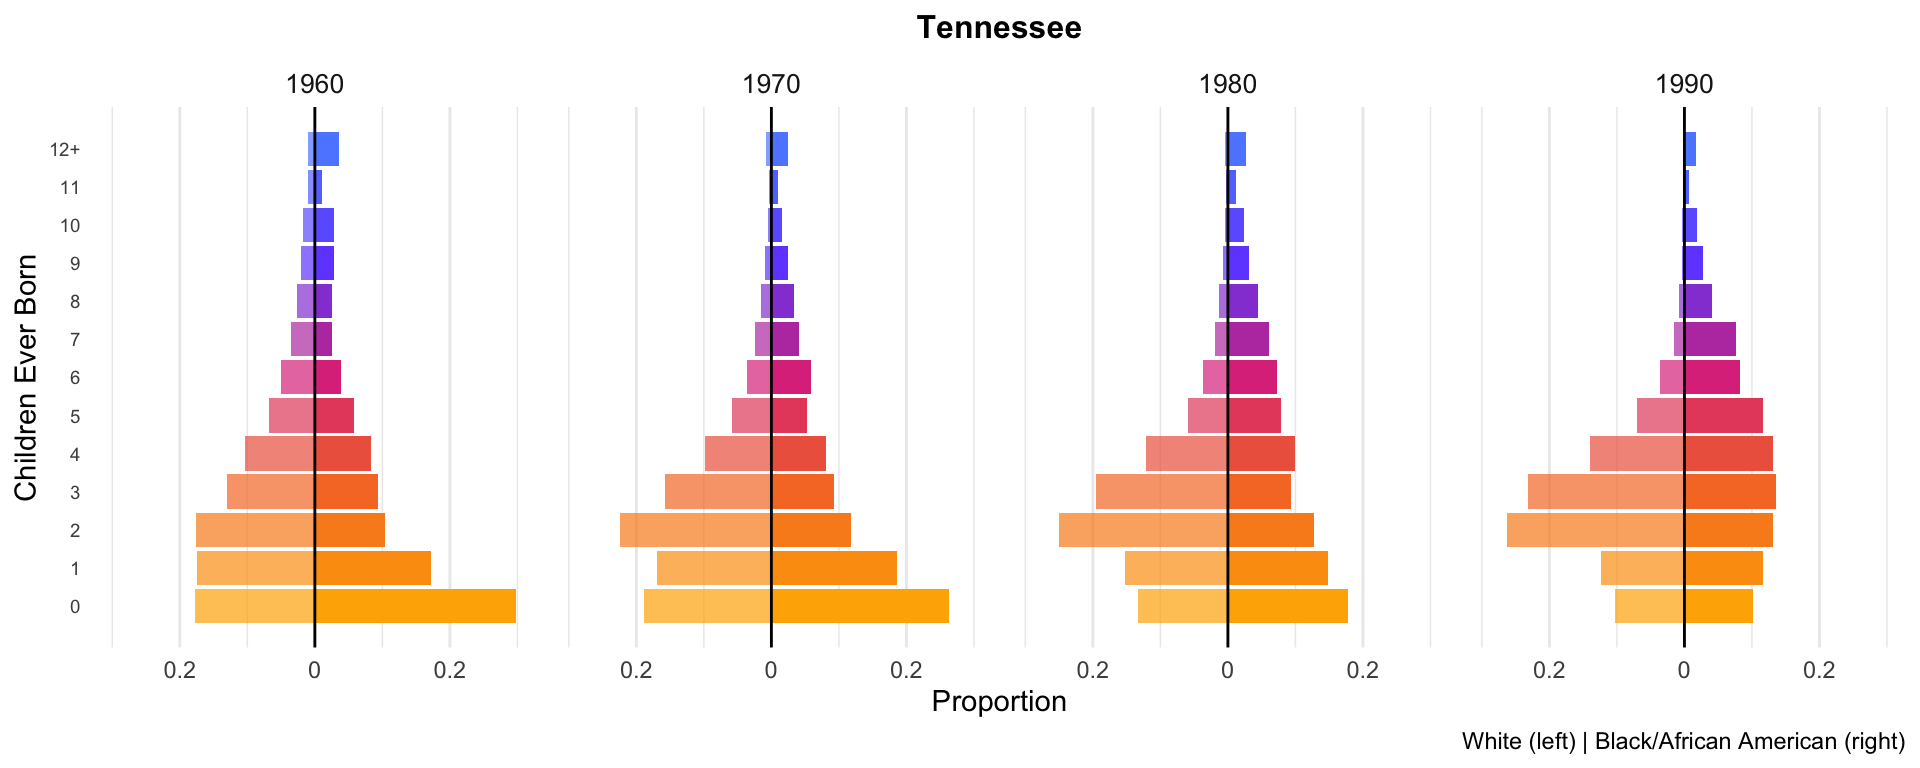
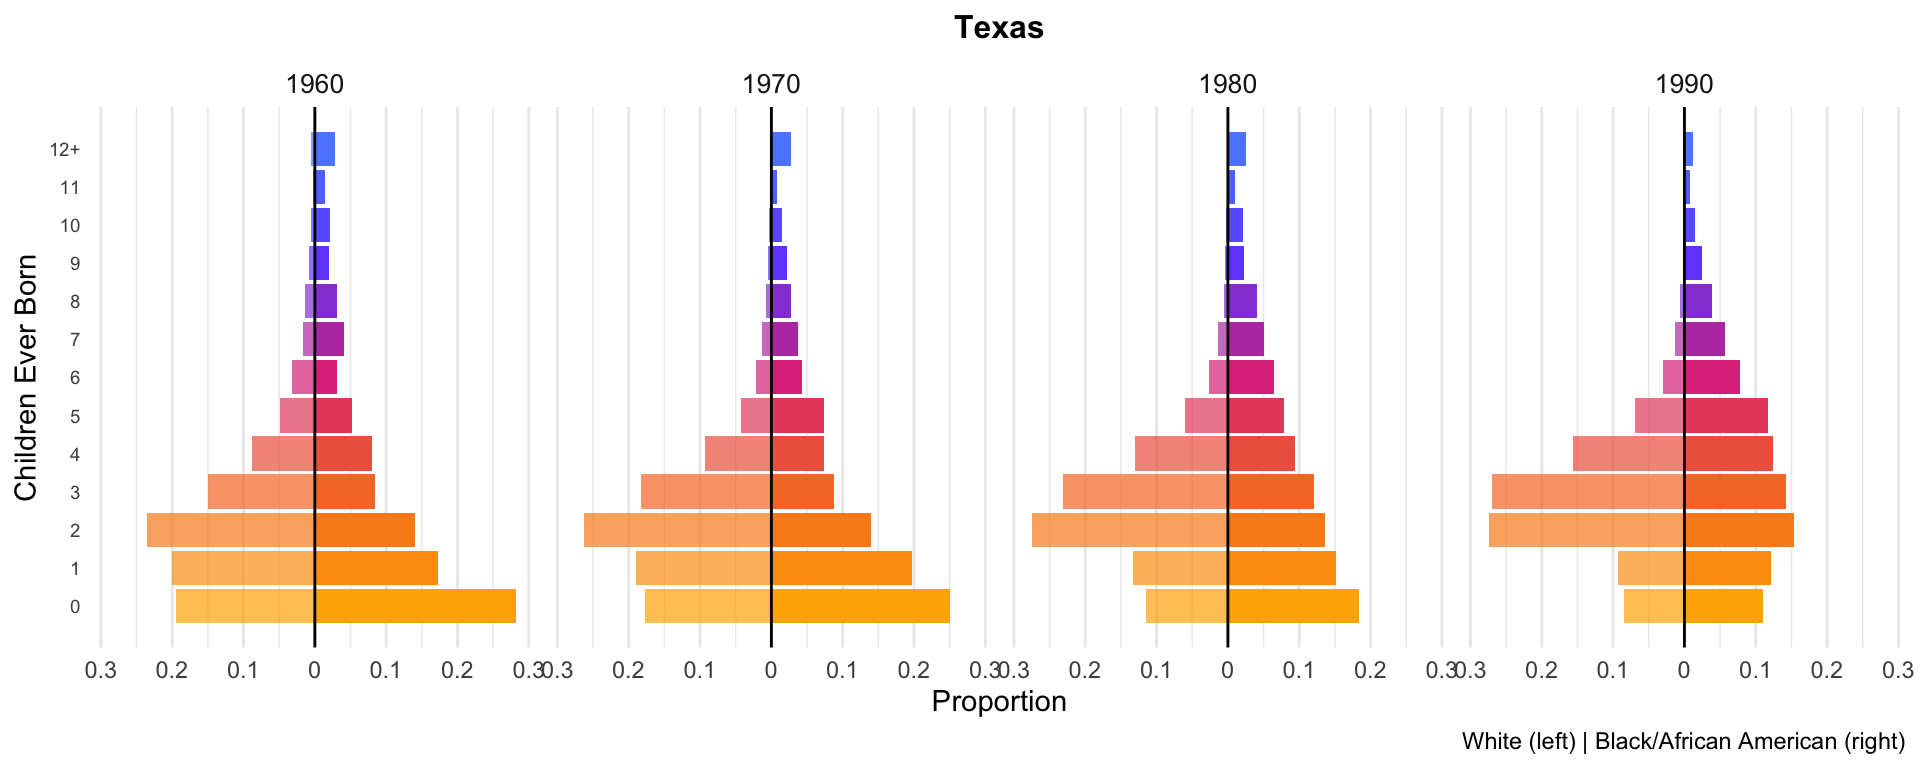
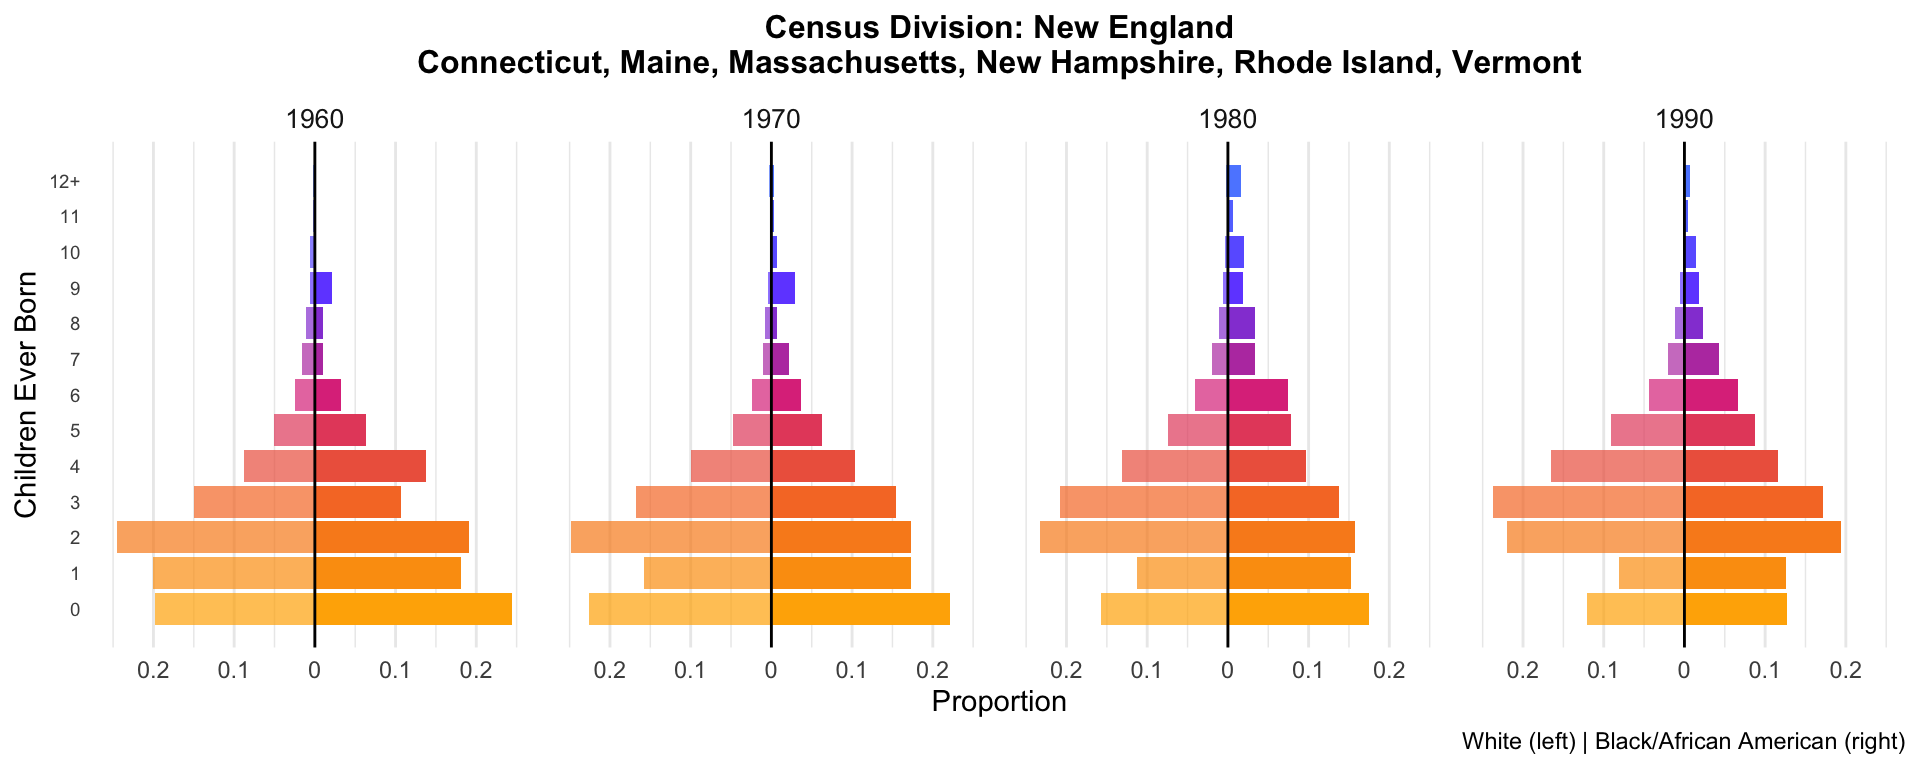
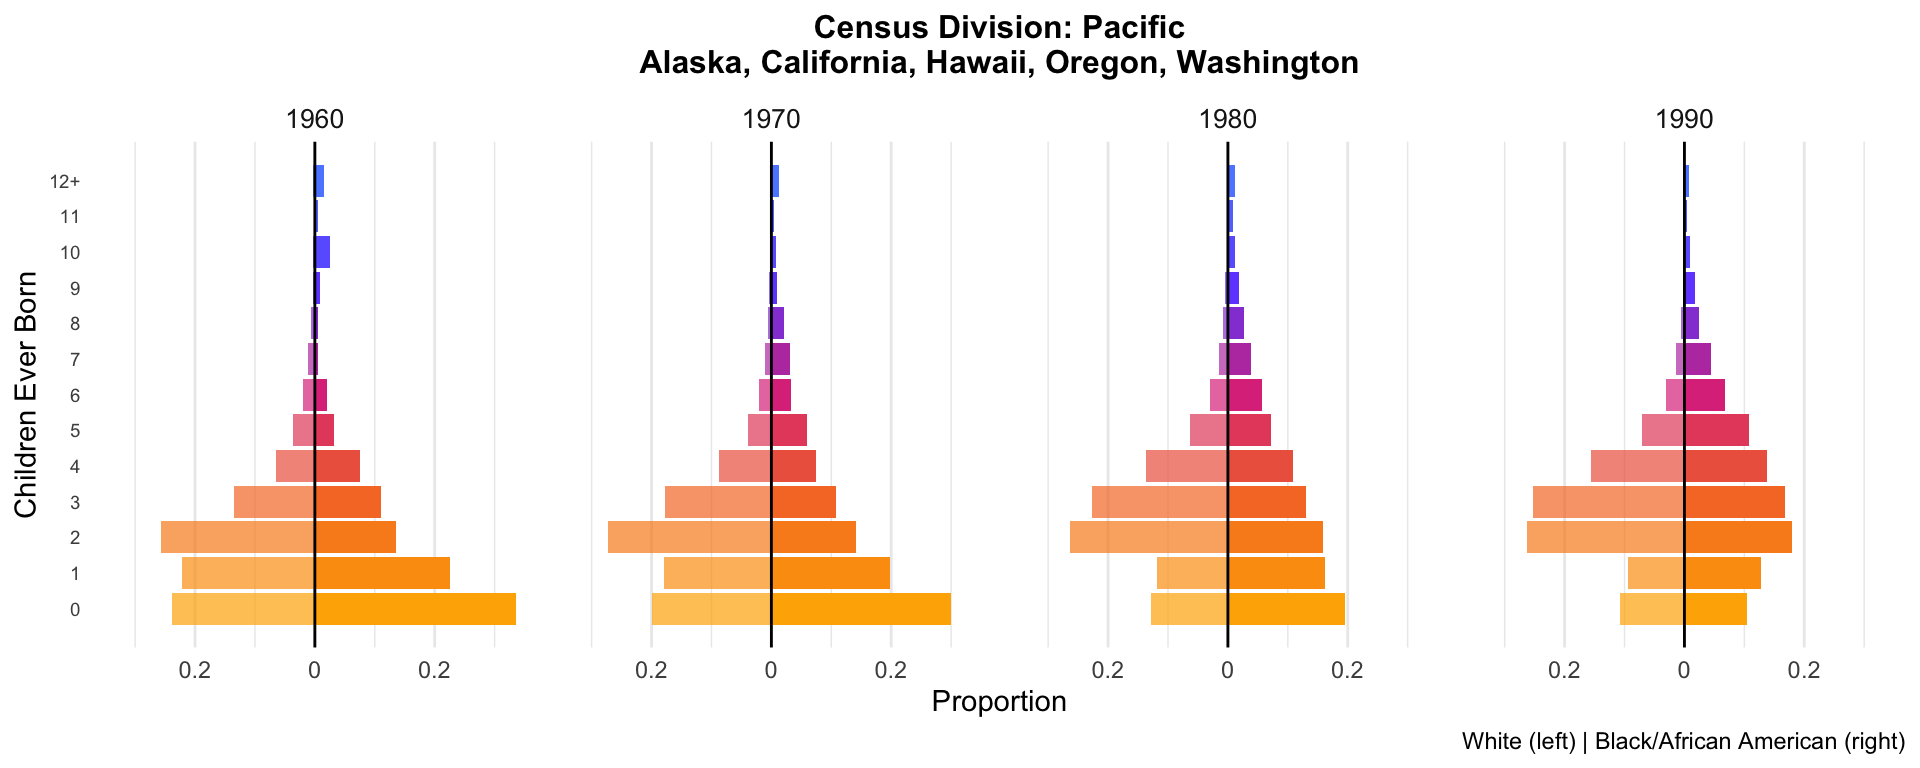
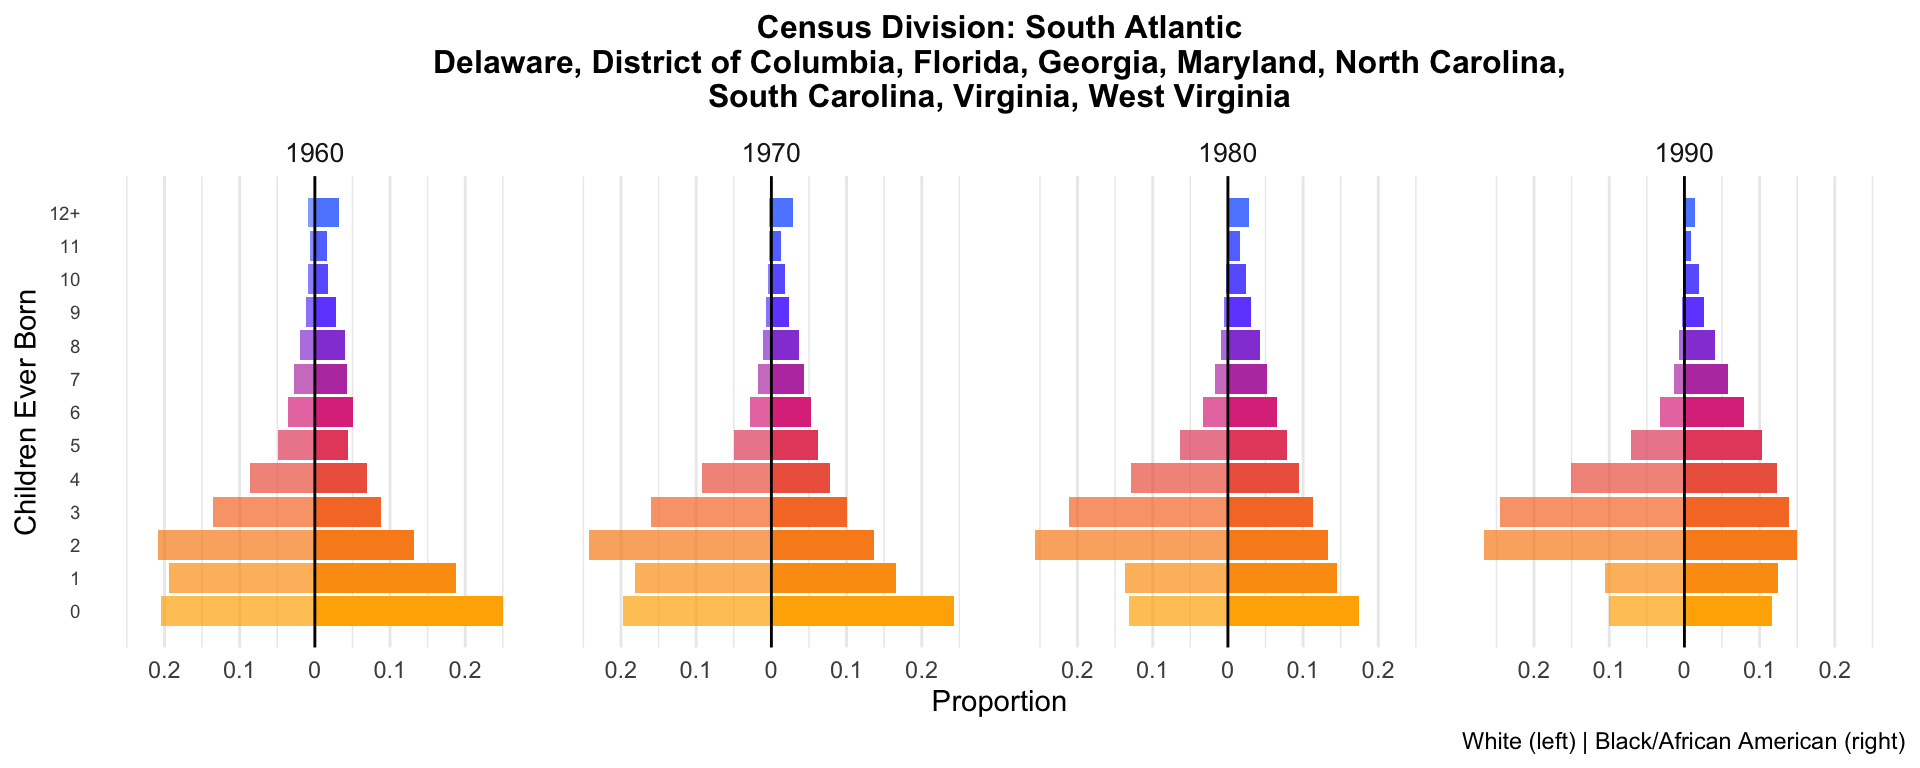
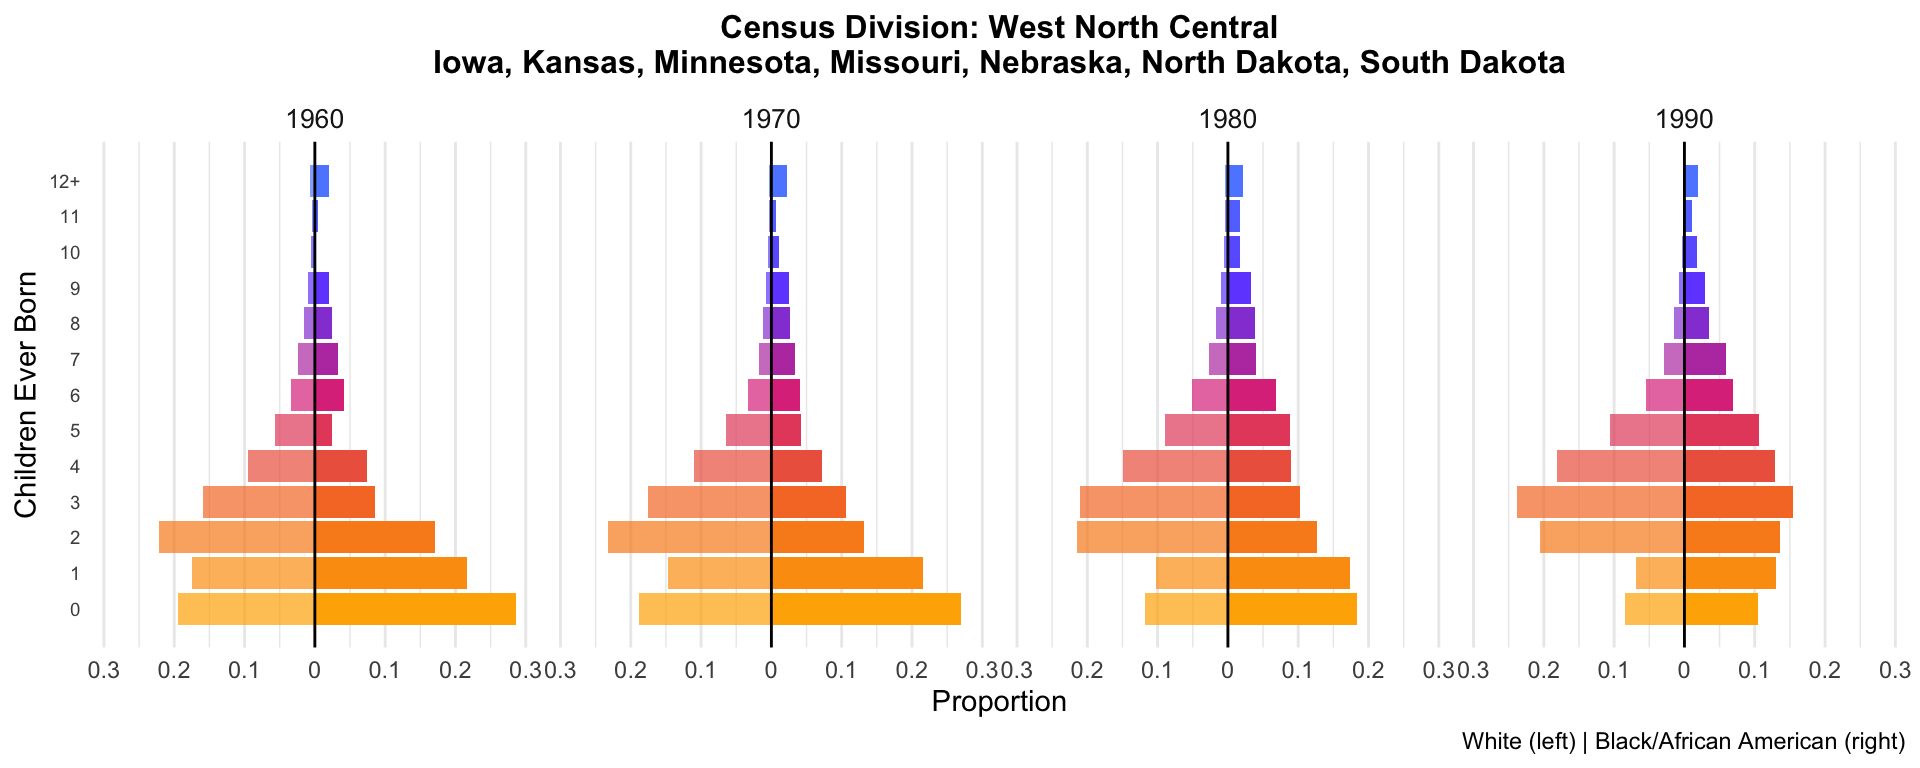
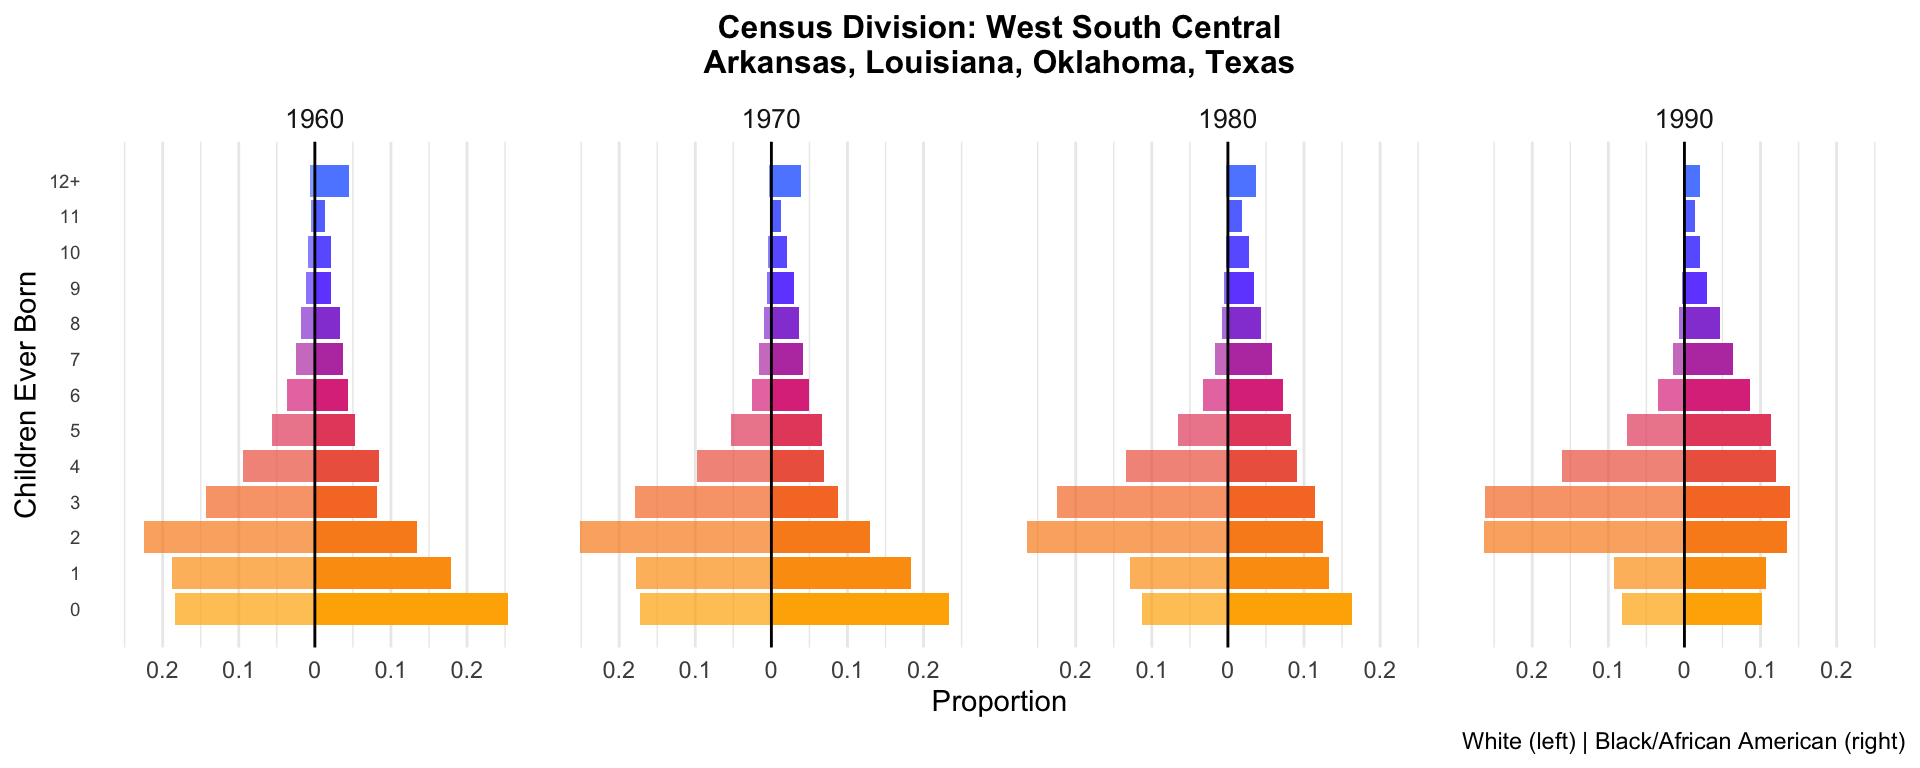
These detailed plots show the full distribution of children ever born for each state, using the same mirrored bar chart design as the national analysis: White proportions extend left, Black/African American proportions extend right.
Only states with at least 30 observations for both race groups across all included years are shown.
my_colors <- fertility_palette(13)

plot_state_fertility <- function(state_data, state_label) {
  # Compute proportions within each (YEAR, RACE) group
  df_props <- state_data %>%
    group_by(YEAR, RACE, chborn_capped) %>%
    summarise(count = n(), .groups = "drop") %>%
    group_by(YEAR, RACE) %>%
    mutate(proportion = count / sum(count)) %>%
    ungroup() %>%
    mutate(proportion = if_else(RACE == "White", -proportion, proportion))

  ggplot(df_props, aes(x = chborn_capped, y = proportion,
                       fill = as.factor(chborn_capped))) +
    geom_col(aes(alpha = RACE)) +
    geom_hline(yintercept = 0, color = "black", linewidth = 0.5) +
    facet_wrap(~ YEAR, nrow = 1) +
    coord_flip() +
    scale_y_continuous(
      labels = function(x) abs(x),
      limits = function(x) c(-max(abs(x)), max(abs(x)))
    ) +
    scale_x_continuous(breaks = 0:12, labels = c(0:11, "12+")) +
    scale_fill_manual(values = my_colors) +
    scale_alpha_manual(
      values = c("White" = 0.7, "Black/African American" = 1),
      guide = "none"
    ) +
    labs(
      title = state_label,
      x = "Children Ever Born",
      y = "Proportion",
      caption = "White (left) | Black/African American (right)"
    ) +
    theme_minimal() +
    theme(
      plot.title = element_text(size = 12, hjust = 0.5, face = "bold"),
      axis.text.y = element_text(size = 7),
      strip.text = element_text(size = 10),
      legend.position = "none",
      panel.grid.major.y = element_blank(),
      panel.grid.minor.y = element_blank()
    )
}
# States with >= 30 obs for both races in at least one year
eligible_states <- cell_sizes %>%
filter(flag == "ok") %>%
group_by(state_name) %>%
filter(all(c("White", "Black/African American") %in% RACE)) %>%
pull(state_name) %>%
unique() %>%
sort()
cat(length(eligible_states), "states with adequate data for both race groups:\n")40 states with adequate data for both race groups:cat(paste(eligible_states, collapse = ", "), "\n")Alabama, Arizona, Arkansas, California, Colorado, Connecticut, Delaware, District of Columbia, Florida, Georgia, Illinois, Indiana, Iowa, Kansas, Kentucky, Louisiana, Maryland, Massachusetts, Michigan, Minnesota, Mississippi, Missouri, Nebraska, Nevada, New Jersey, New Mexico, New York, North Carolina, Ohio, Oklahoma, Oregon, Pennsylvania, Rhode Island, South Carolina, Tennessee, Texas, Virginia, Washington, West Virginia, Wisconsin for (st in eligible_states) {
st_data <- data %>% filter(state_name == st)
# Check both races are present
if (n_distinct(st_data$RACE) < 2) next
p <- plot_state_fertility(st_data, st)
print(p)
cat("\n\n")
}
| Version | Author | Date |
|---|---|---|
| bede61f | Tina Lasisi | 2026-04-14 |
| Version | Author | Date |
|---|---|---|
| bede61f | Tina Lasisi | 2026-04-14 |
| Version | Author | Date |
|---|---|---|
| bede61f | Tina Lasisi | 2026-04-14 |
| Version | Author | Date |
|---|---|---|
| bede61f | Tina Lasisi | 2026-04-14 |
| Version | Author | Date |
|---|---|---|
| bede61f | Tina Lasisi | 2026-04-14 |
| Version | Author | Date |
|---|---|---|
| bede61f | Tina Lasisi | 2026-04-14 |
| Version | Author | Date |
|---|---|---|
| bede61f | Tina Lasisi | 2026-04-14 |
| Version | Author | Date |
|---|---|---|
| bede61f | Tina Lasisi | 2026-04-14 |
| Version | Author | Date |
|---|---|---|
| bede61f | Tina Lasisi | 2026-04-14 |
| Version | Author | Date |
|---|---|---|
| bede61f | Tina Lasisi | 2026-04-14 |
| Version | Author | Date |
|---|---|---|
| bede61f | Tina Lasisi | 2026-04-14 |
| Version | Author | Date |
|---|---|---|
| bede61f | Tina Lasisi | 2026-04-14 |
| Version | Author | Date |
|---|---|---|
| bede61f | Tina Lasisi | 2026-04-14 |
| Version | Author | Date |
|---|---|---|
| bede61f | Tina Lasisi | 2026-04-14 |
| Version | Author | Date |
|---|---|---|
| bede61f | Tina Lasisi | 2026-04-14 |
| Version | Author | Date |
|---|---|---|
| bede61f | Tina Lasisi | 2026-04-14 |
| Version | Author | Date |
|---|---|---|
| bede61f | Tina Lasisi | 2026-04-14 |
| Version | Author | Date |
|---|---|---|
| bede61f | Tina Lasisi | 2026-04-14 |
| Version | Author | Date |
|---|---|---|
| bede61f | Tina Lasisi | 2026-04-14 |
| Version | Author | Date |
|---|---|---|
| bede61f | Tina Lasisi | 2026-04-14 |
| Version | Author | Date |
|---|---|---|
| bede61f | Tina Lasisi | 2026-04-14 |
| Version | Author | Date |
|---|---|---|
| bede61f | Tina Lasisi | 2026-04-14 |
| Version | Author | Date |
|---|---|---|
| bede61f | Tina Lasisi | 2026-04-14 |
| Version | Author | Date |
|---|---|---|
| bede61f | Tina Lasisi | 2026-04-14 |
| Version | Author | Date |
|---|---|---|
| bede61f | Tina Lasisi | 2026-04-14 |
| Version | Author | Date |
|---|---|---|
| bede61f | Tina Lasisi | 2026-04-14 |
| Version | Author | Date |
|---|---|---|
| bede61f | Tina Lasisi | 2026-04-14 |
| Version | Author | Date |
|---|---|---|
| bede61f | Tina Lasisi | 2026-04-14 |
| Version | Author | Date |
|---|---|---|
| bede61f | Tina Lasisi | 2026-04-14 |
| Version | Author | Date |
|---|---|---|
| bede61f | Tina Lasisi | 2026-04-14 |
| Version | Author | Date |
|---|---|---|
| bede61f | Tina Lasisi | 2026-04-14 |
| Version | Author | Date |
|---|---|---|
| bede61f | Tina Lasisi | 2026-04-14 |
| Version | Author | Date |
|---|---|---|
| bede61f | Tina Lasisi | 2026-04-14 |
| Version | Author | Date |
|---|---|---|
| bede61f | Tina Lasisi | 2026-04-14 |
| Version | Author | Date |
|---|---|---|
| bede61f | Tina Lasisi | 2026-04-14 |
| Version | Author | Date |
|---|---|---|
| bede61f | Tina Lasisi | 2026-04-14 |
| Version | Author | Date |
|---|---|---|
| bede61f | Tina Lasisi | 2026-04-14 |
| Version | Author | Date |
|---|---|---|
| bede61f | Tina Lasisi | 2026-04-14 |
| Version | Author | Date |
|---|---|---|
| bede61f | Tina Lasisi | 2026-04-14 |
| Version | Author | Date |
|---|---|---|
| bede61f | Tina Lasisi | 2026-04-14 |
8. Regional aggregation: Census divisions
For states where the Black/African American sample is too small, we aggregate to Census divisions and produce division-level plots.
Census divisions and their member states:
- New England: Connecticut, Maine, Massachusetts, New Hampshire, Rhode Island, Vermont
- Middle Atlantic: New Jersey, New York, Pennsylvania
- East North Central: Illinois, Indiana, Michigan, Ohio, Wisconsin
- West North Central: Iowa, Kansas, Minnesota, Missouri, Nebraska, North Dakota, South Dakota
- South Atlantic: Delaware, District of Columbia, Florida, Georgia, Maryland, North Carolina, South Carolina, Virginia, West Virginia
- East South Central: Alabama, Kentucky, Mississippi, Tennessee
- West South Central: Arkansas, Louisiana, Oklahoma, Texas
- Mountain: Arizona, Colorado, Idaho, Montana, Nevada, New Mexico, Utah, Wyoming
- Pacific: Alaska, California, Hawaii, Oregon, Washington
data_with_division <- data %>%
  mutate(division = state_to_division(state_name))

# Division-level cell sizes
div_cells <- data_with_division %>%
  count(division, RACE, YEAR, name = "n_obs") %>%
  filter(!is.na(division))

# All divisions should have adequate sample sizes
div_eligible <- div_cells %>%
  filter(n_obs >= 30) %>%
  group_by(division) %>%
  filter(all(c("White", "Black/African American") %in% RACE)) %>%
  pull(division) %>%
  unique() %>%
  sort()

cat(length(div_eligible), "Census divisions with adequate data:\n")
9 Census divisions with adequate data:cat(paste(div_eligible, collapse = ", "), "\n")East North Central, East South Central, Middle Atlantic, Mountain, New England, Pacific, South Atlantic, West North Central, West South Central for (div in div_eligible) {
div_data <- data_with_division %>%
filter(division == div) %>%
mutate(chborn_capped = pmin(chborn_num, 12))
if (n_distinct(div_data$RACE) < 2) next
states_in_div <- sort(unique(div_data$state_name))
plot_title <- paste0("Census Division: ", div, "\n",
str_wrap(paste(states_in_div, collapse = ", "), width = 80))
p <- plot_state_fertility(div_data, plot_title)
print(p)
cat("\n\n")
}
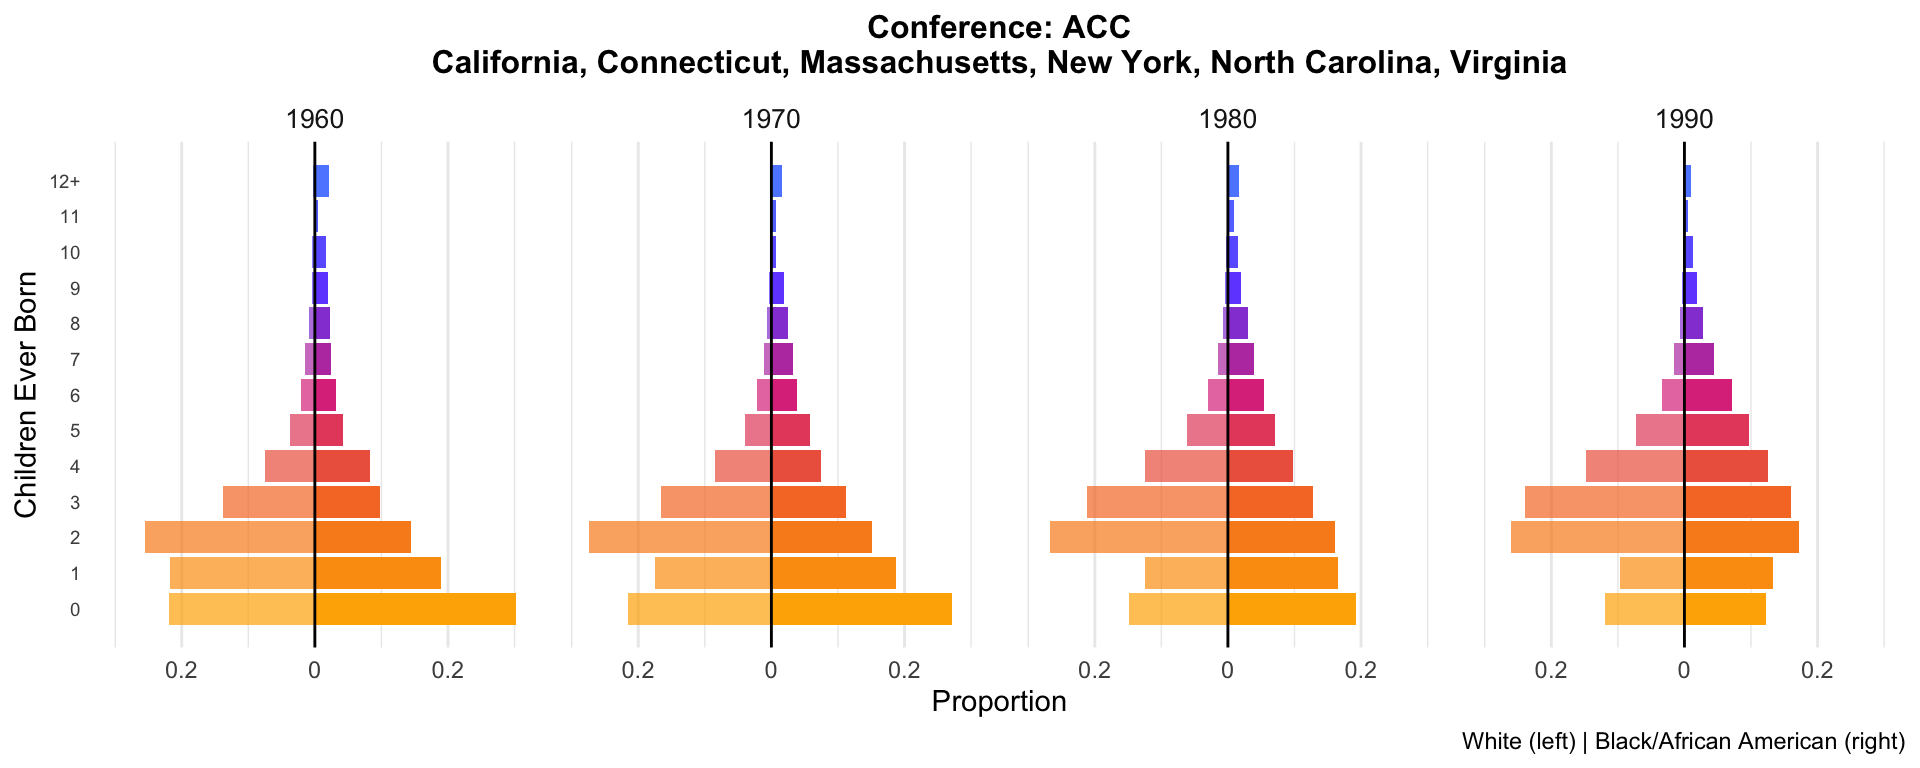
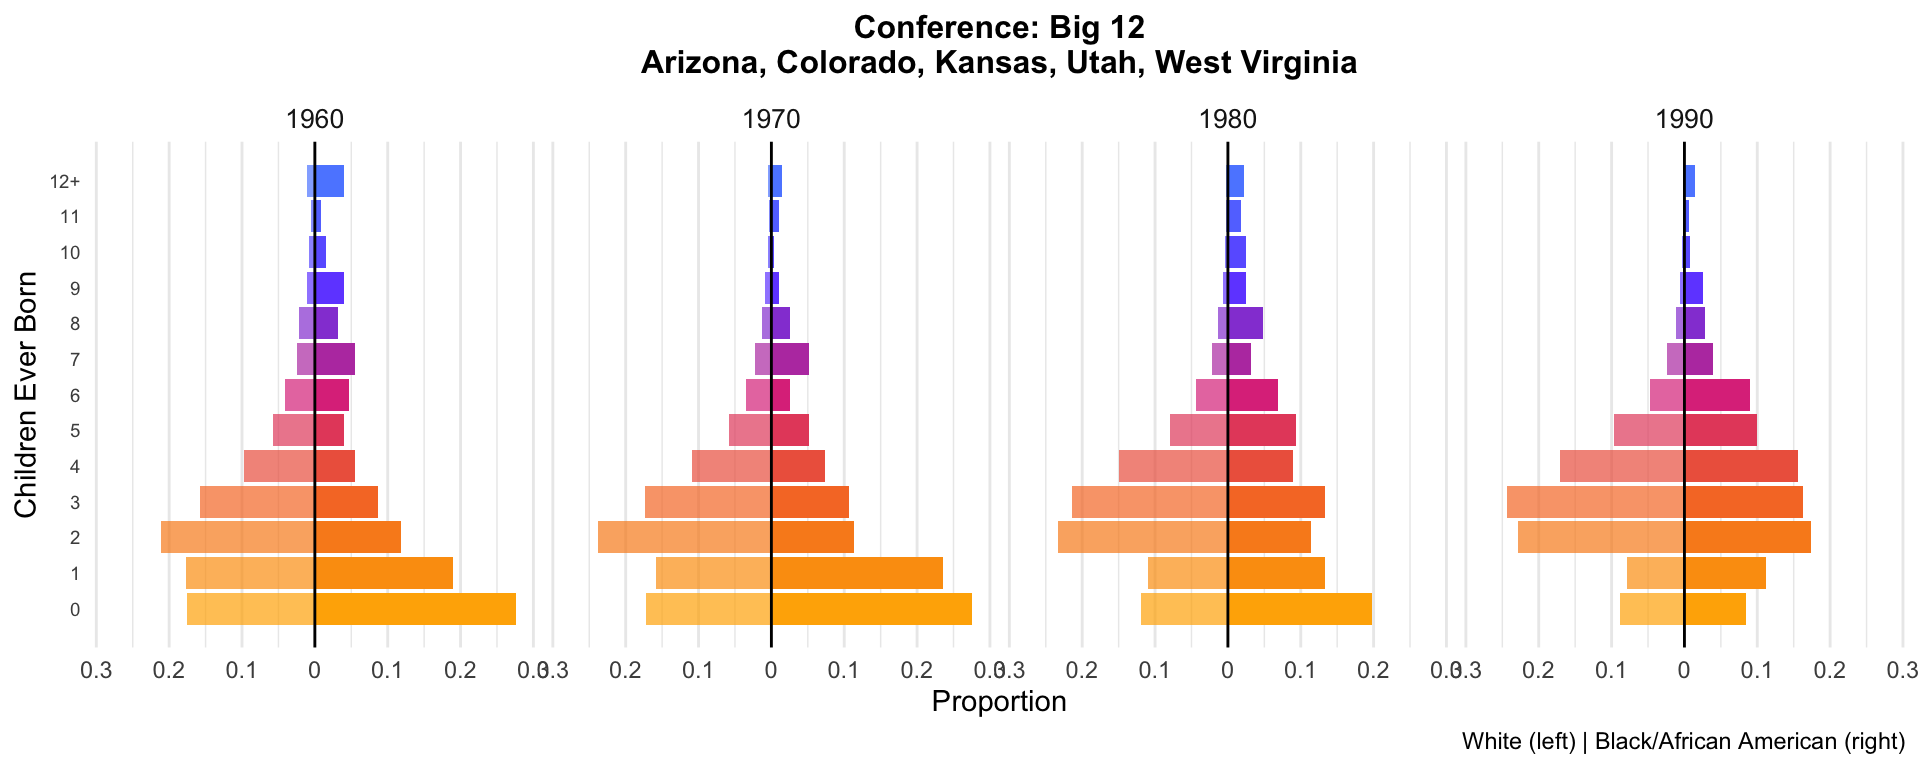
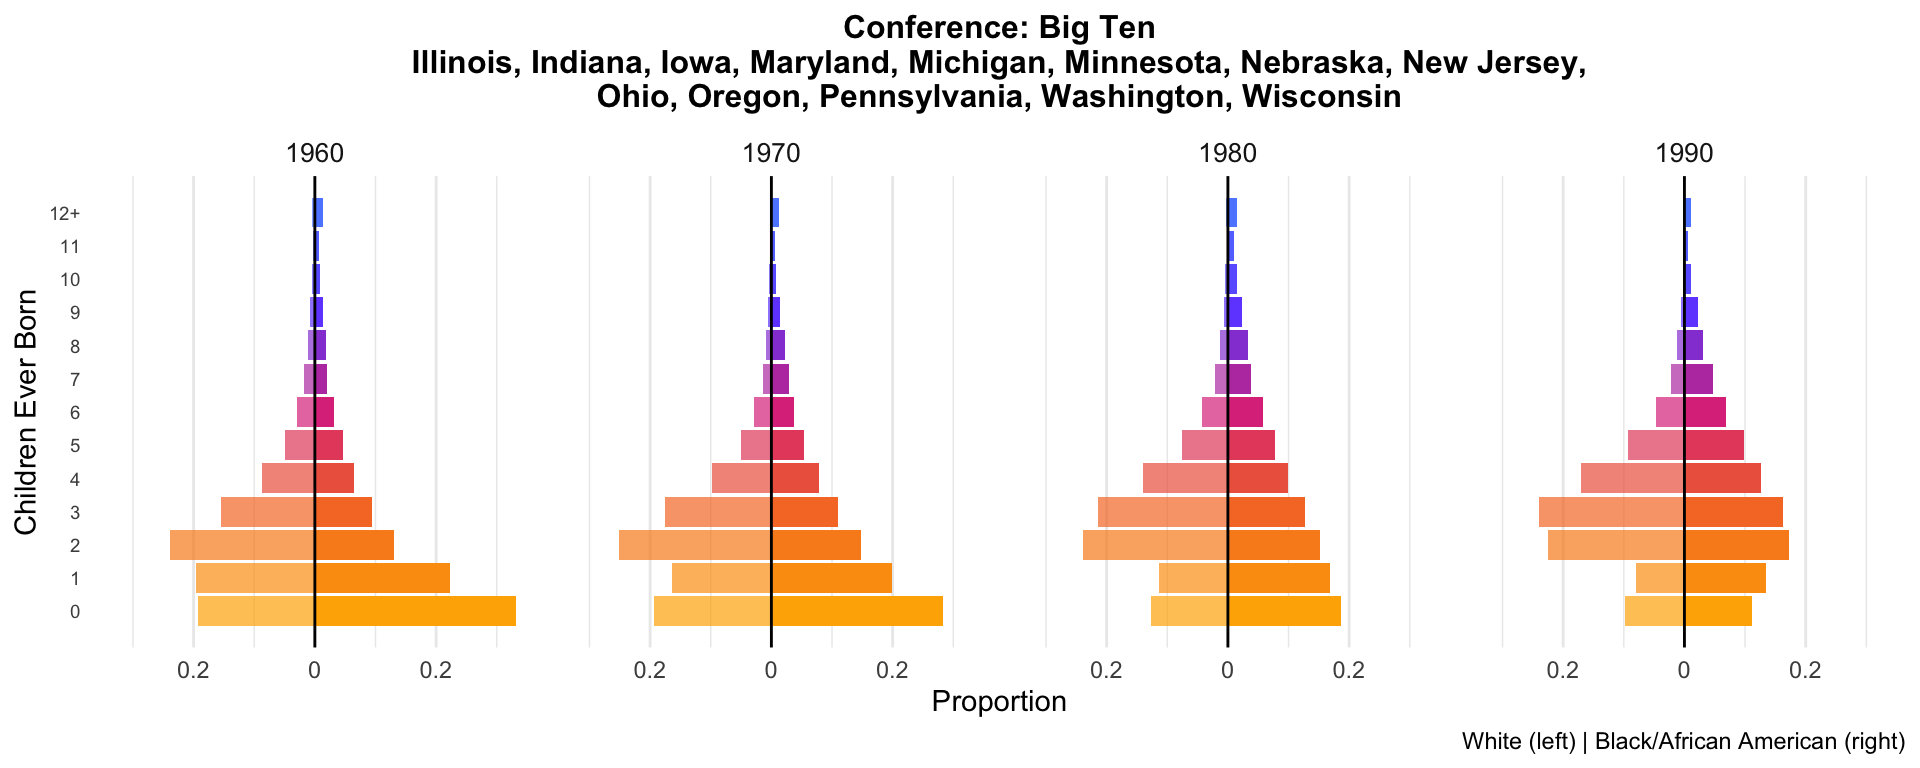
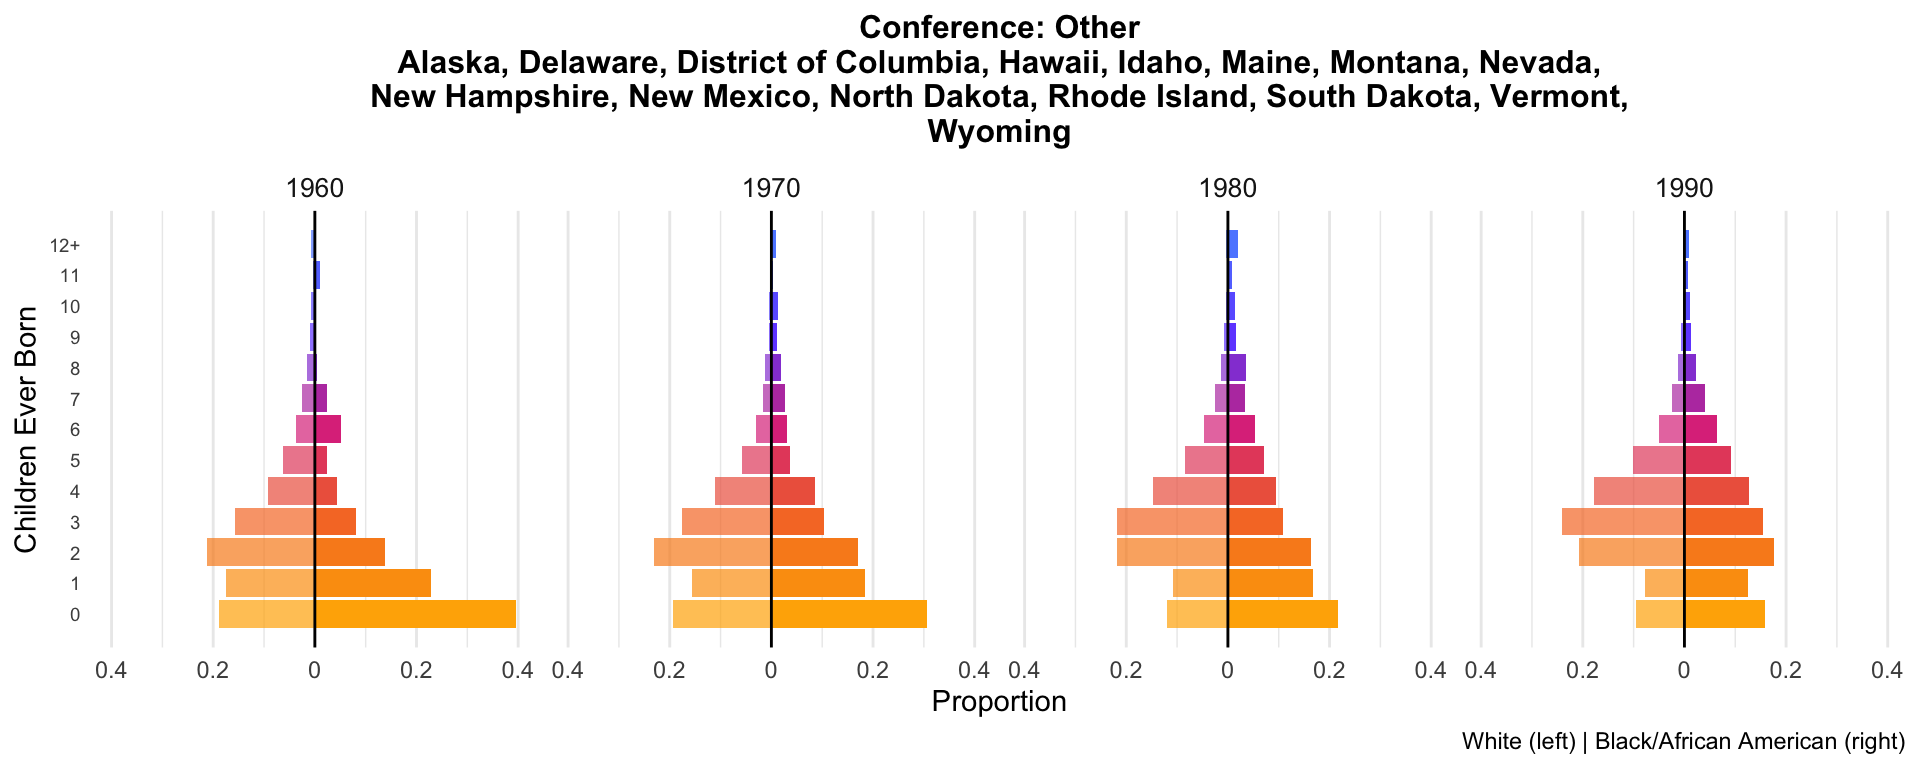
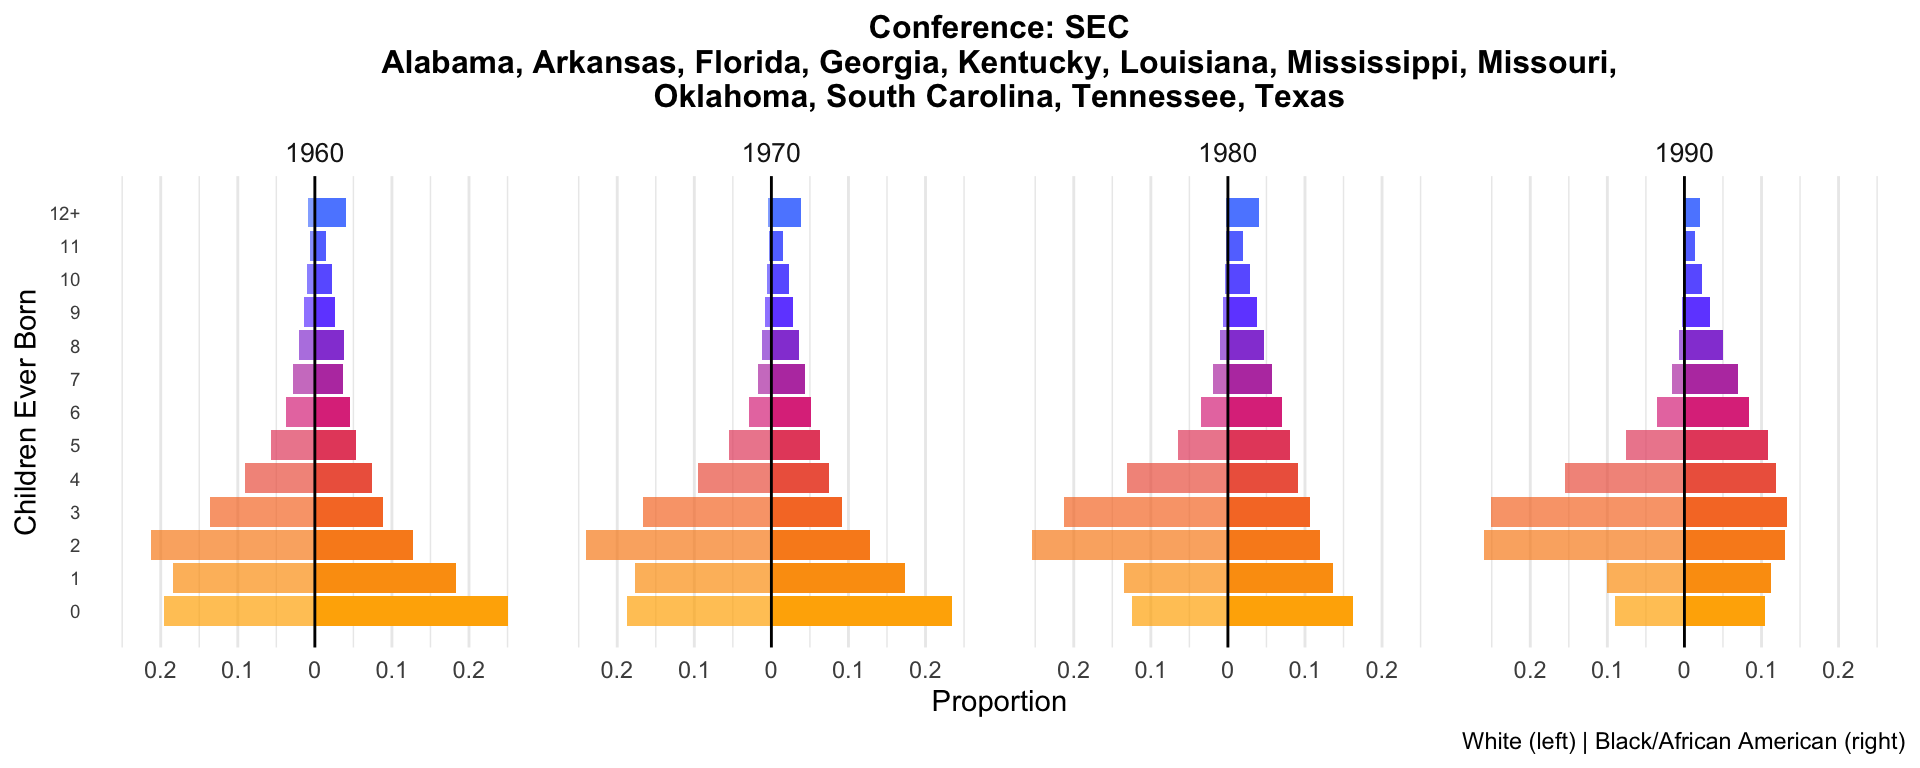
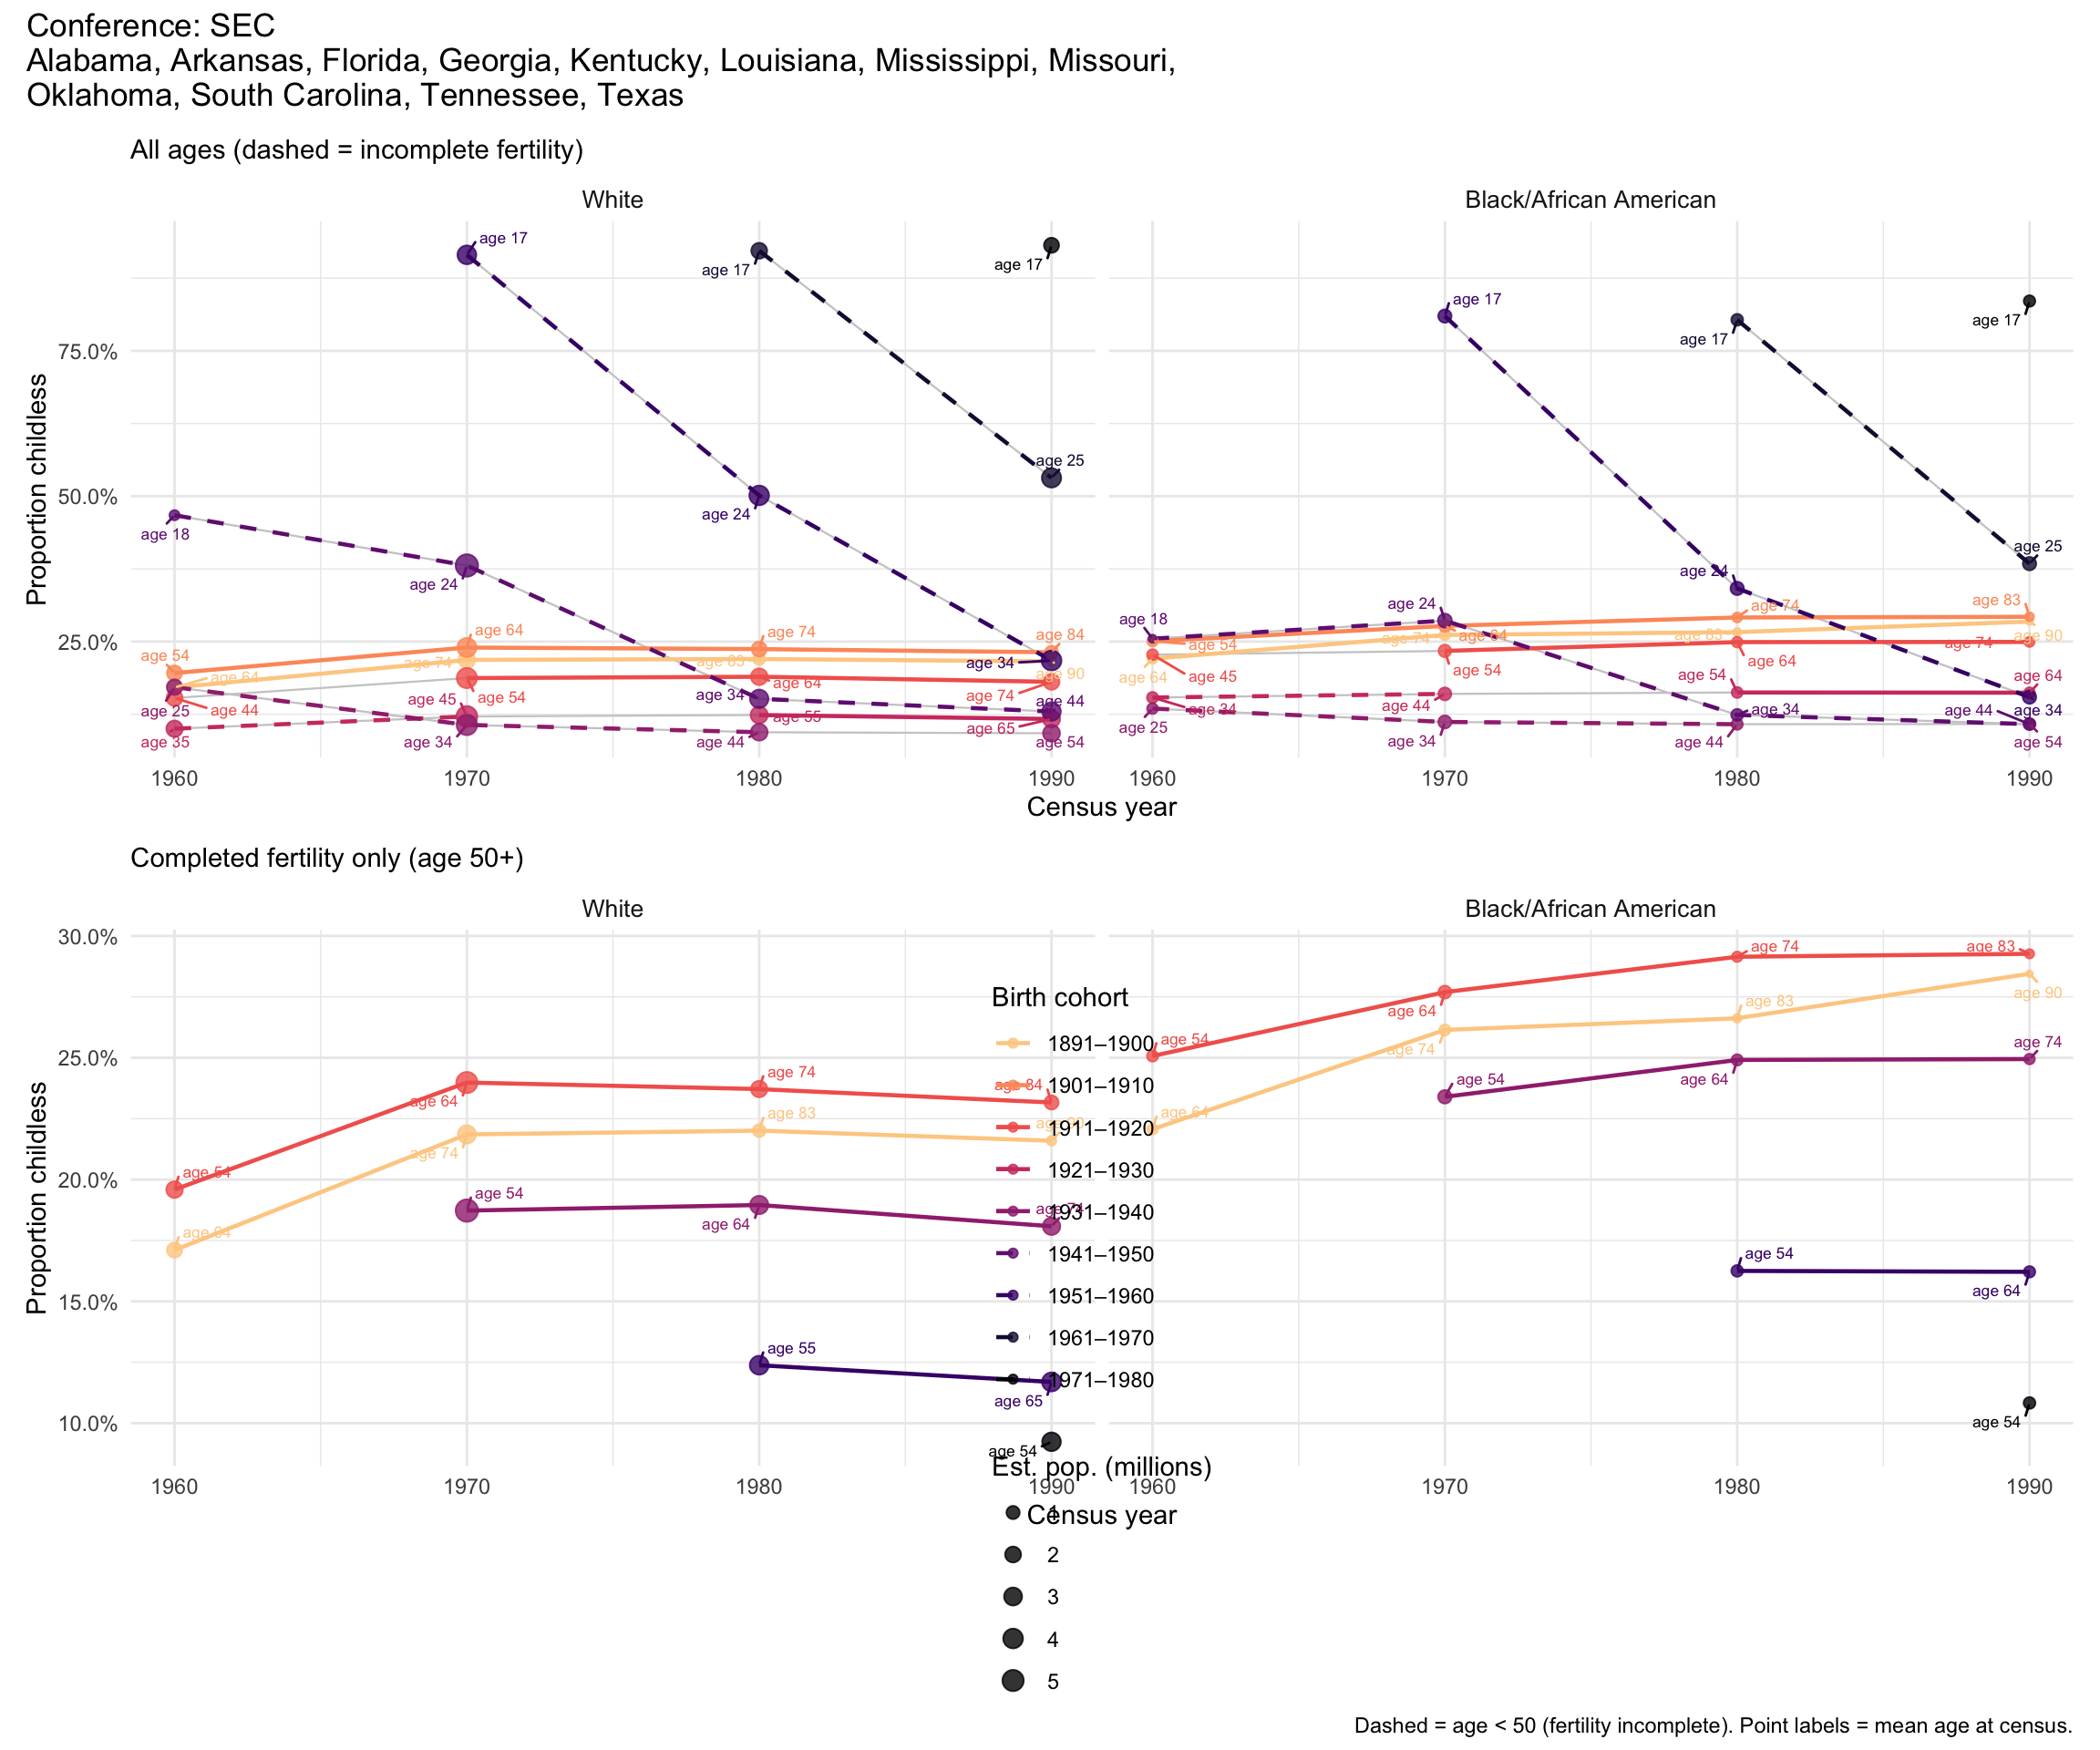
8b. Regional aggregation: College sports conferences
An alternative regional grouping based on major college athletic conferences, which reflect distinct cultural and geographic regions.
Conference membership (flagship/dominant program per state, post-2024 realignment):
- SEC: Alabama, Arkansas, Florida, Georgia, Kentucky, Louisiana, Mississippi, Missouri, Oklahoma, South Carolina, Tennessee, Texas
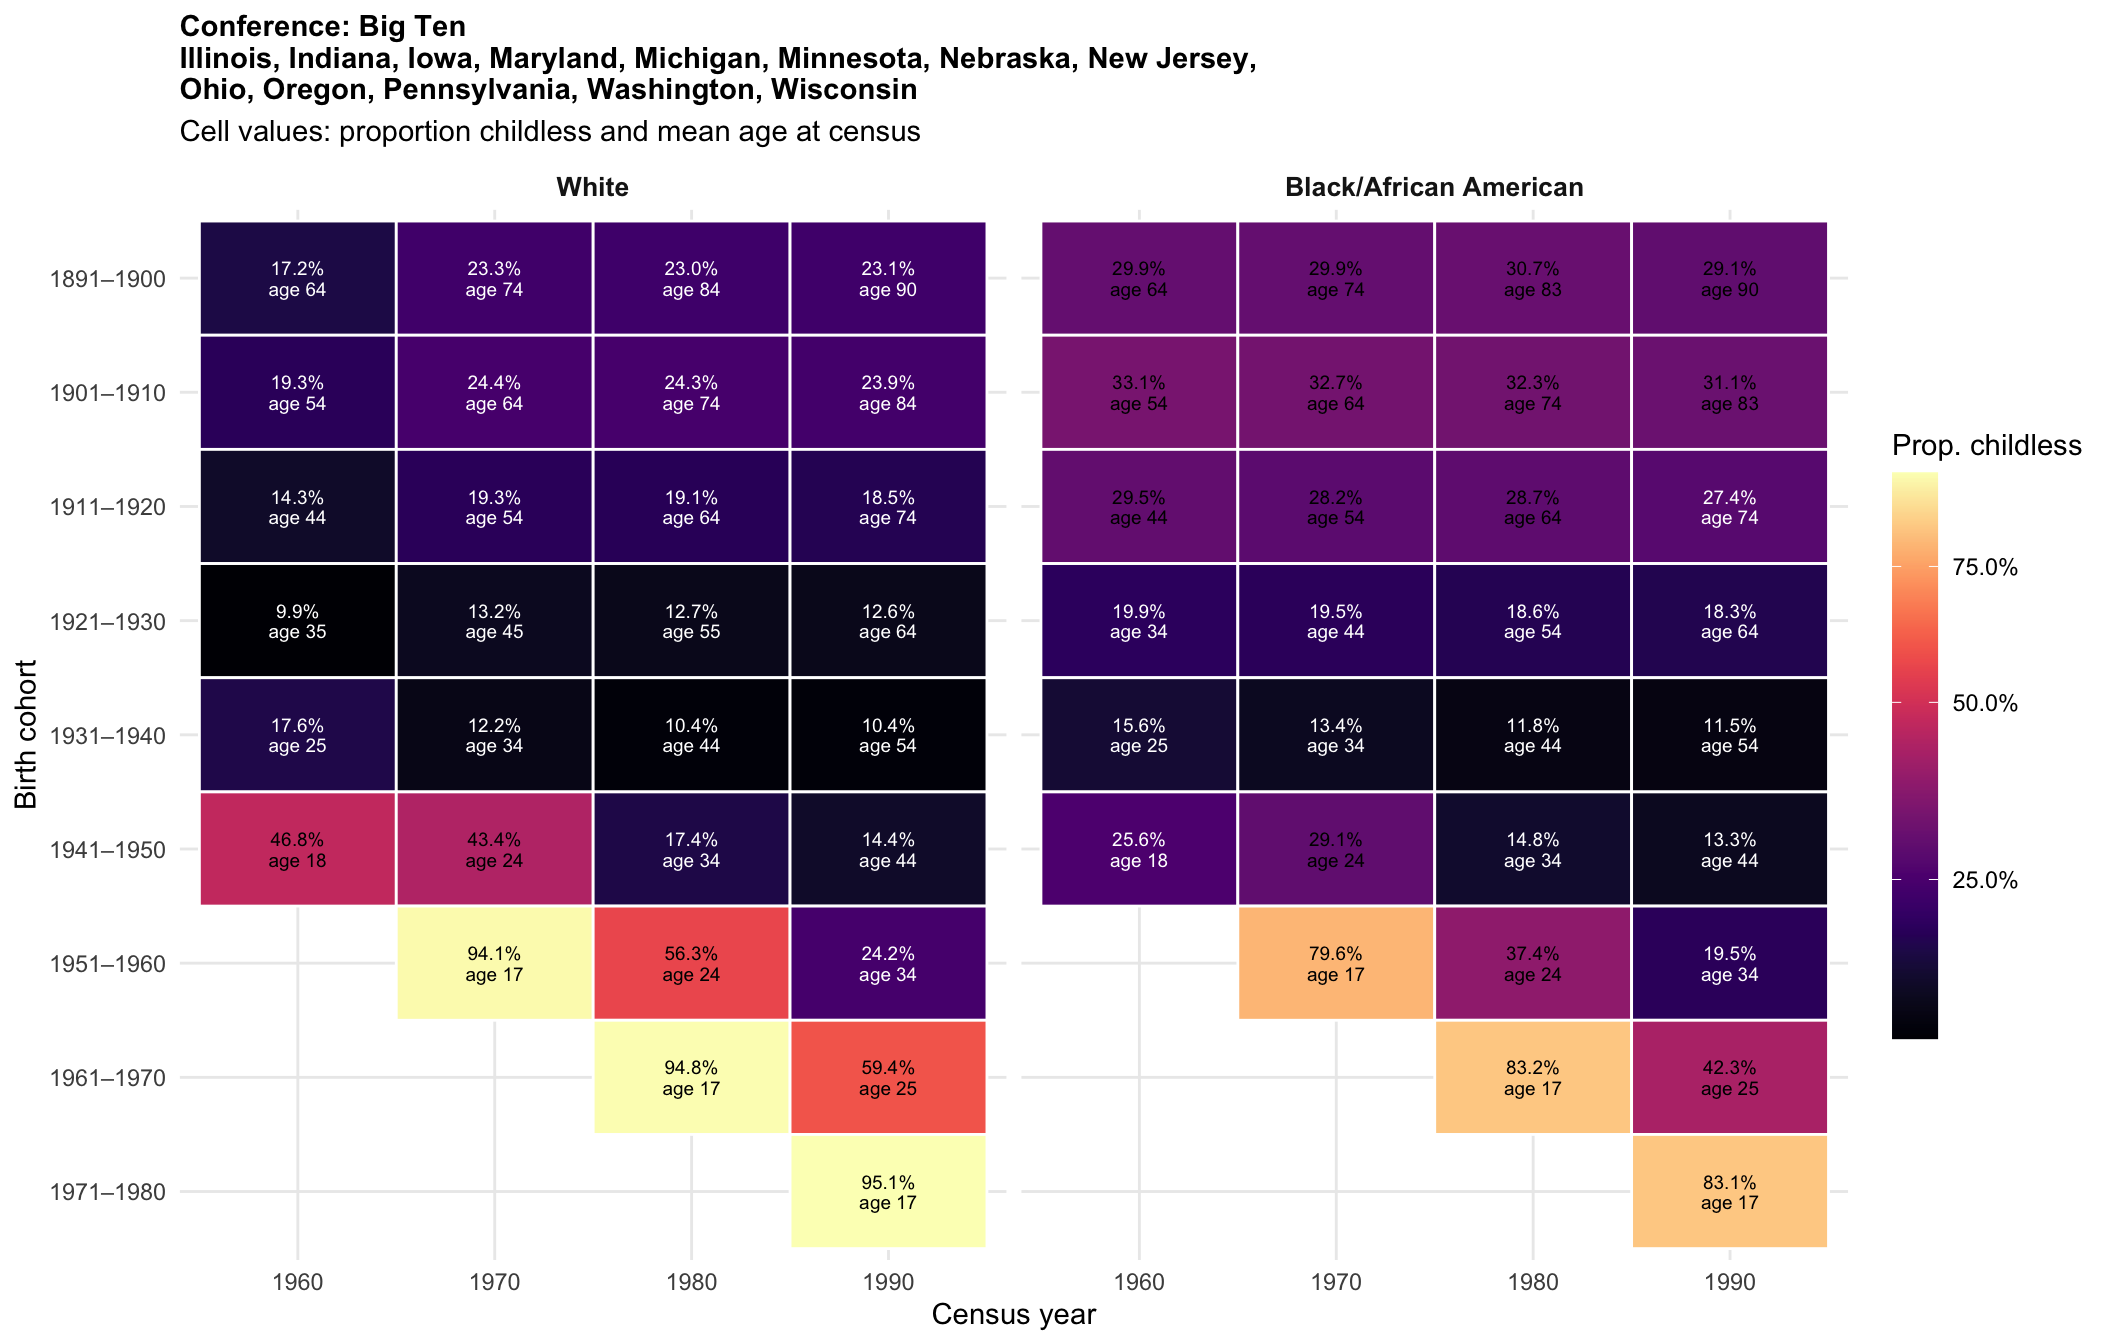
- Big Ten: Illinois, Indiana, Iowa, Maryland, Michigan, Minnesota, Nebraska, New Jersey, Ohio, Oregon, Pennsylvania, Washington, Wisconsin
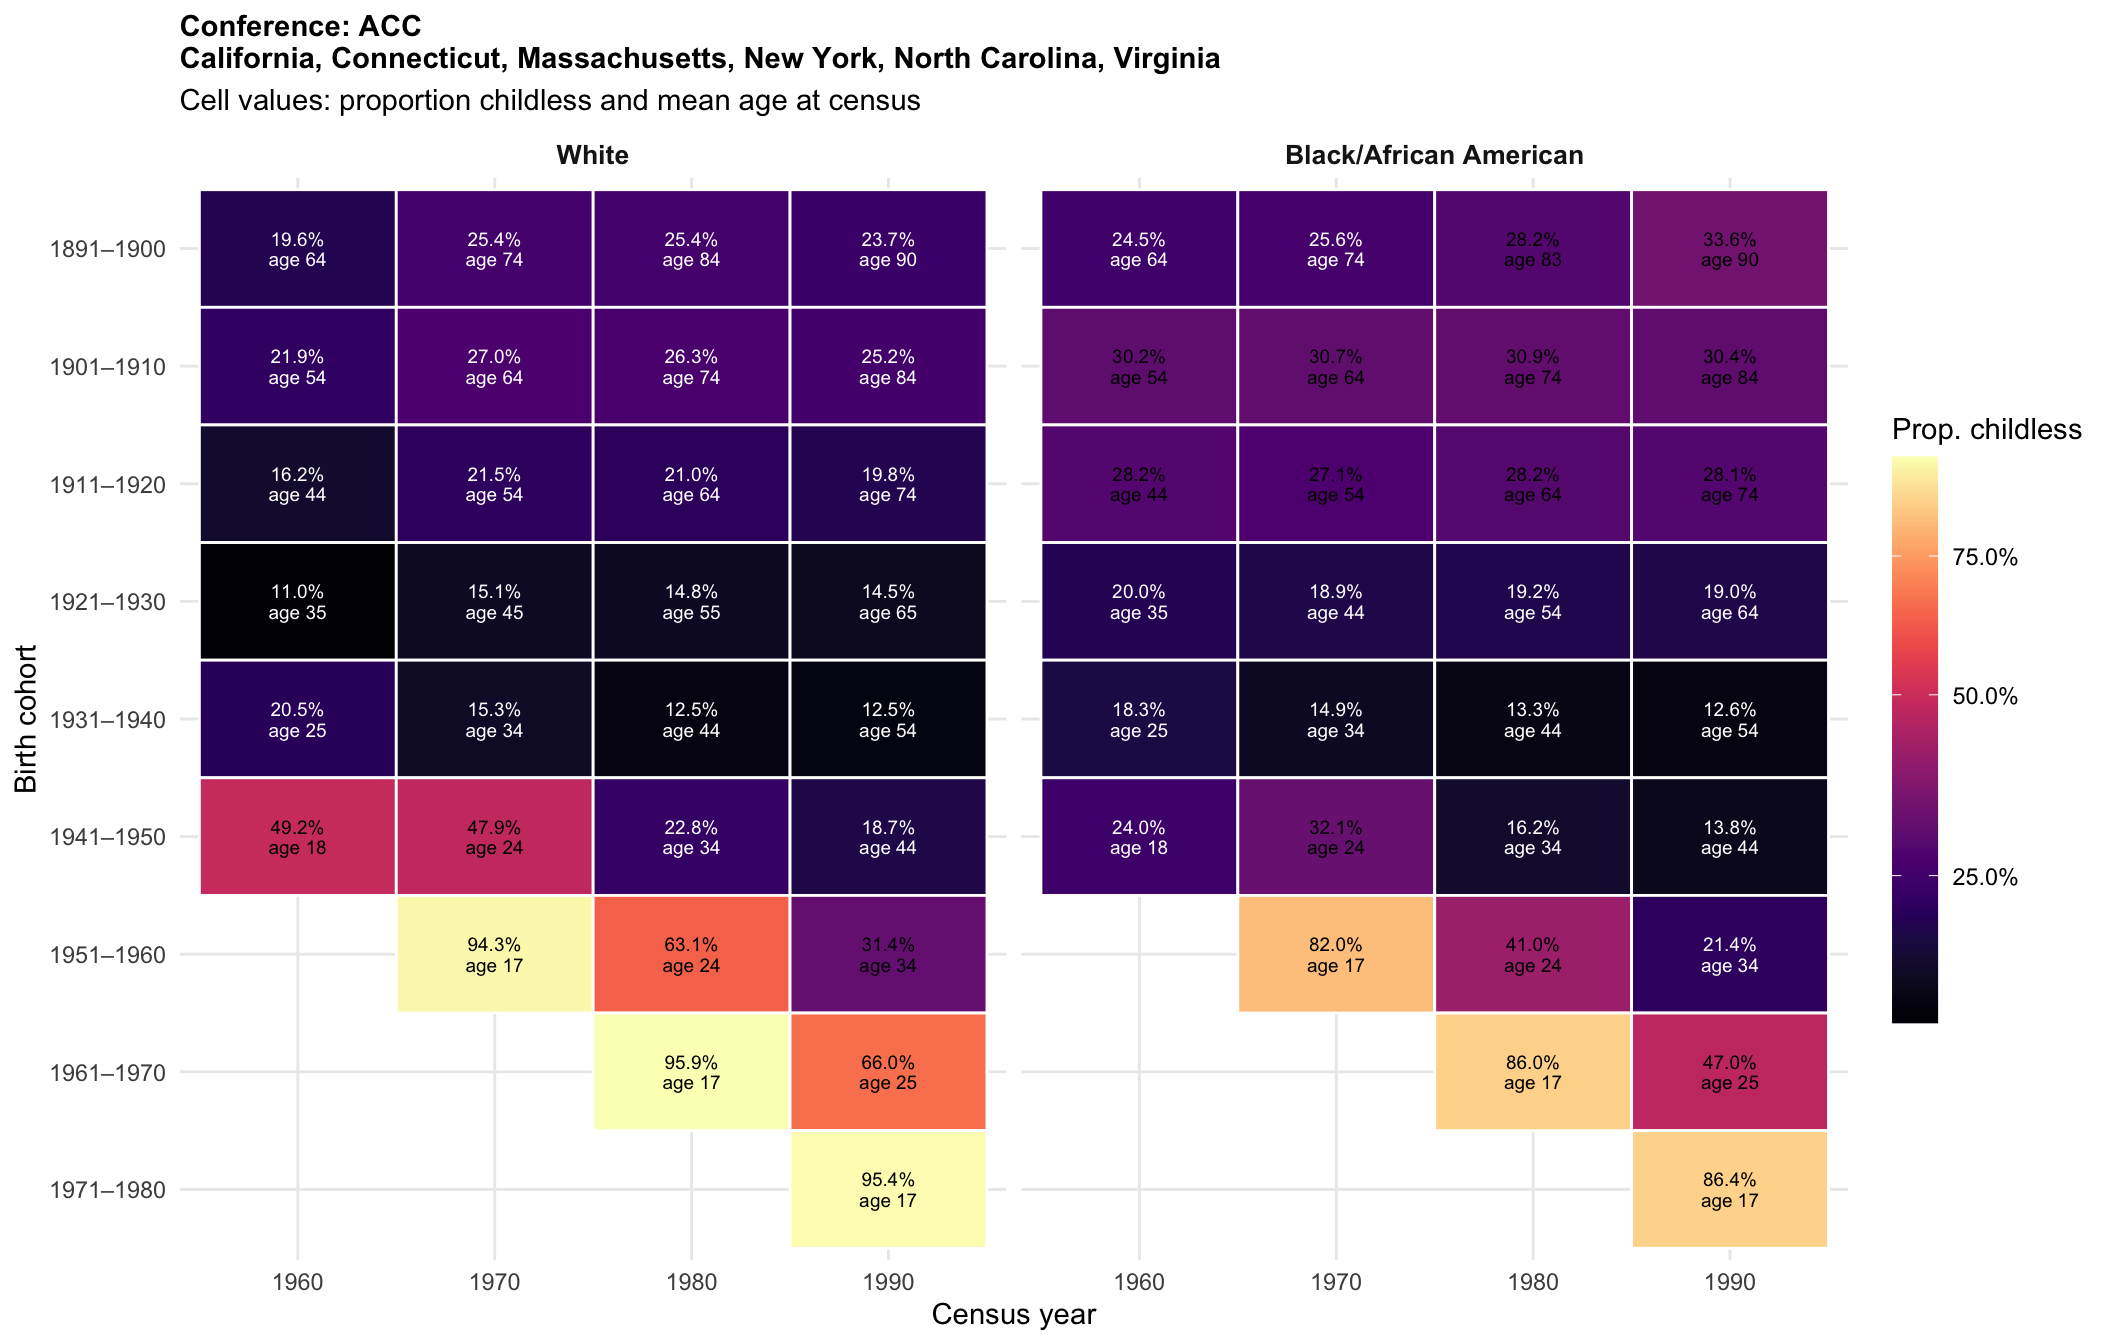
- ACC: California, Connecticut, Massachusetts, New York, North Carolina, Virginia
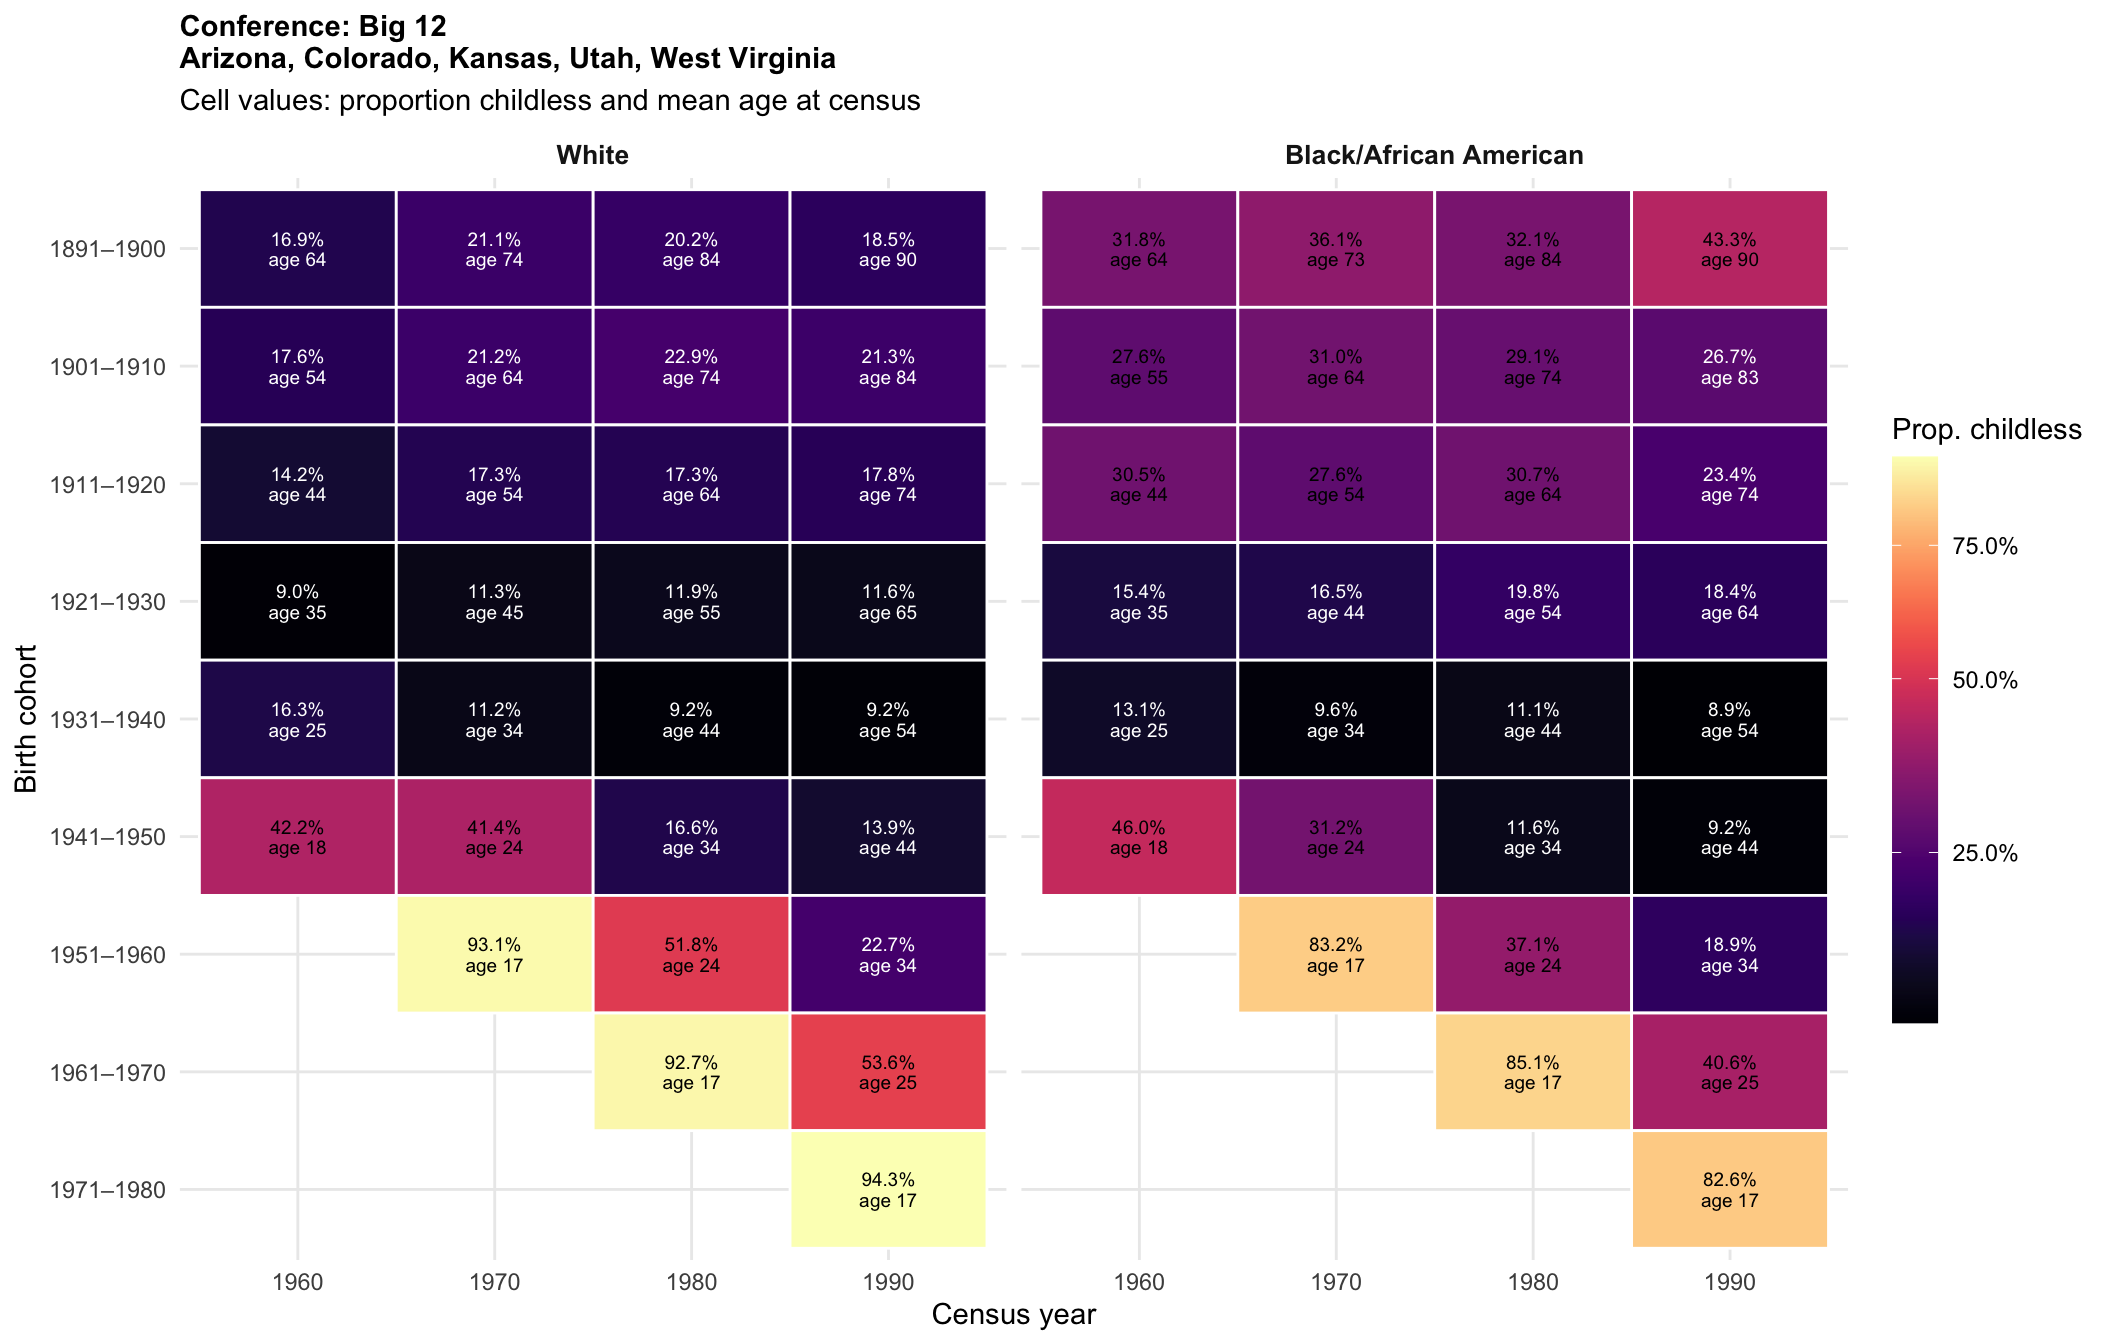
- Big 12: Arizona, Colorado, Kansas, Utah, West Virginia
- Other: Alaska, Delaware, Hawaii, Idaho, Maine, Montana, Nevada, New Hampshire, New Mexico, North Dakota, Rhode Island, South Dakota, Vermont, Wyoming, District of Columbia
data_with_conf <- data %>%
  mutate(conference = state_to_conference(state_name))

conf_cells <- data_with_conf %>%
  count(conference, RACE, YEAR, name = "n_obs") %>%
  filter(!is.na(conference))

conf_eligible <- conf_cells %>%
  filter(n_obs >= 30) %>%
  group_by(conference) %>%
  filter(all(c("White", "Black/African American") %in% RACE)) %>%
  pull(conference) %>%
  unique() %>%
  sort()

cat(length(conf_eligible), "conferences with adequate data:\n")
5 conferences with adequate data:cat(paste(conf_eligible, collapse = ", "), "\n")ACC, Big 12, Big Ten, Other, SEC for (conf in conf_eligible) {
conf_data <- data_with_conf %>%
filter(conference == conf) %>%
mutate(chborn_capped = pmin(chborn_num, 12))
if (n_distinct(conf_data$RACE) < 2) next
states_in_conf <- sort(unique(conf_data$state_name))
plot_title <- paste0("Conference: ", conf, "\n",
str_wrap(paste(states_in_conf, collapse = ", "), width = 80))
p <- plot_state_fertility(conf_data, plot_title)
print(p)
cat("\n\n")
}
| Version | Author | Date |
|---|---|---|
| 9d44b29 | Tina Lasisi | 2026-04-14 |
| Version | Author | Date |
|---|---|---|
| 9d44b29 | Tina Lasisi | 2026-04-14 |
| Version | Author | Date |
|---|---|---|
| 9d44b29 | Tina Lasisi | 2026-04-14 |
| Version | Author | Date |
|---|---|---|
| 9d44b29 | Tina Lasisi | 2026-04-14 |
| Version | Author | Date |
|---|---|---|
| 9d44b29 | Tina Lasisi | 2026-04-14 |
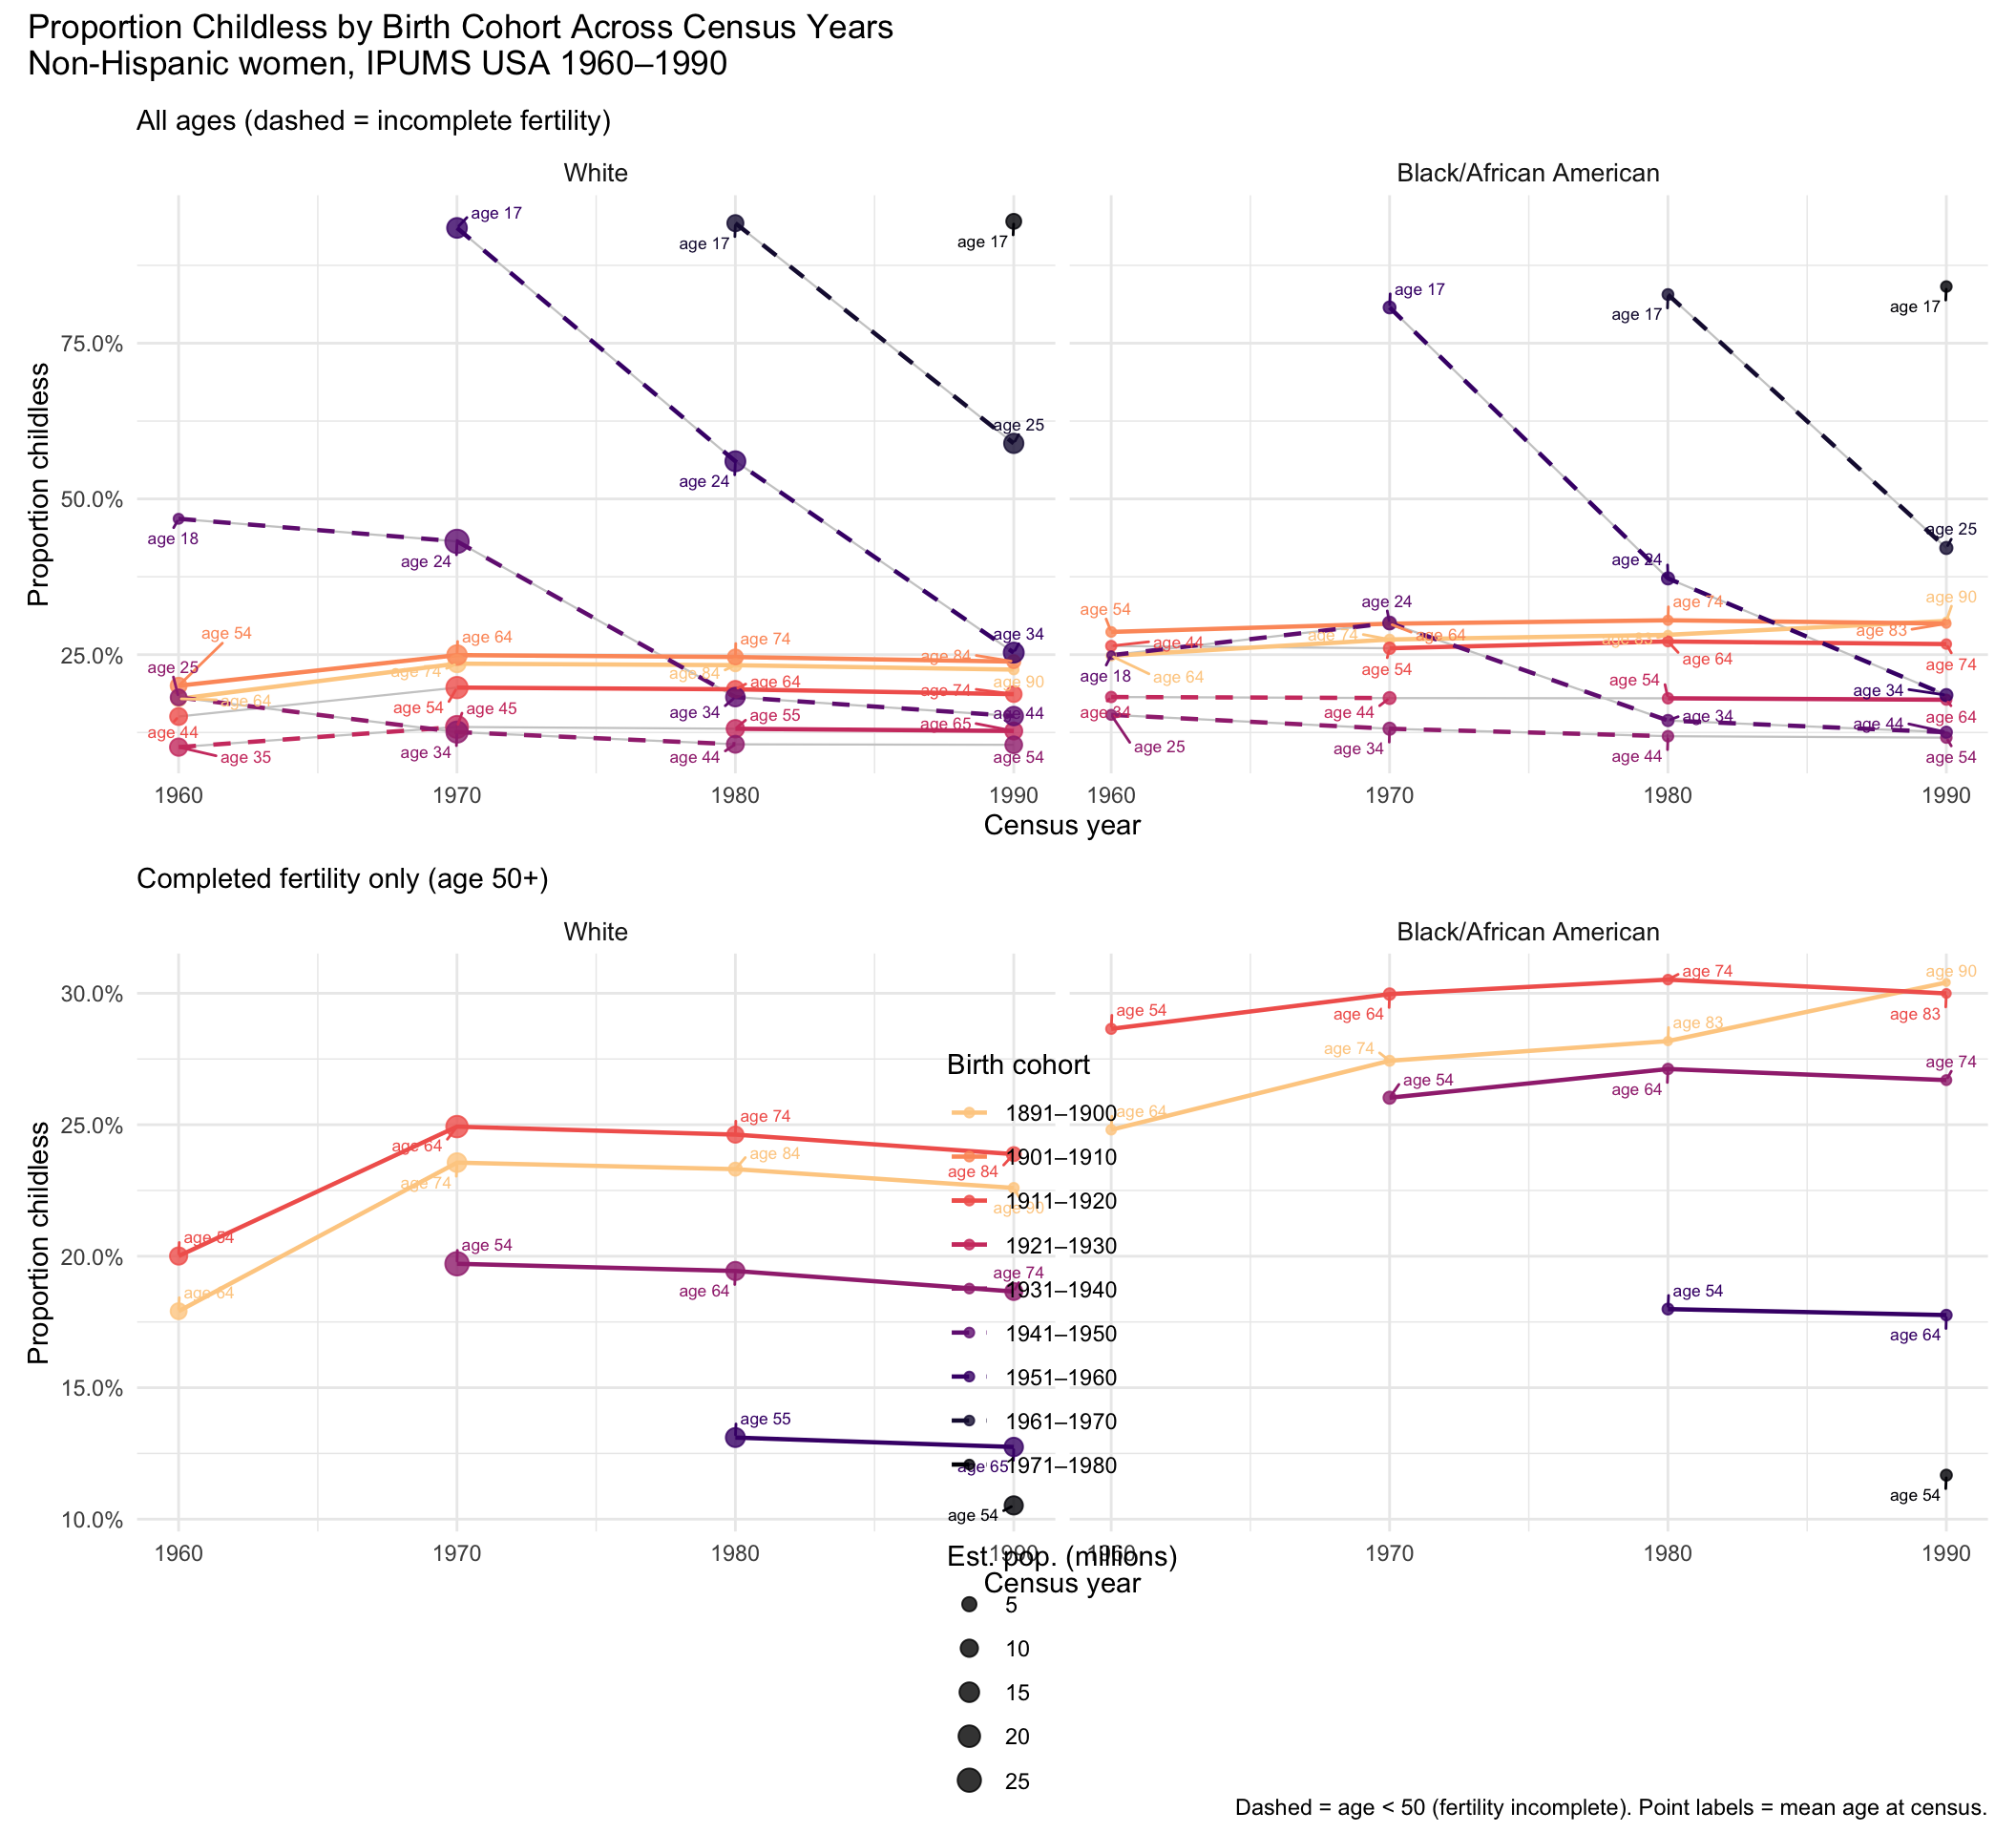
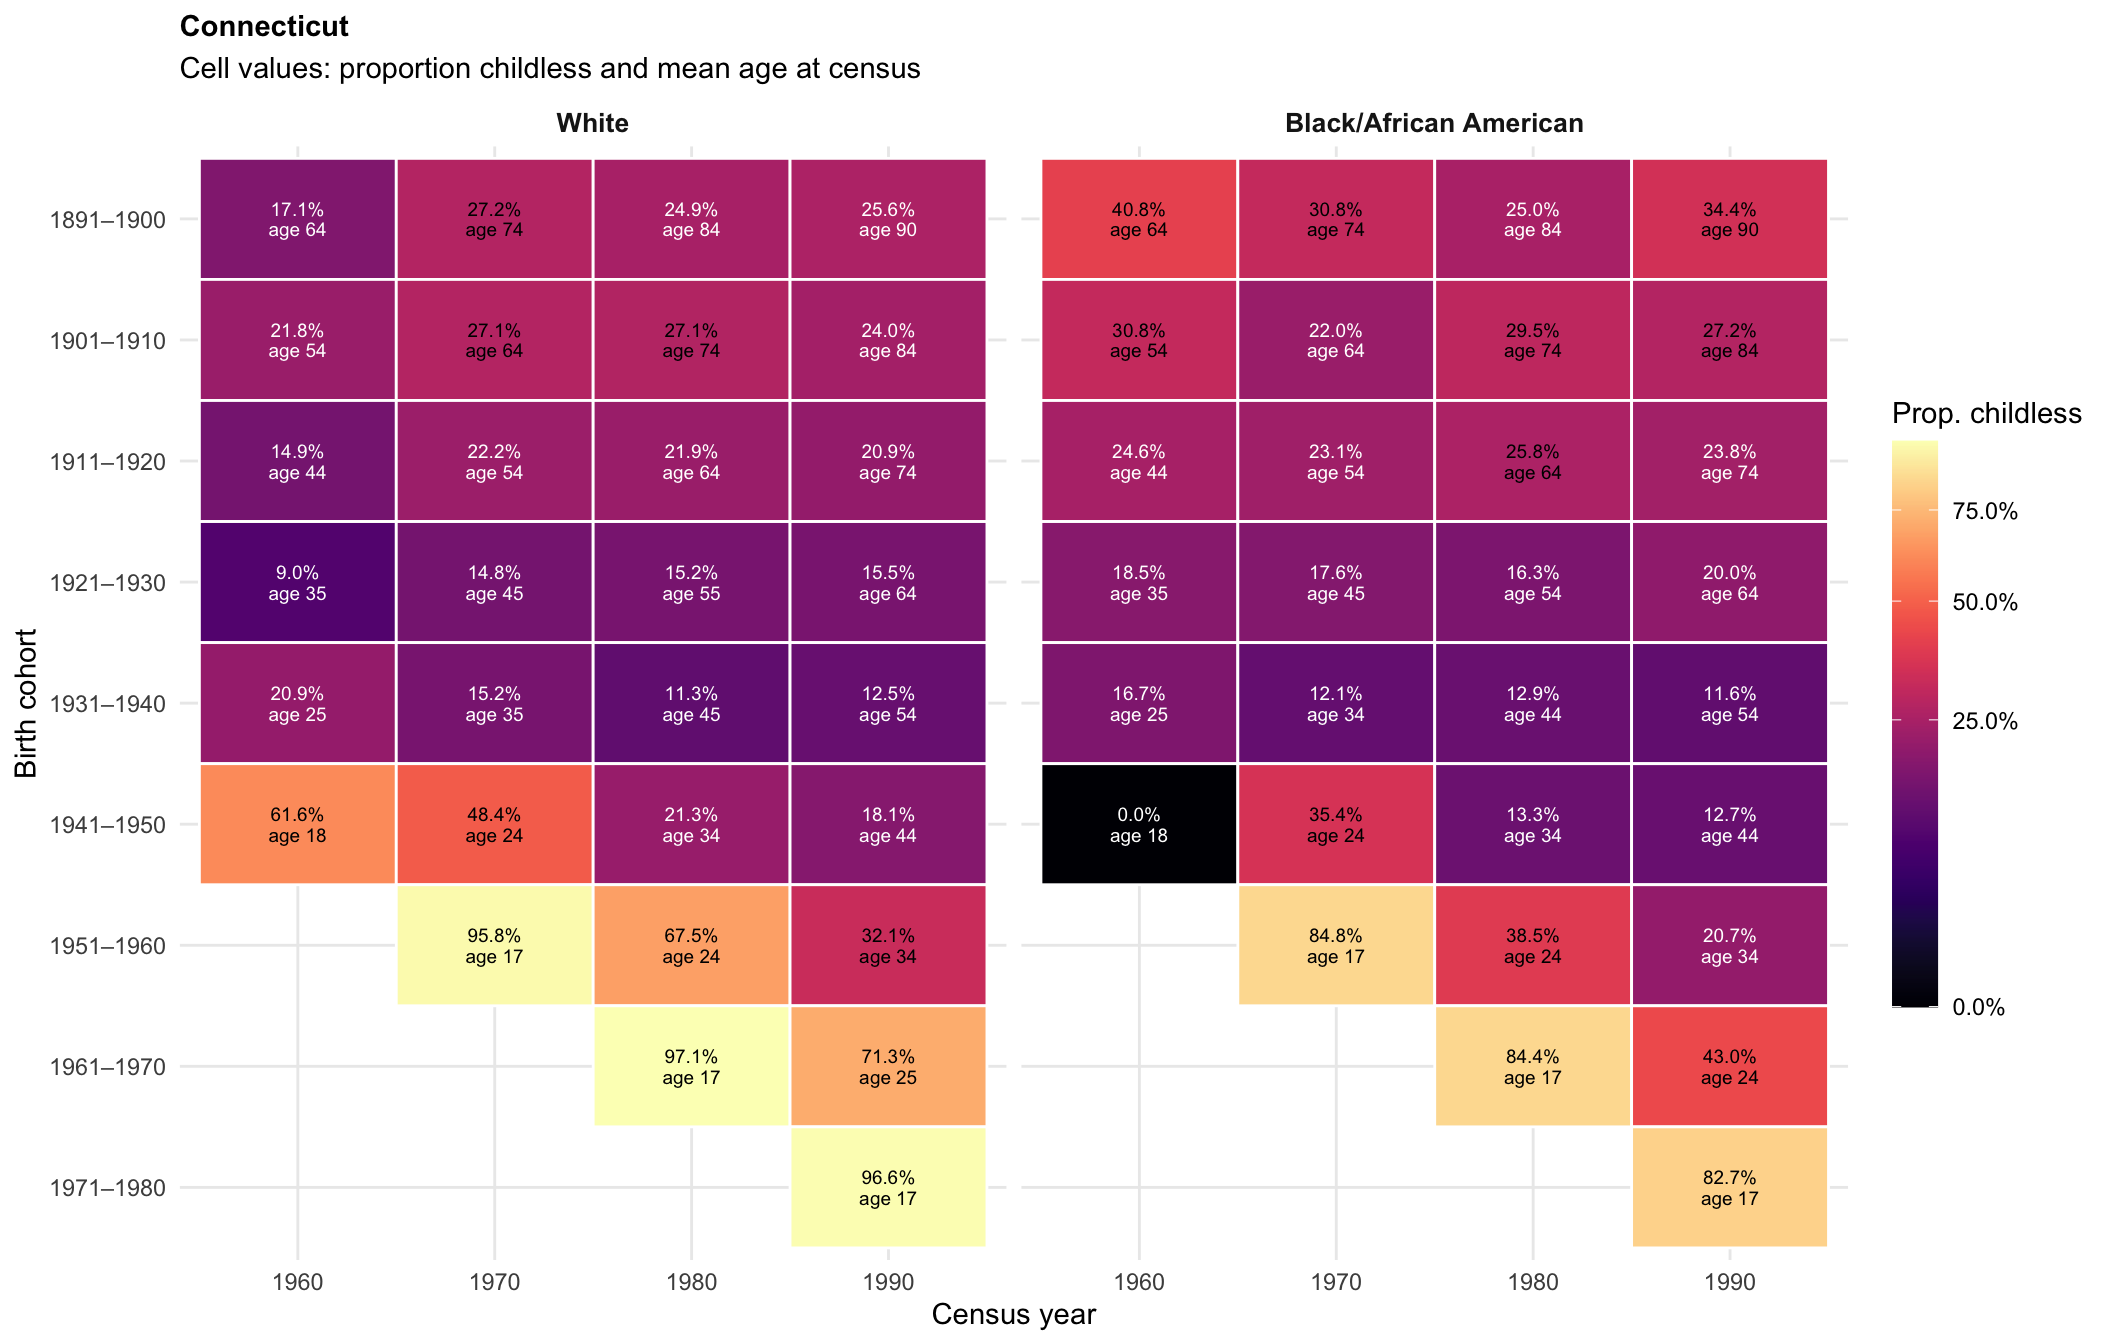
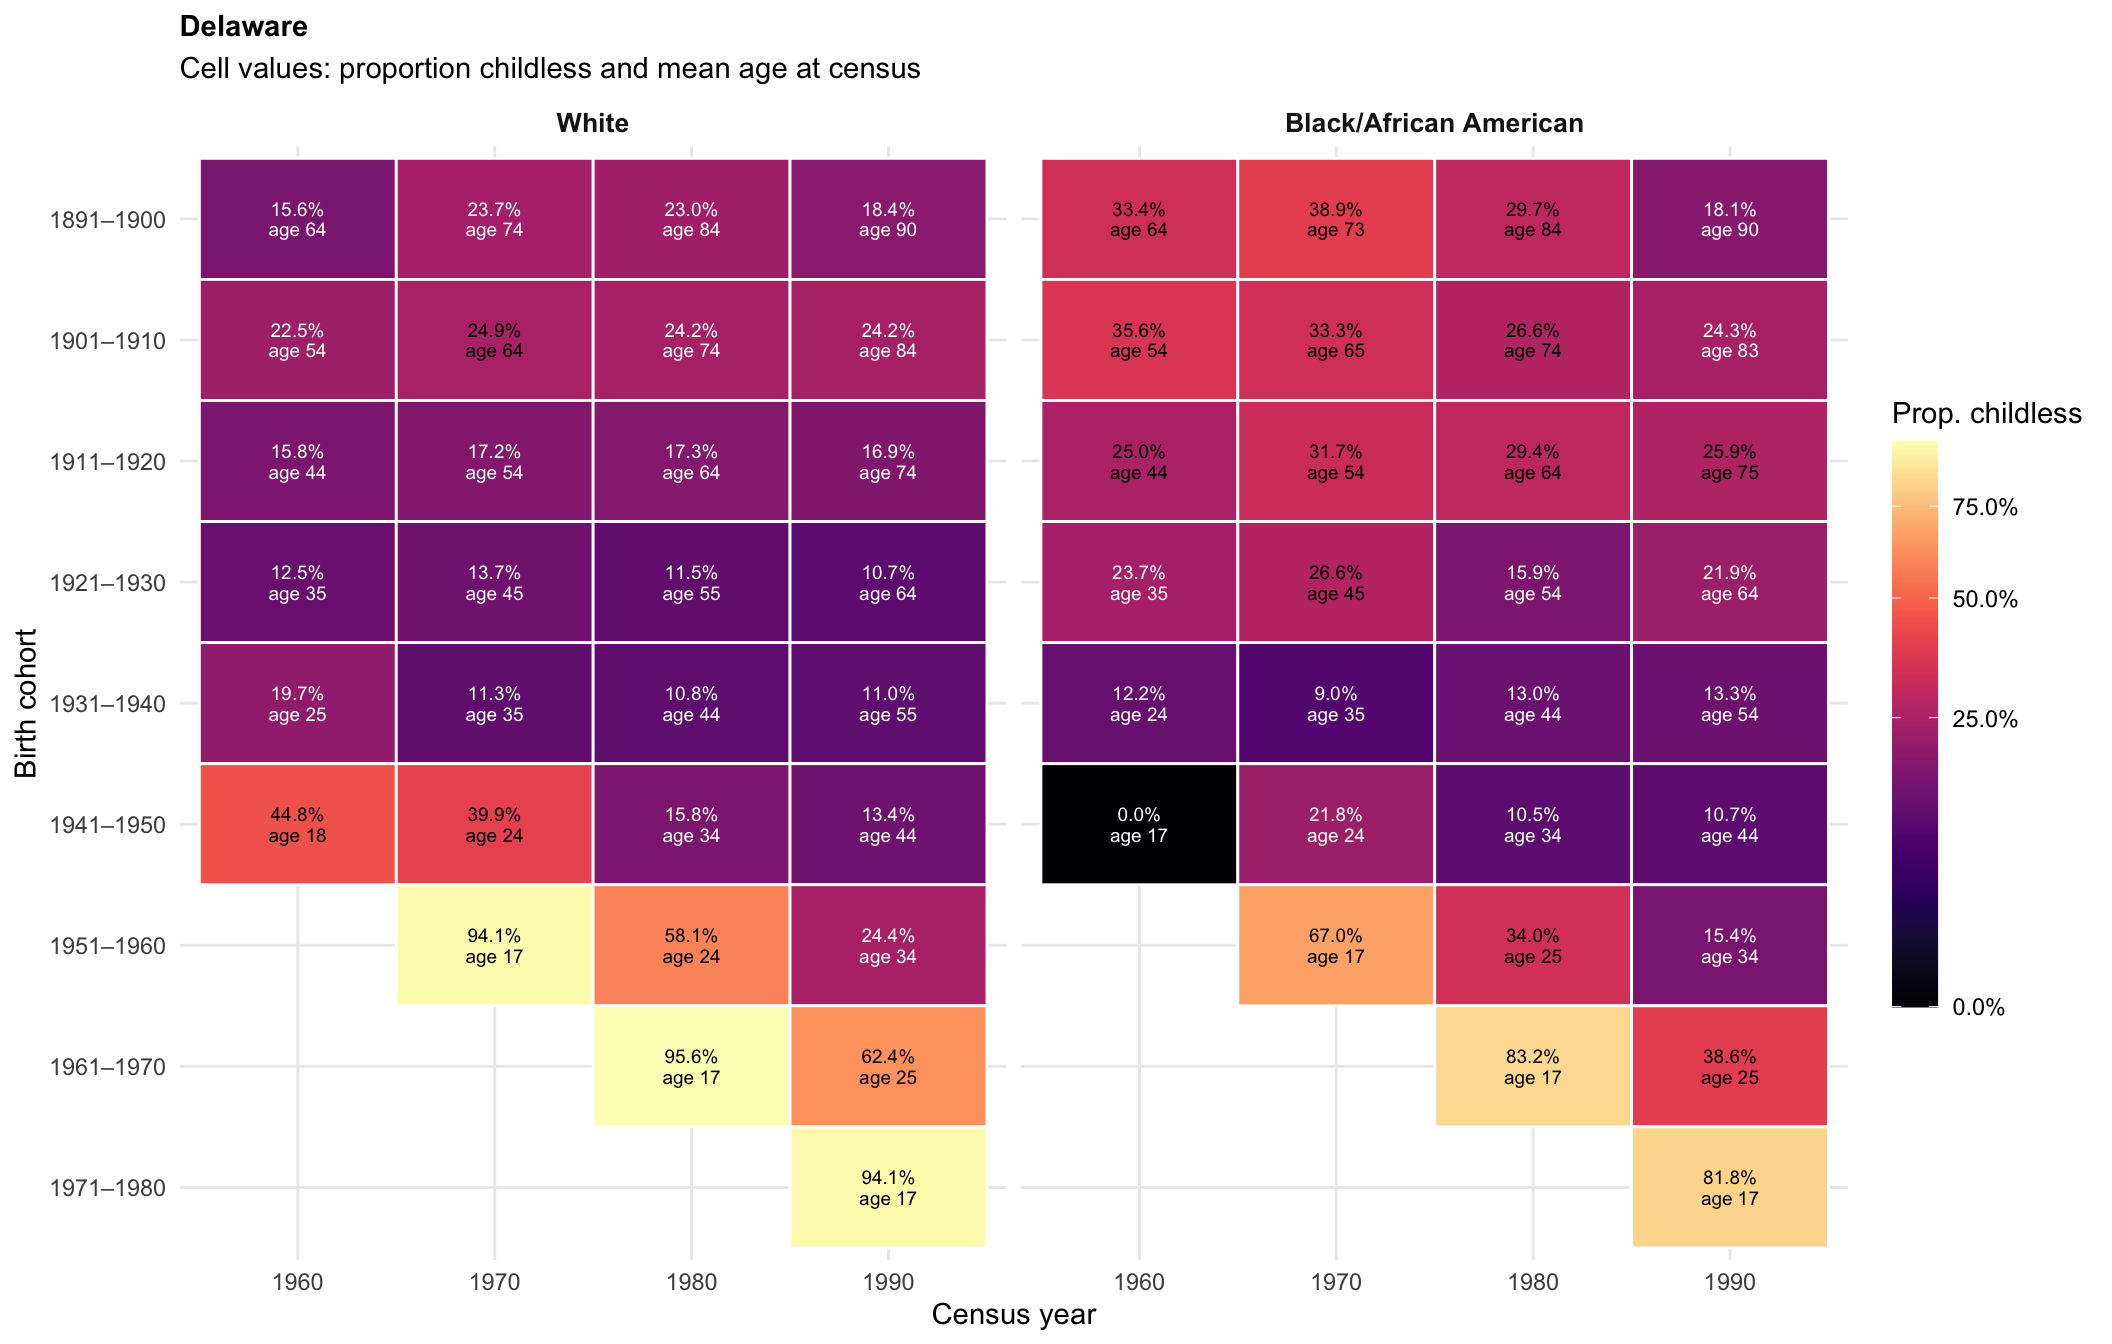
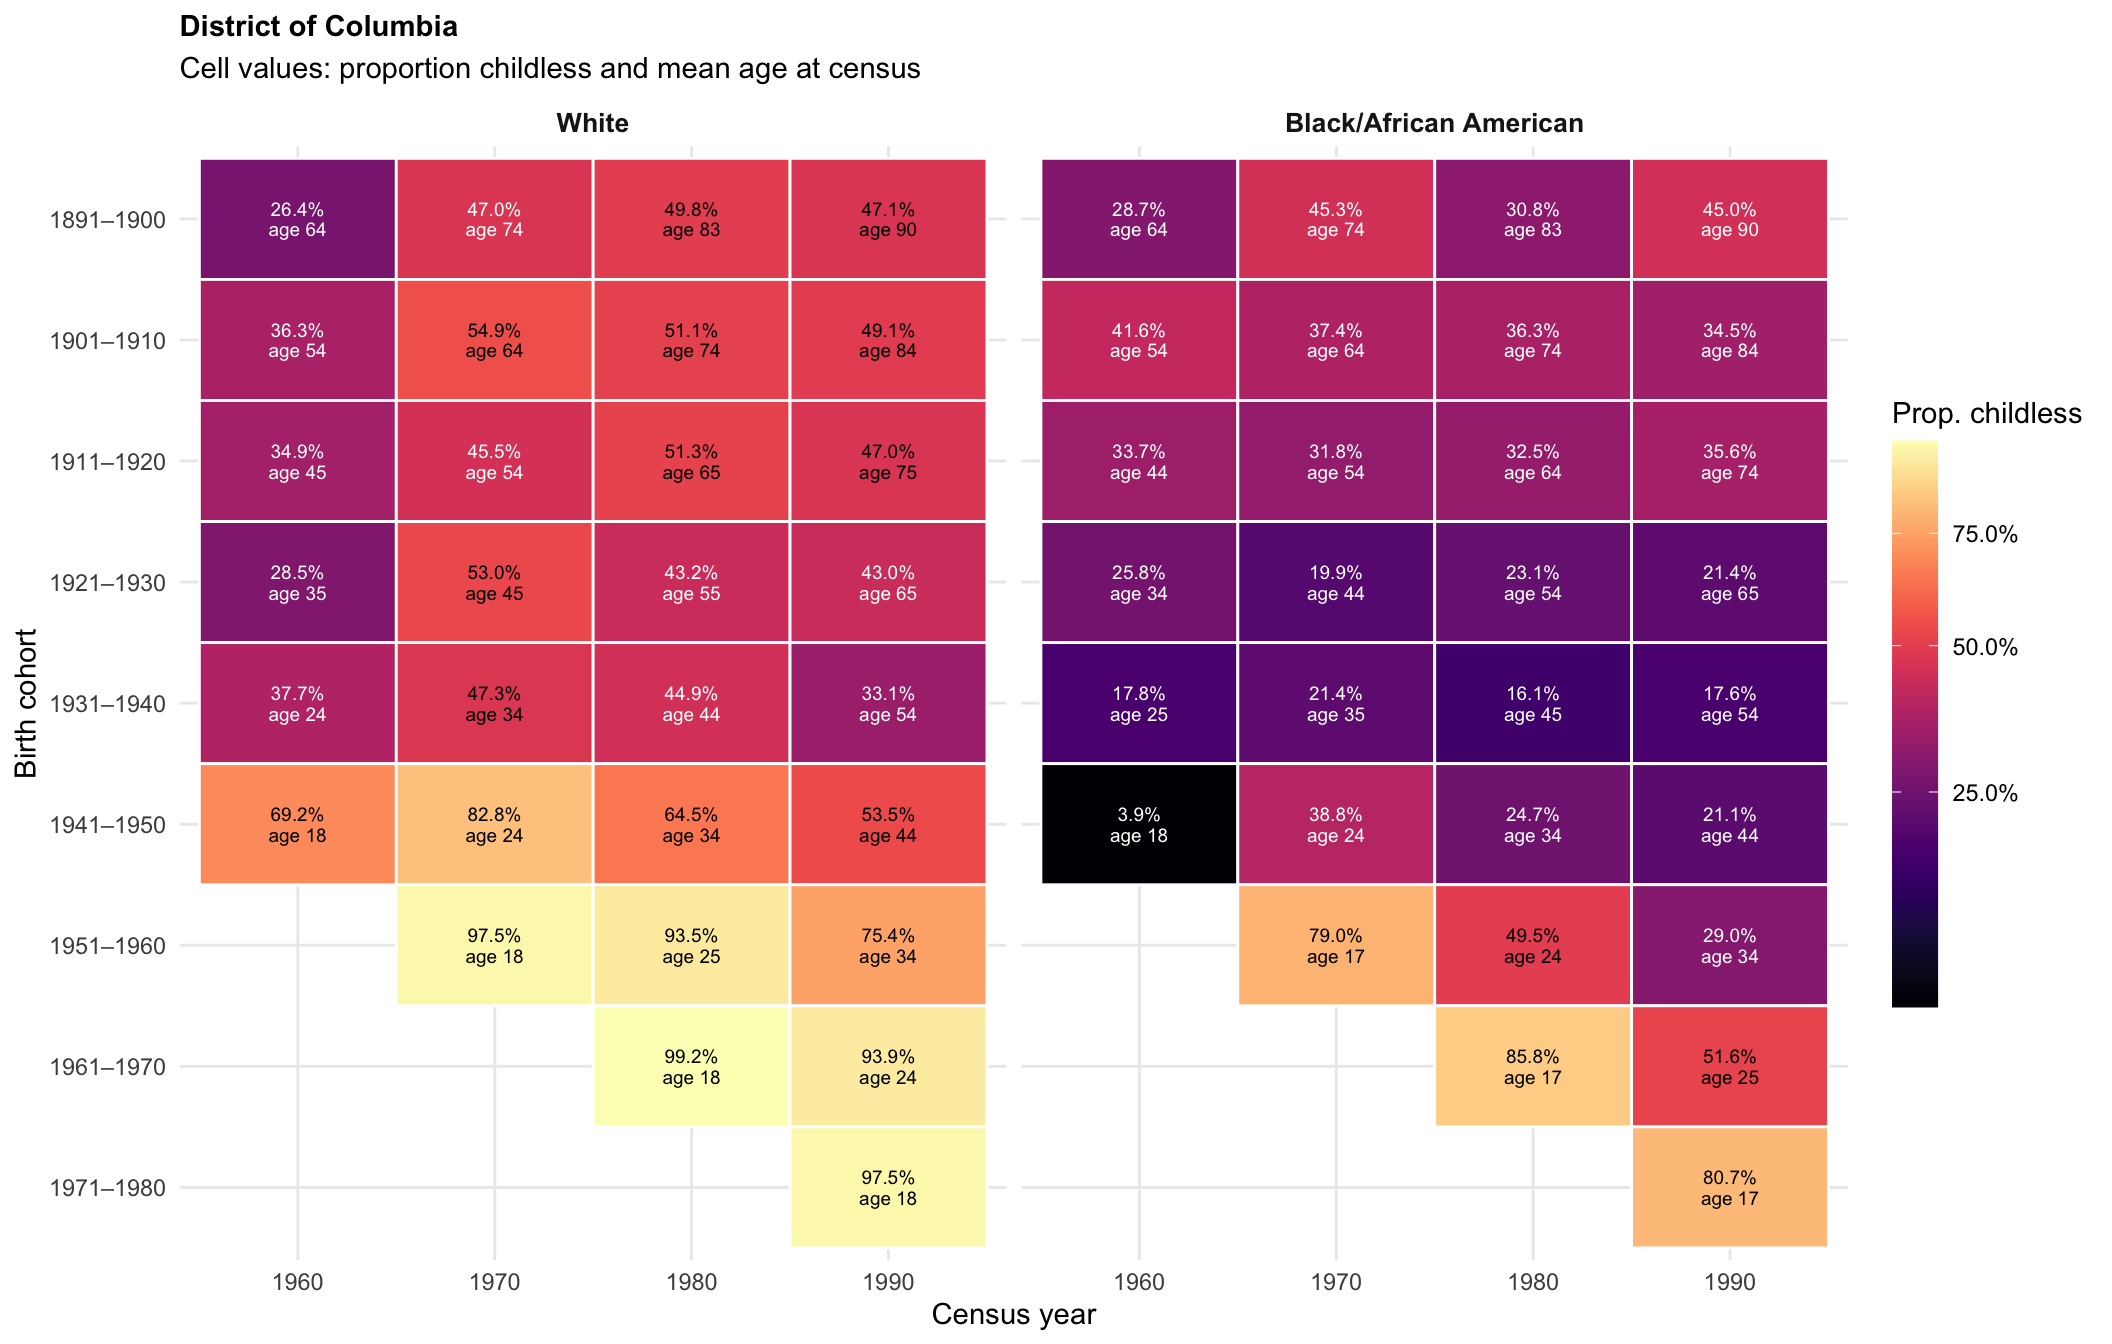
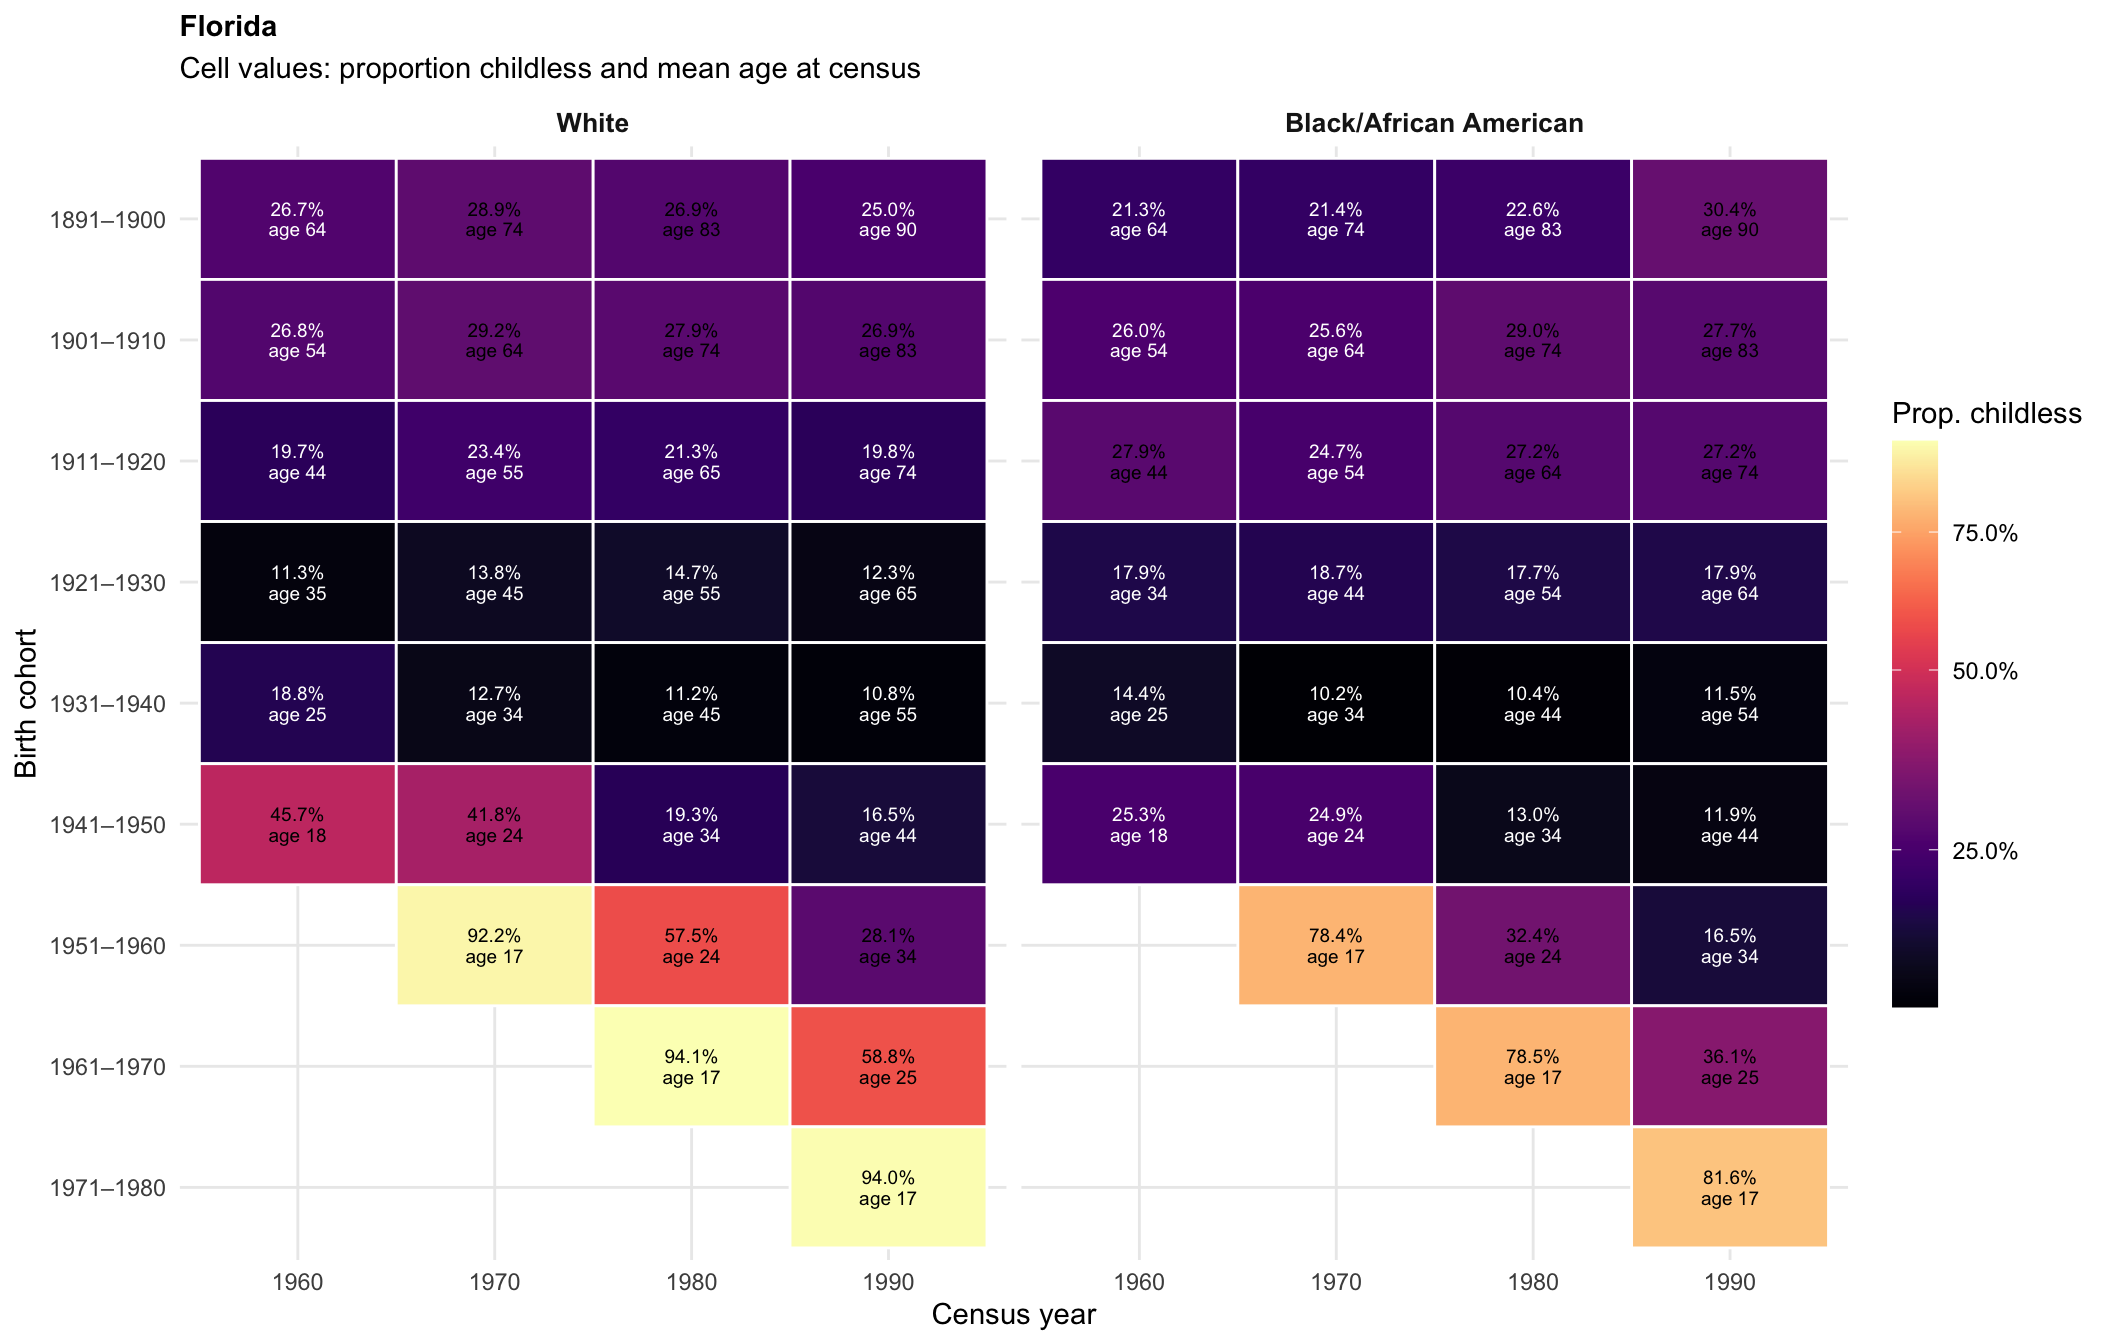
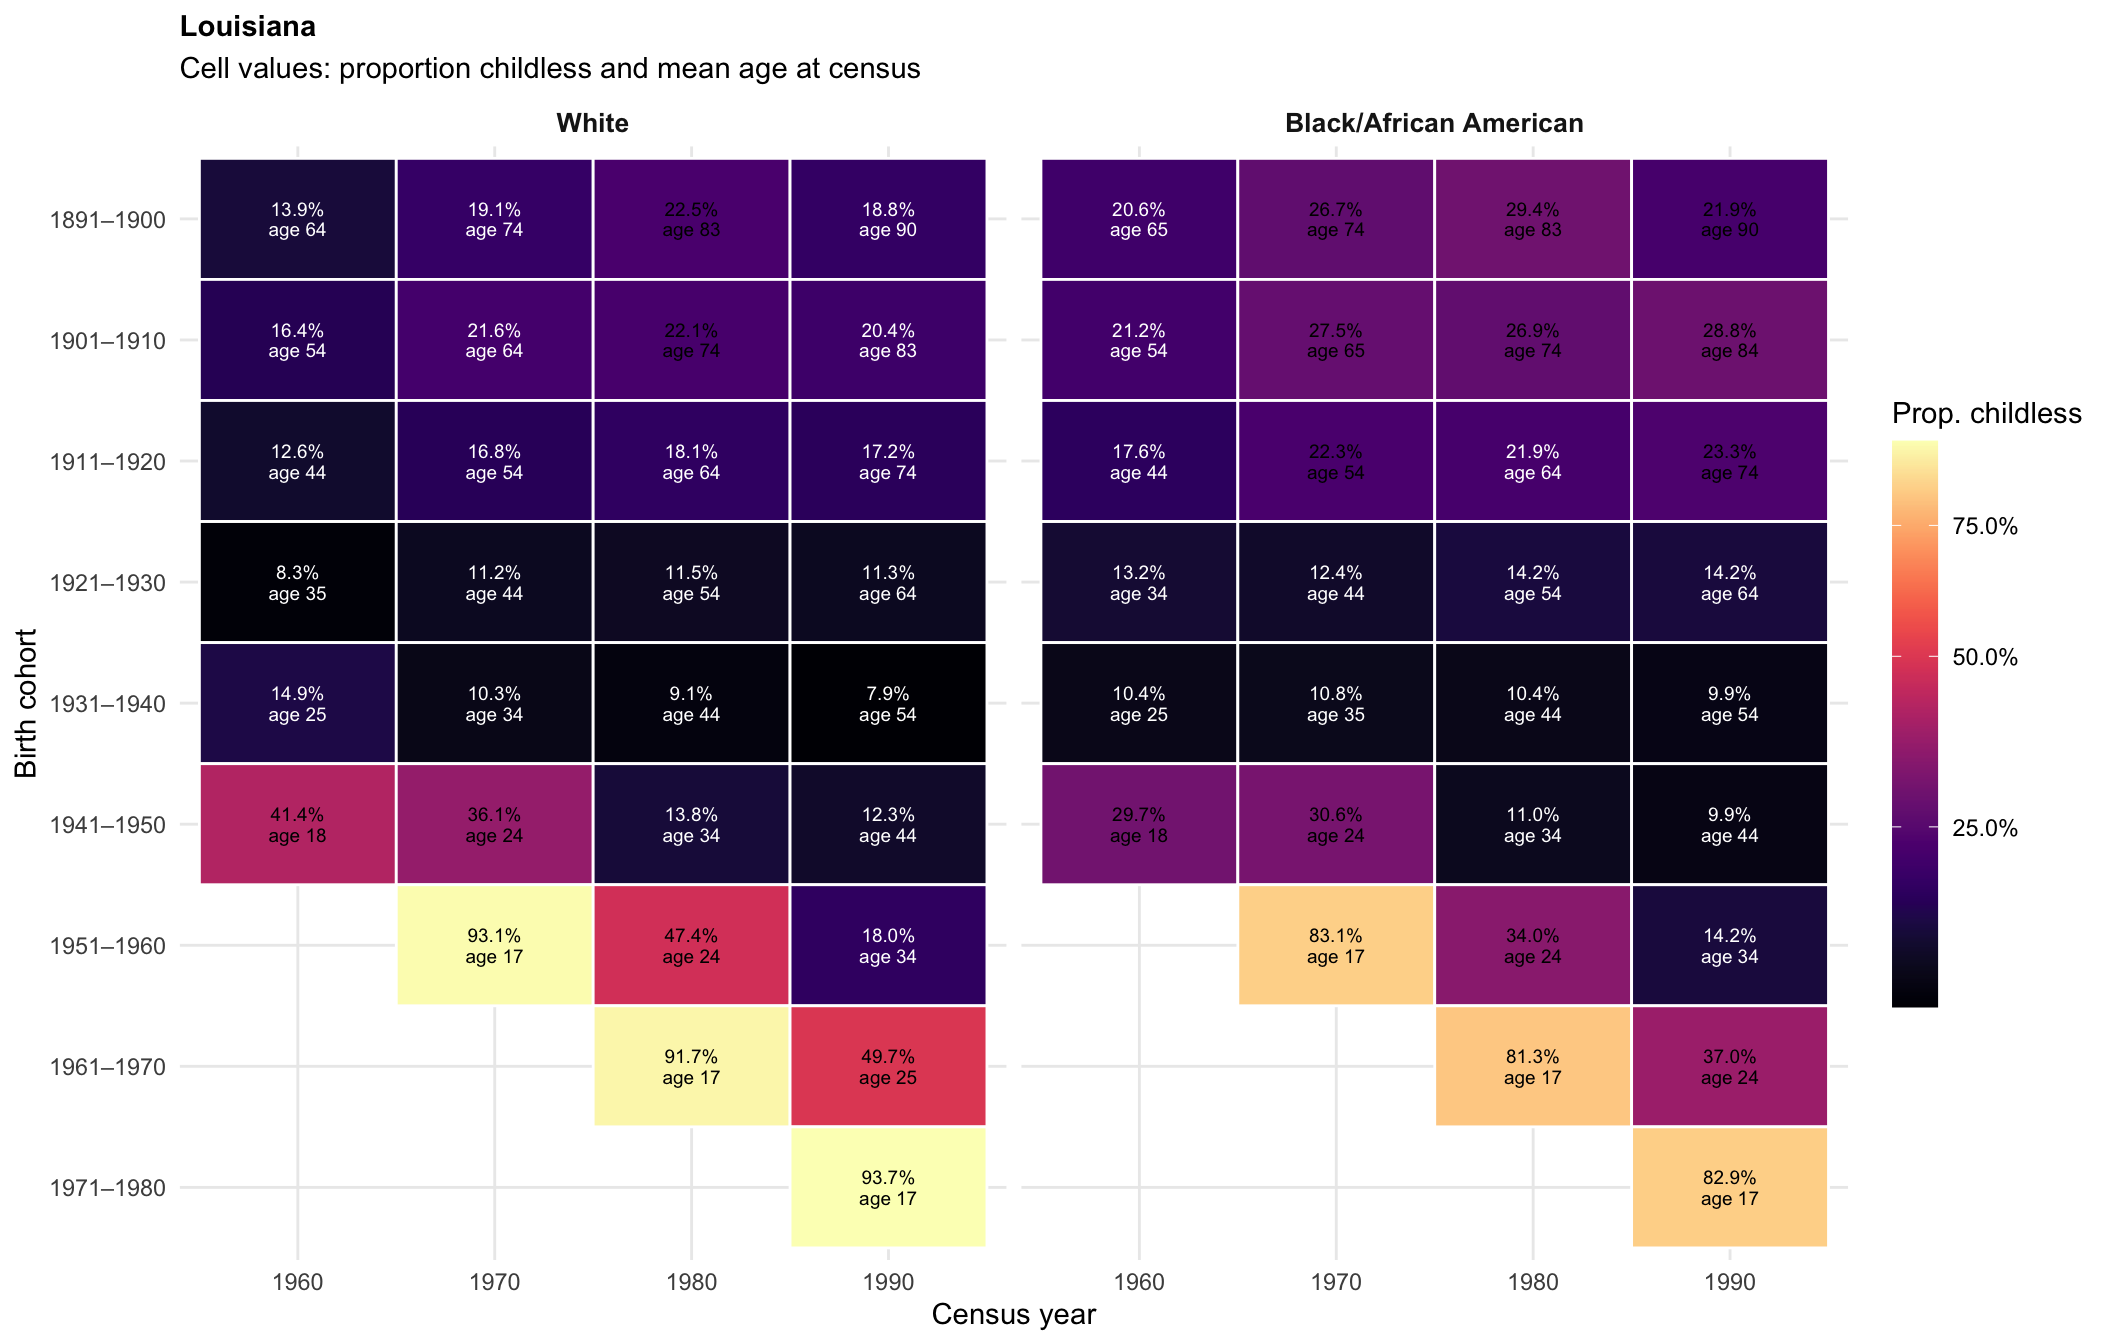
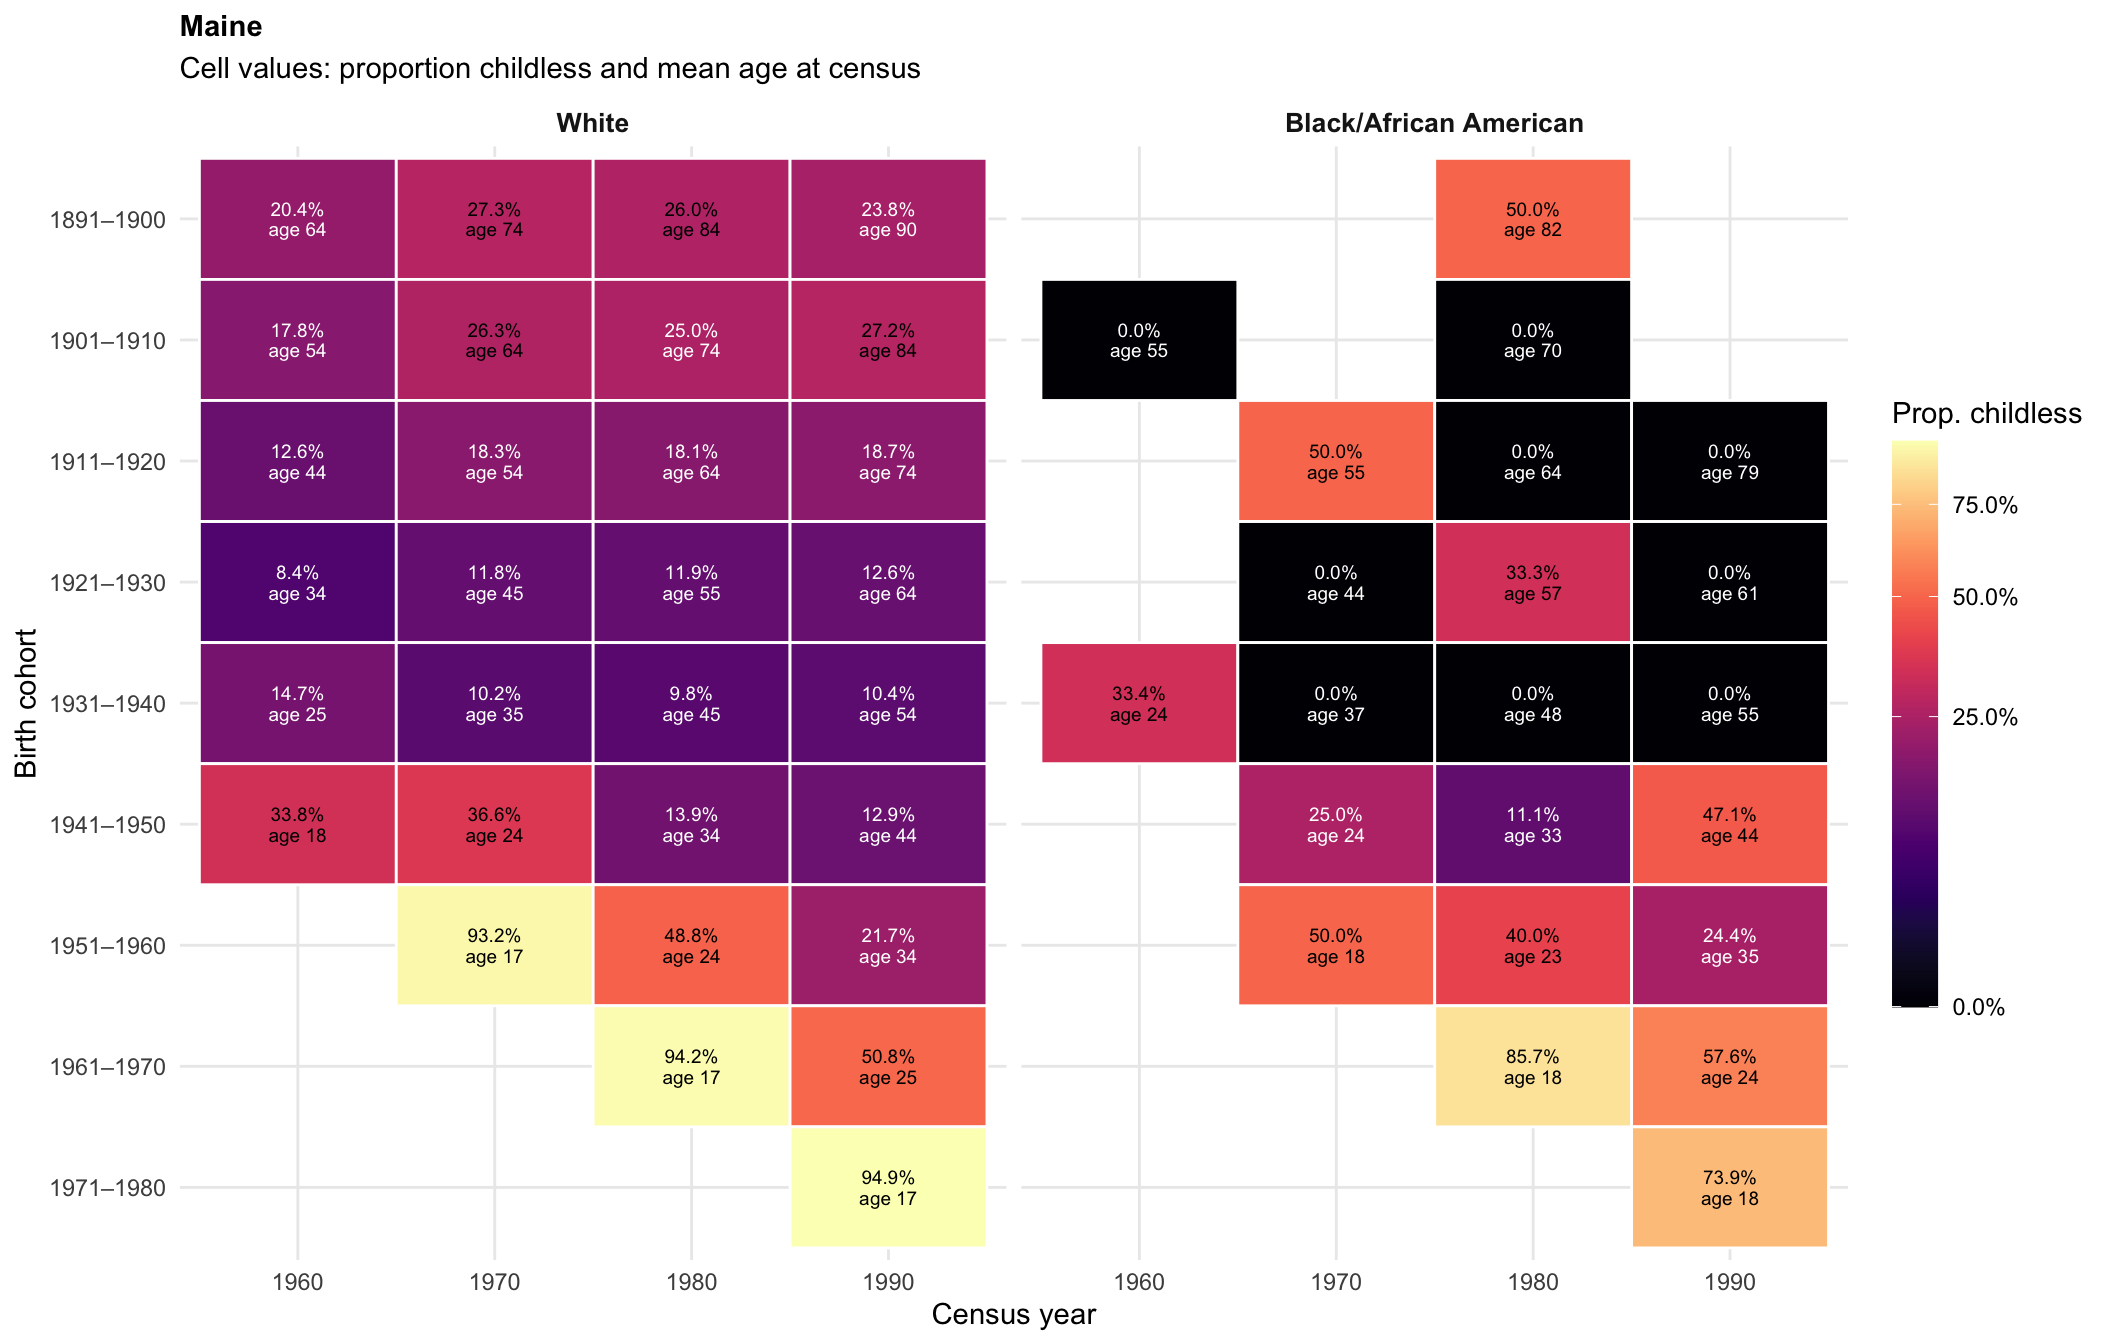
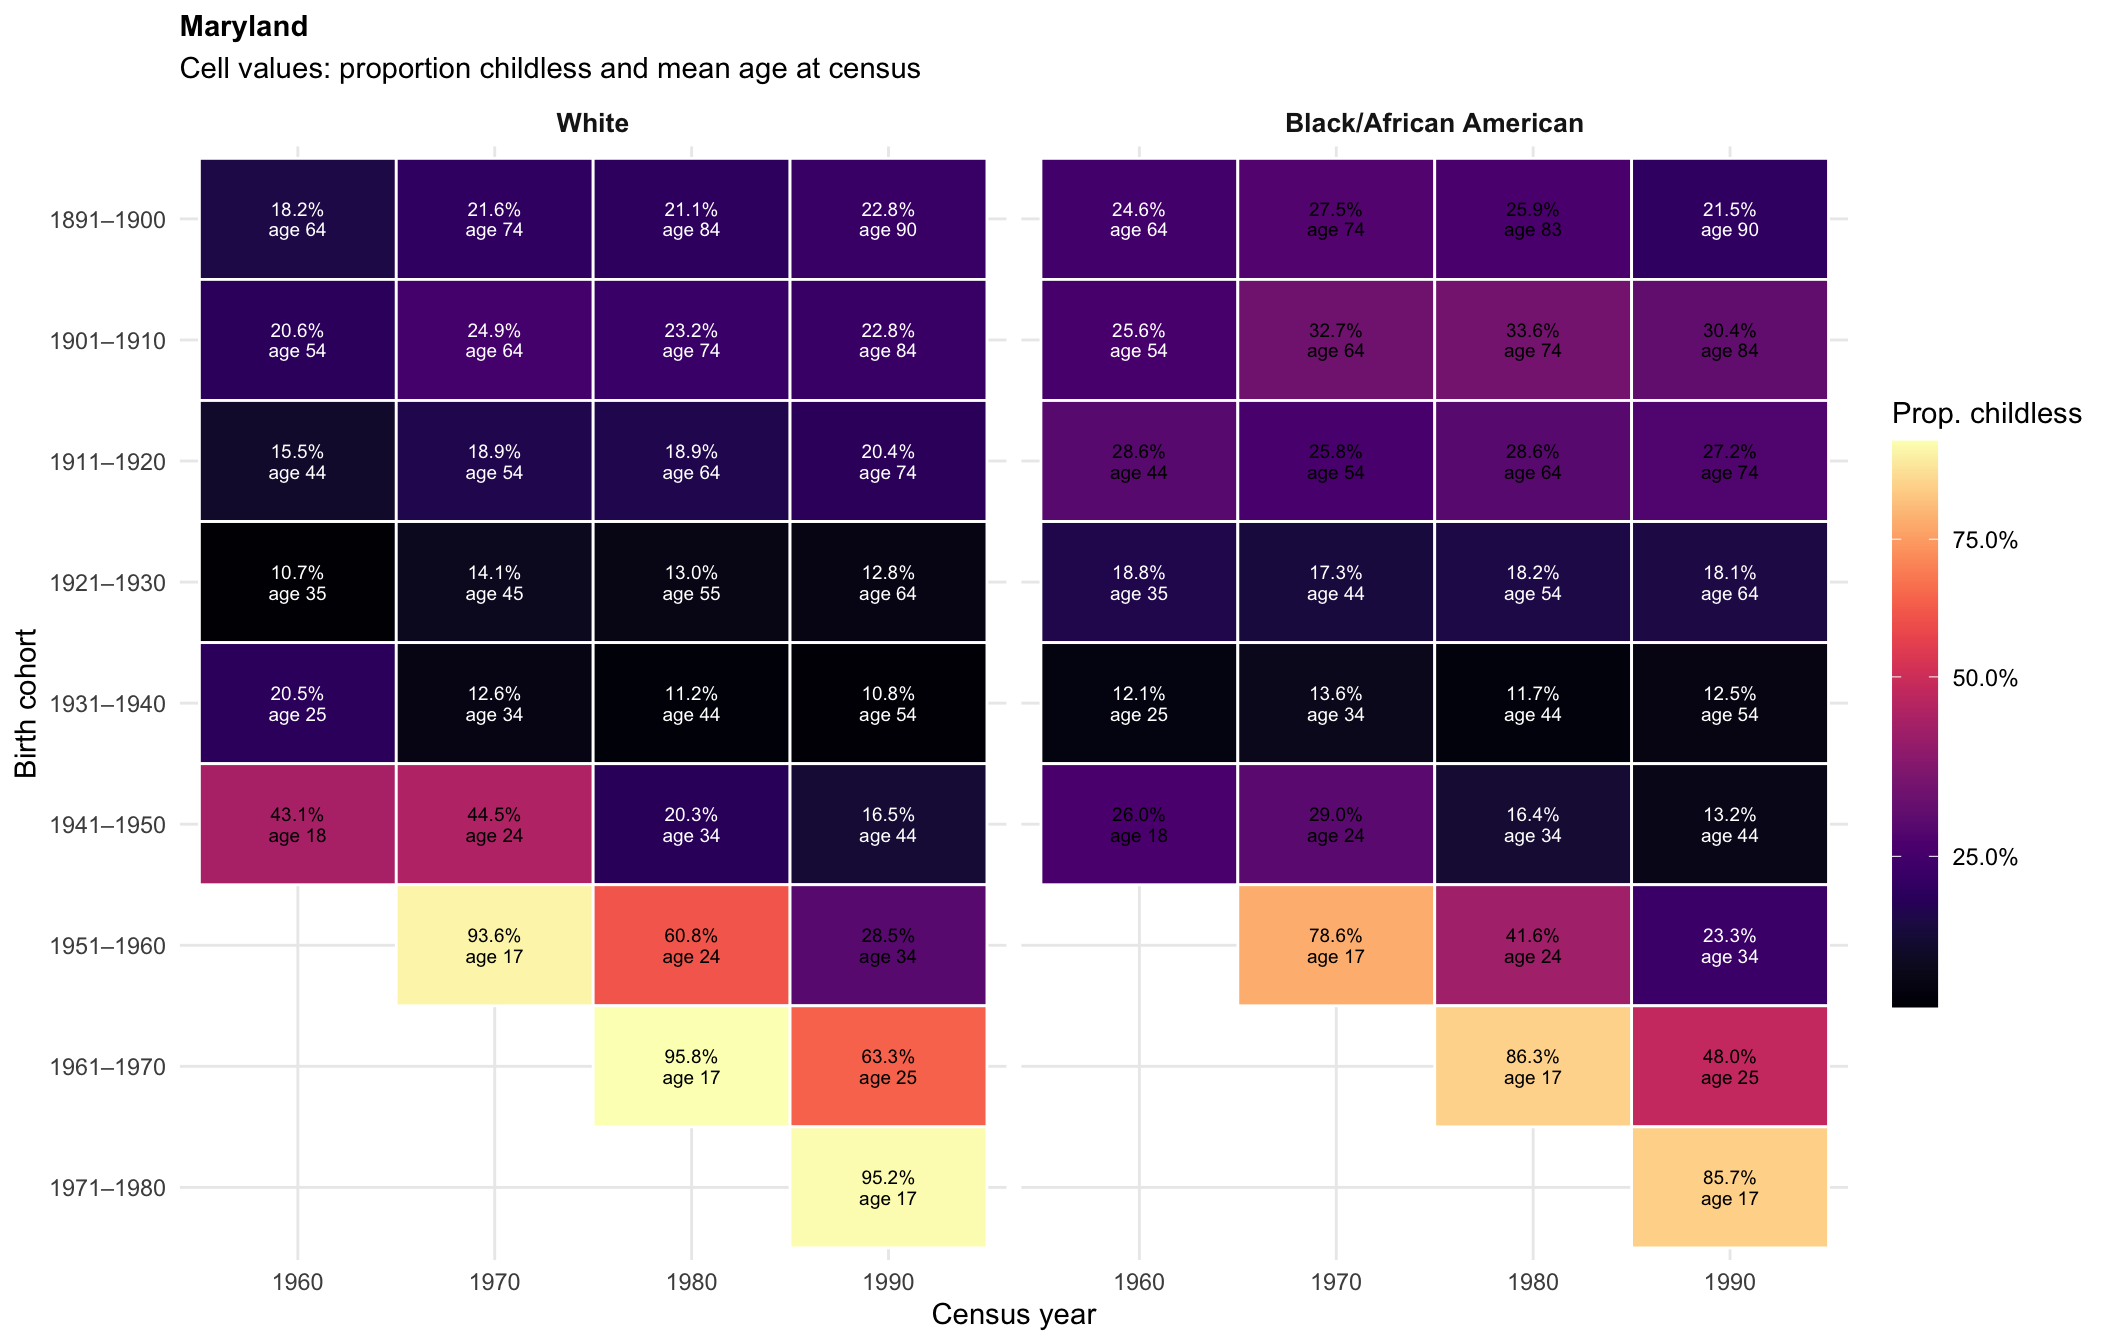
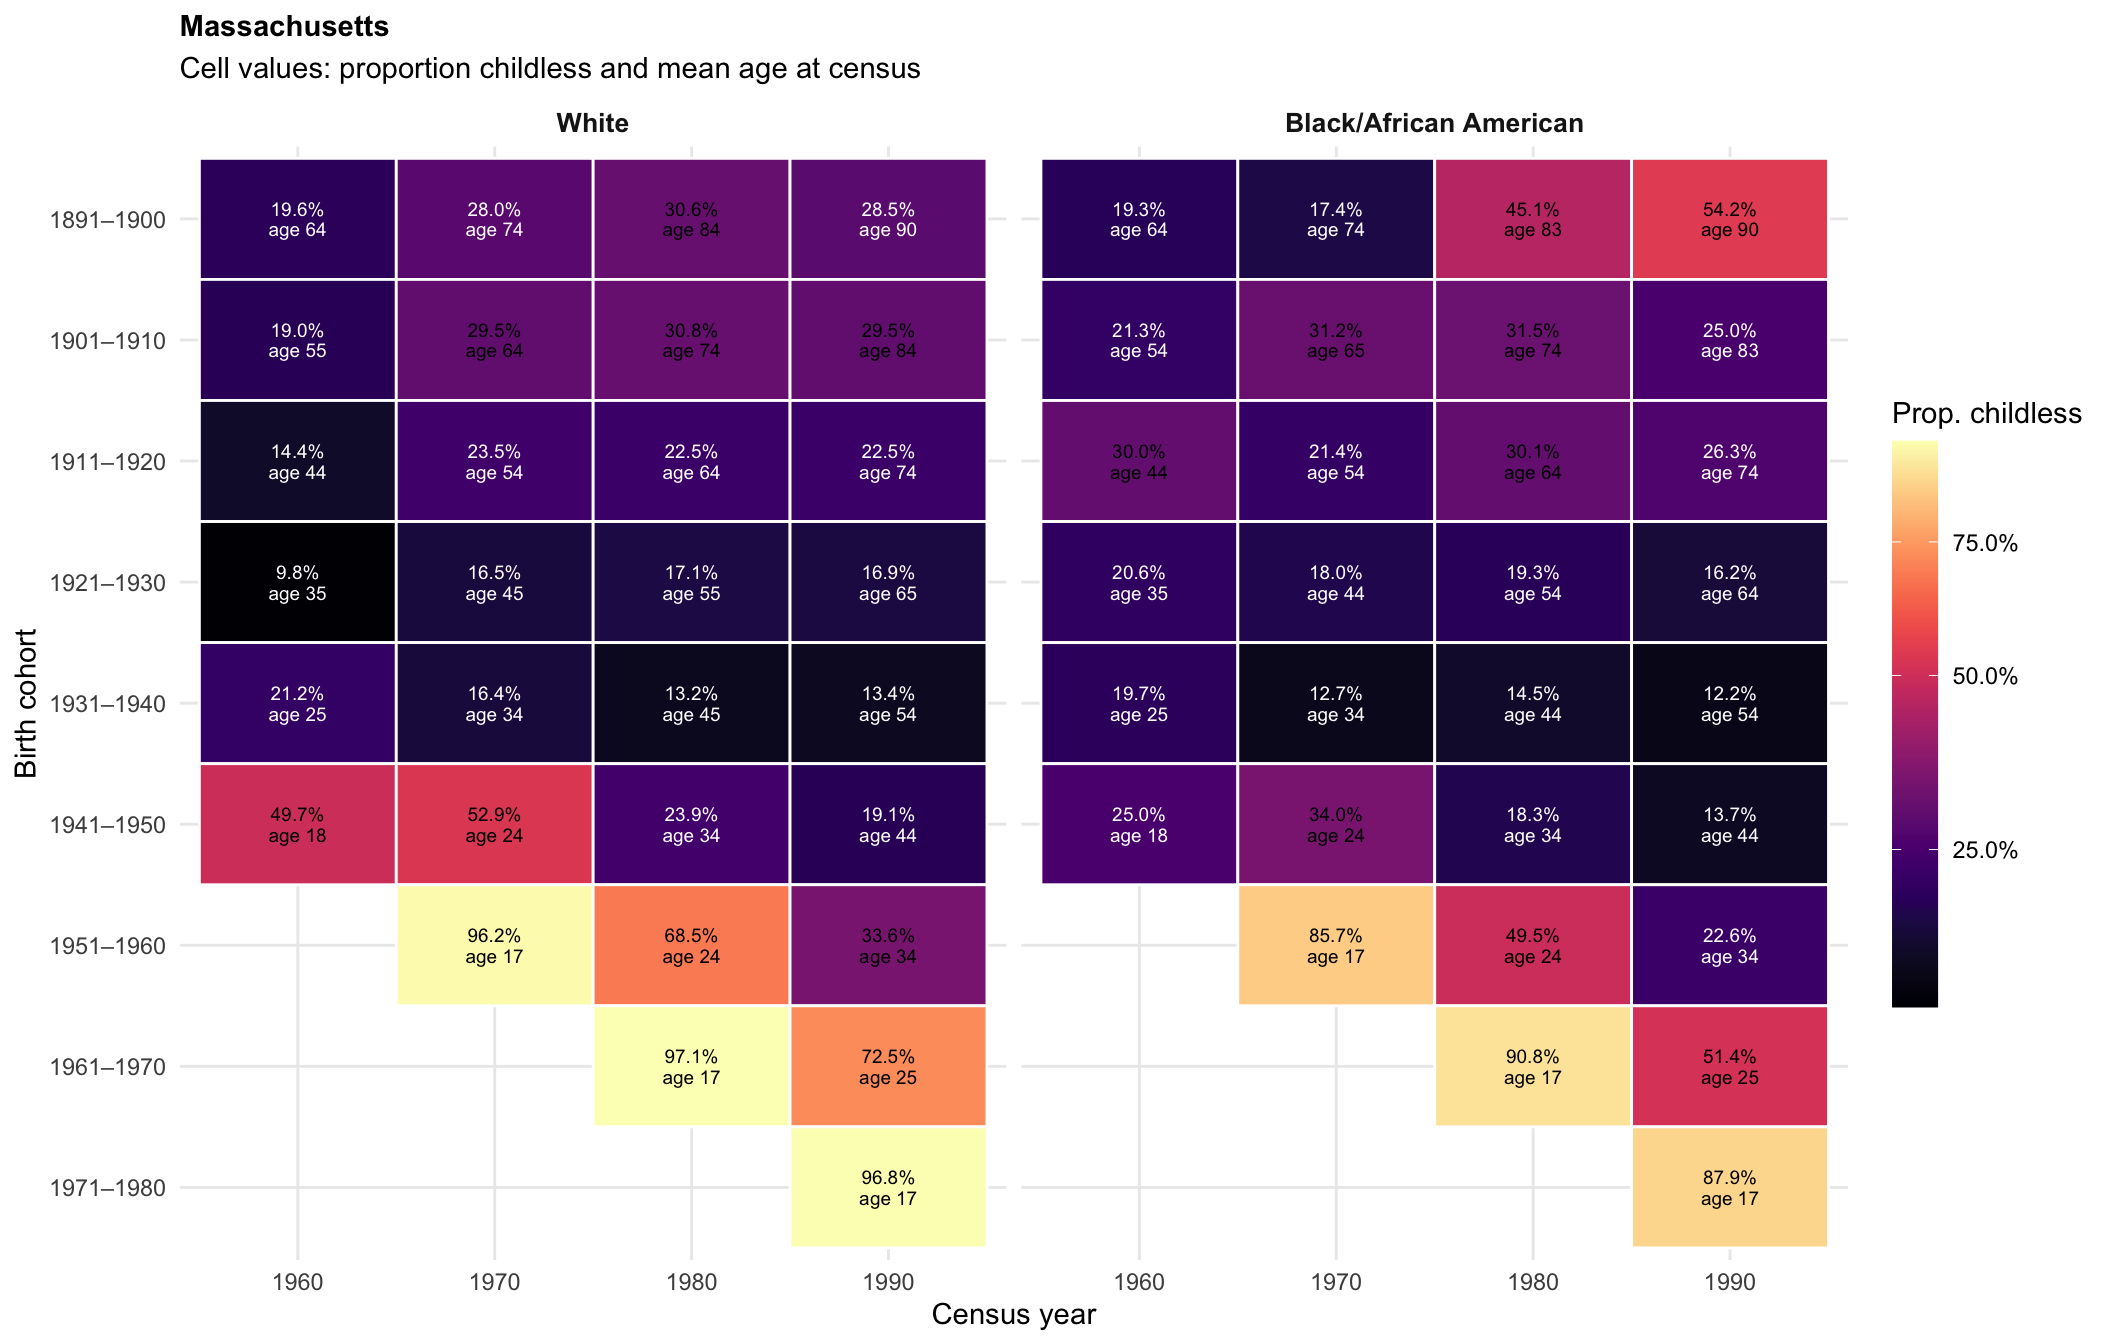
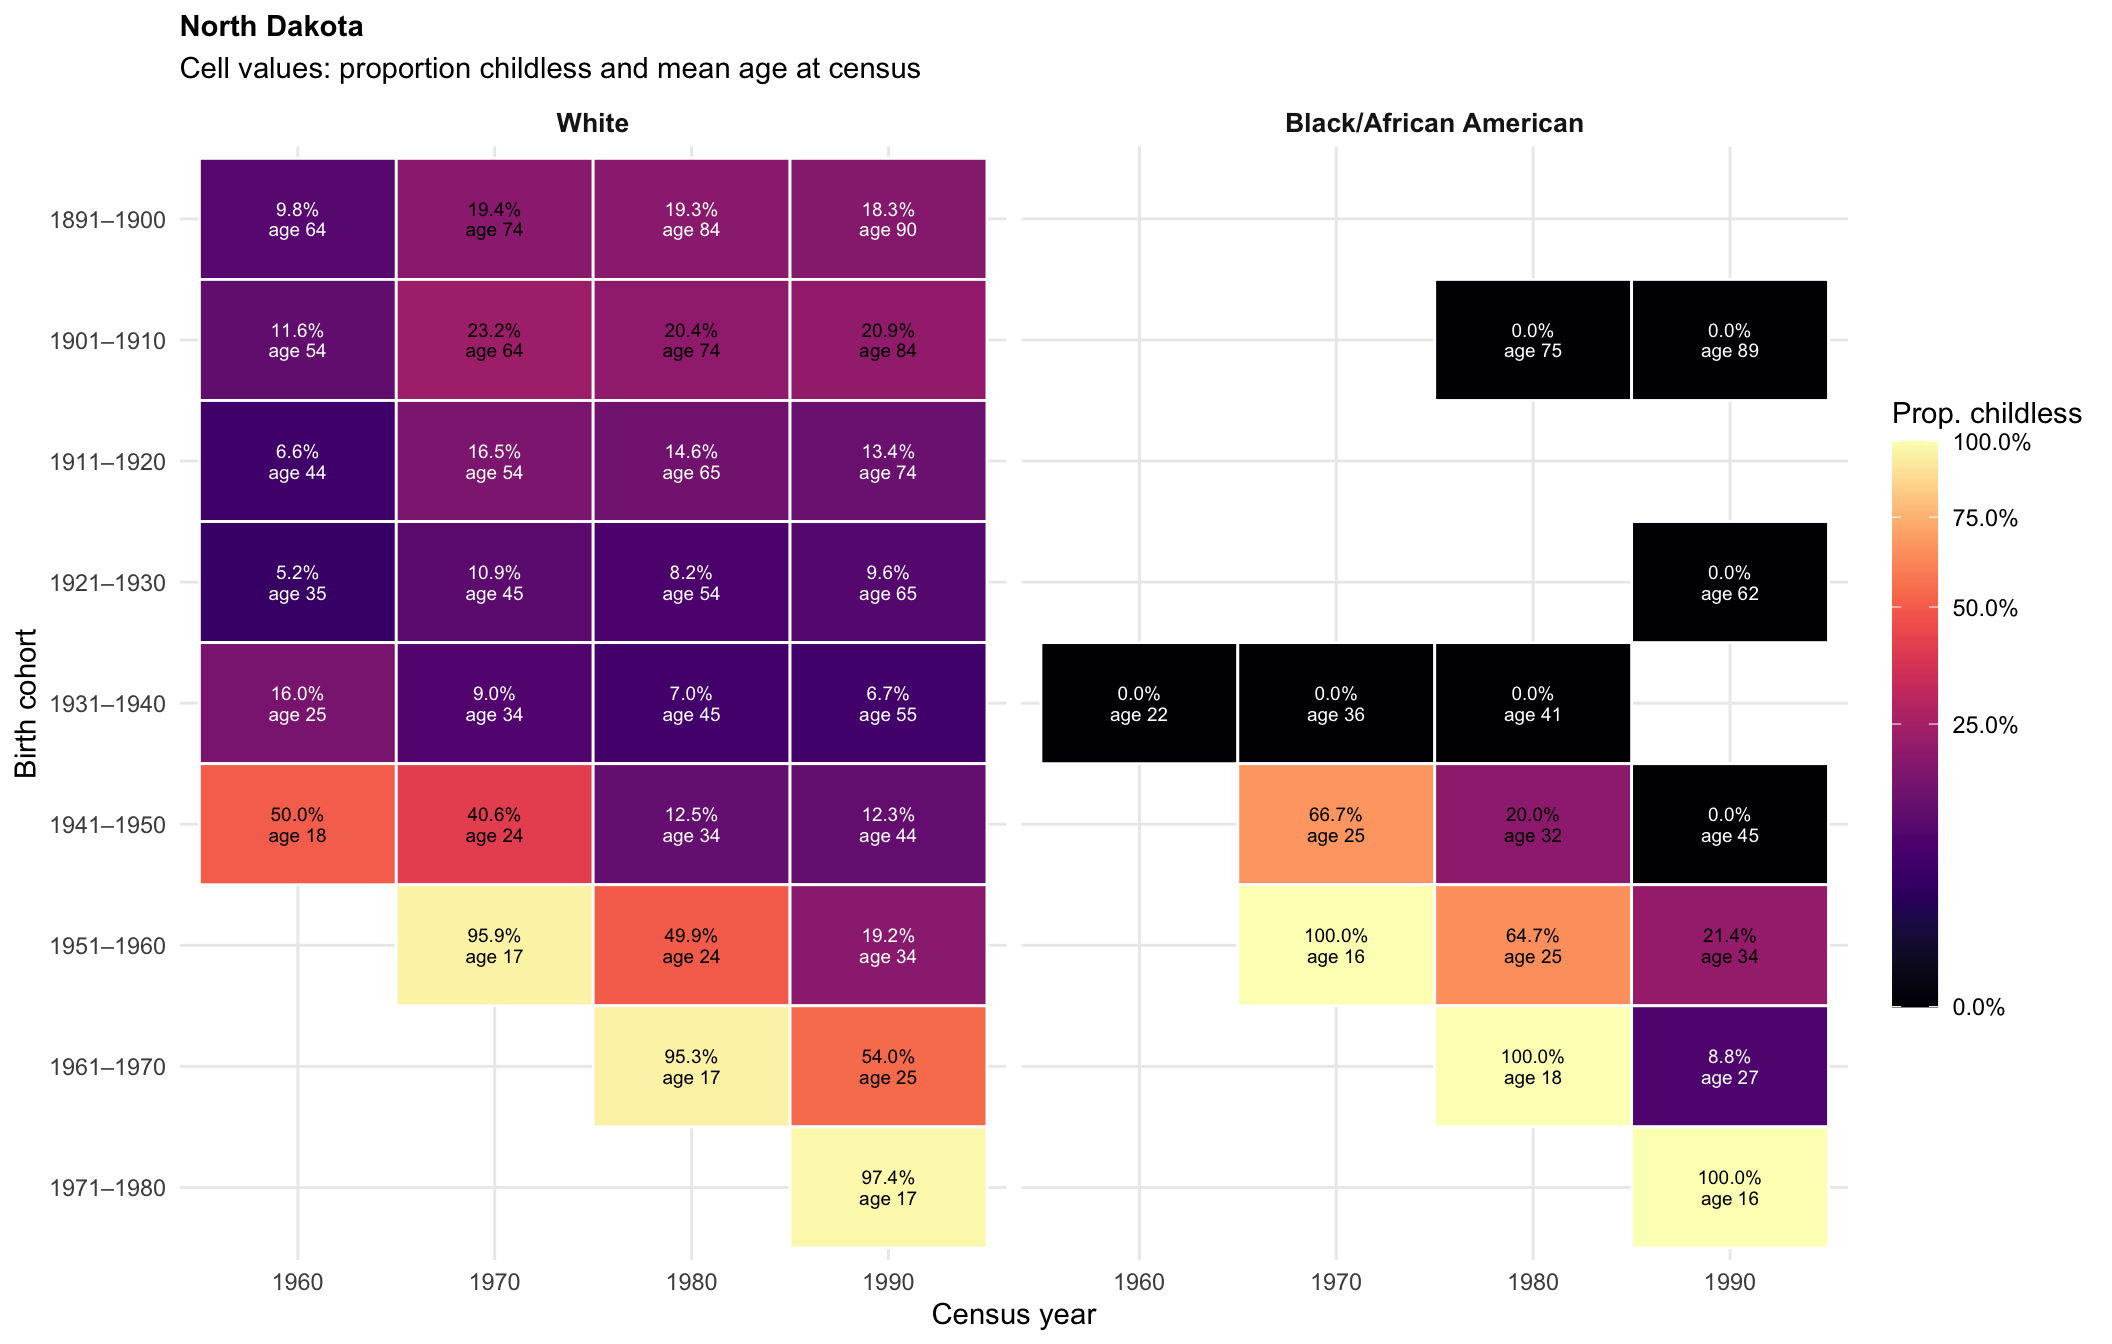
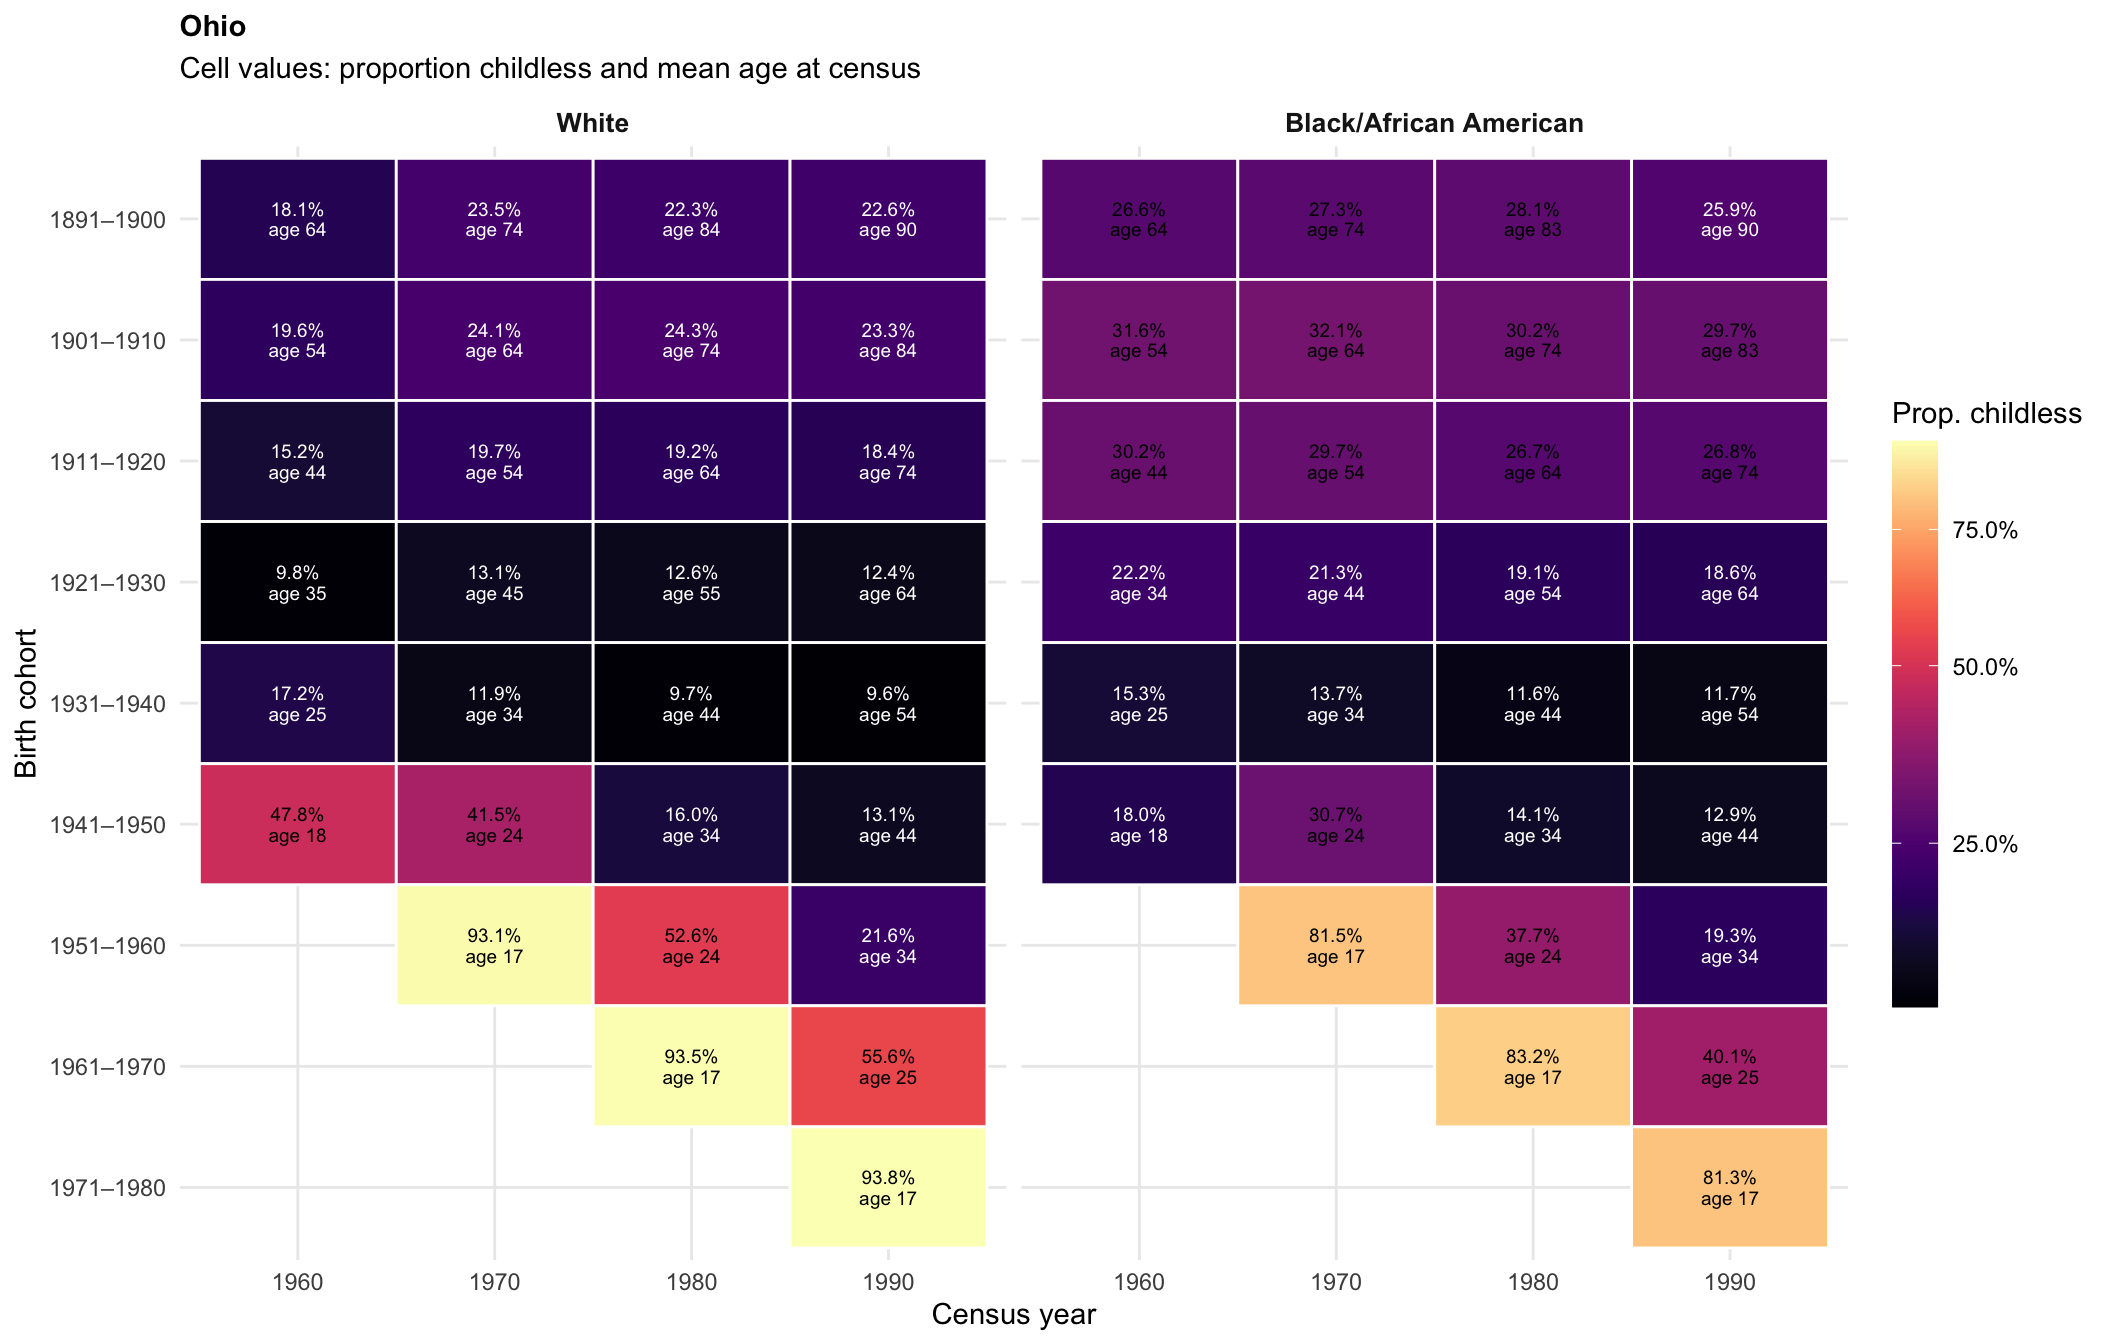
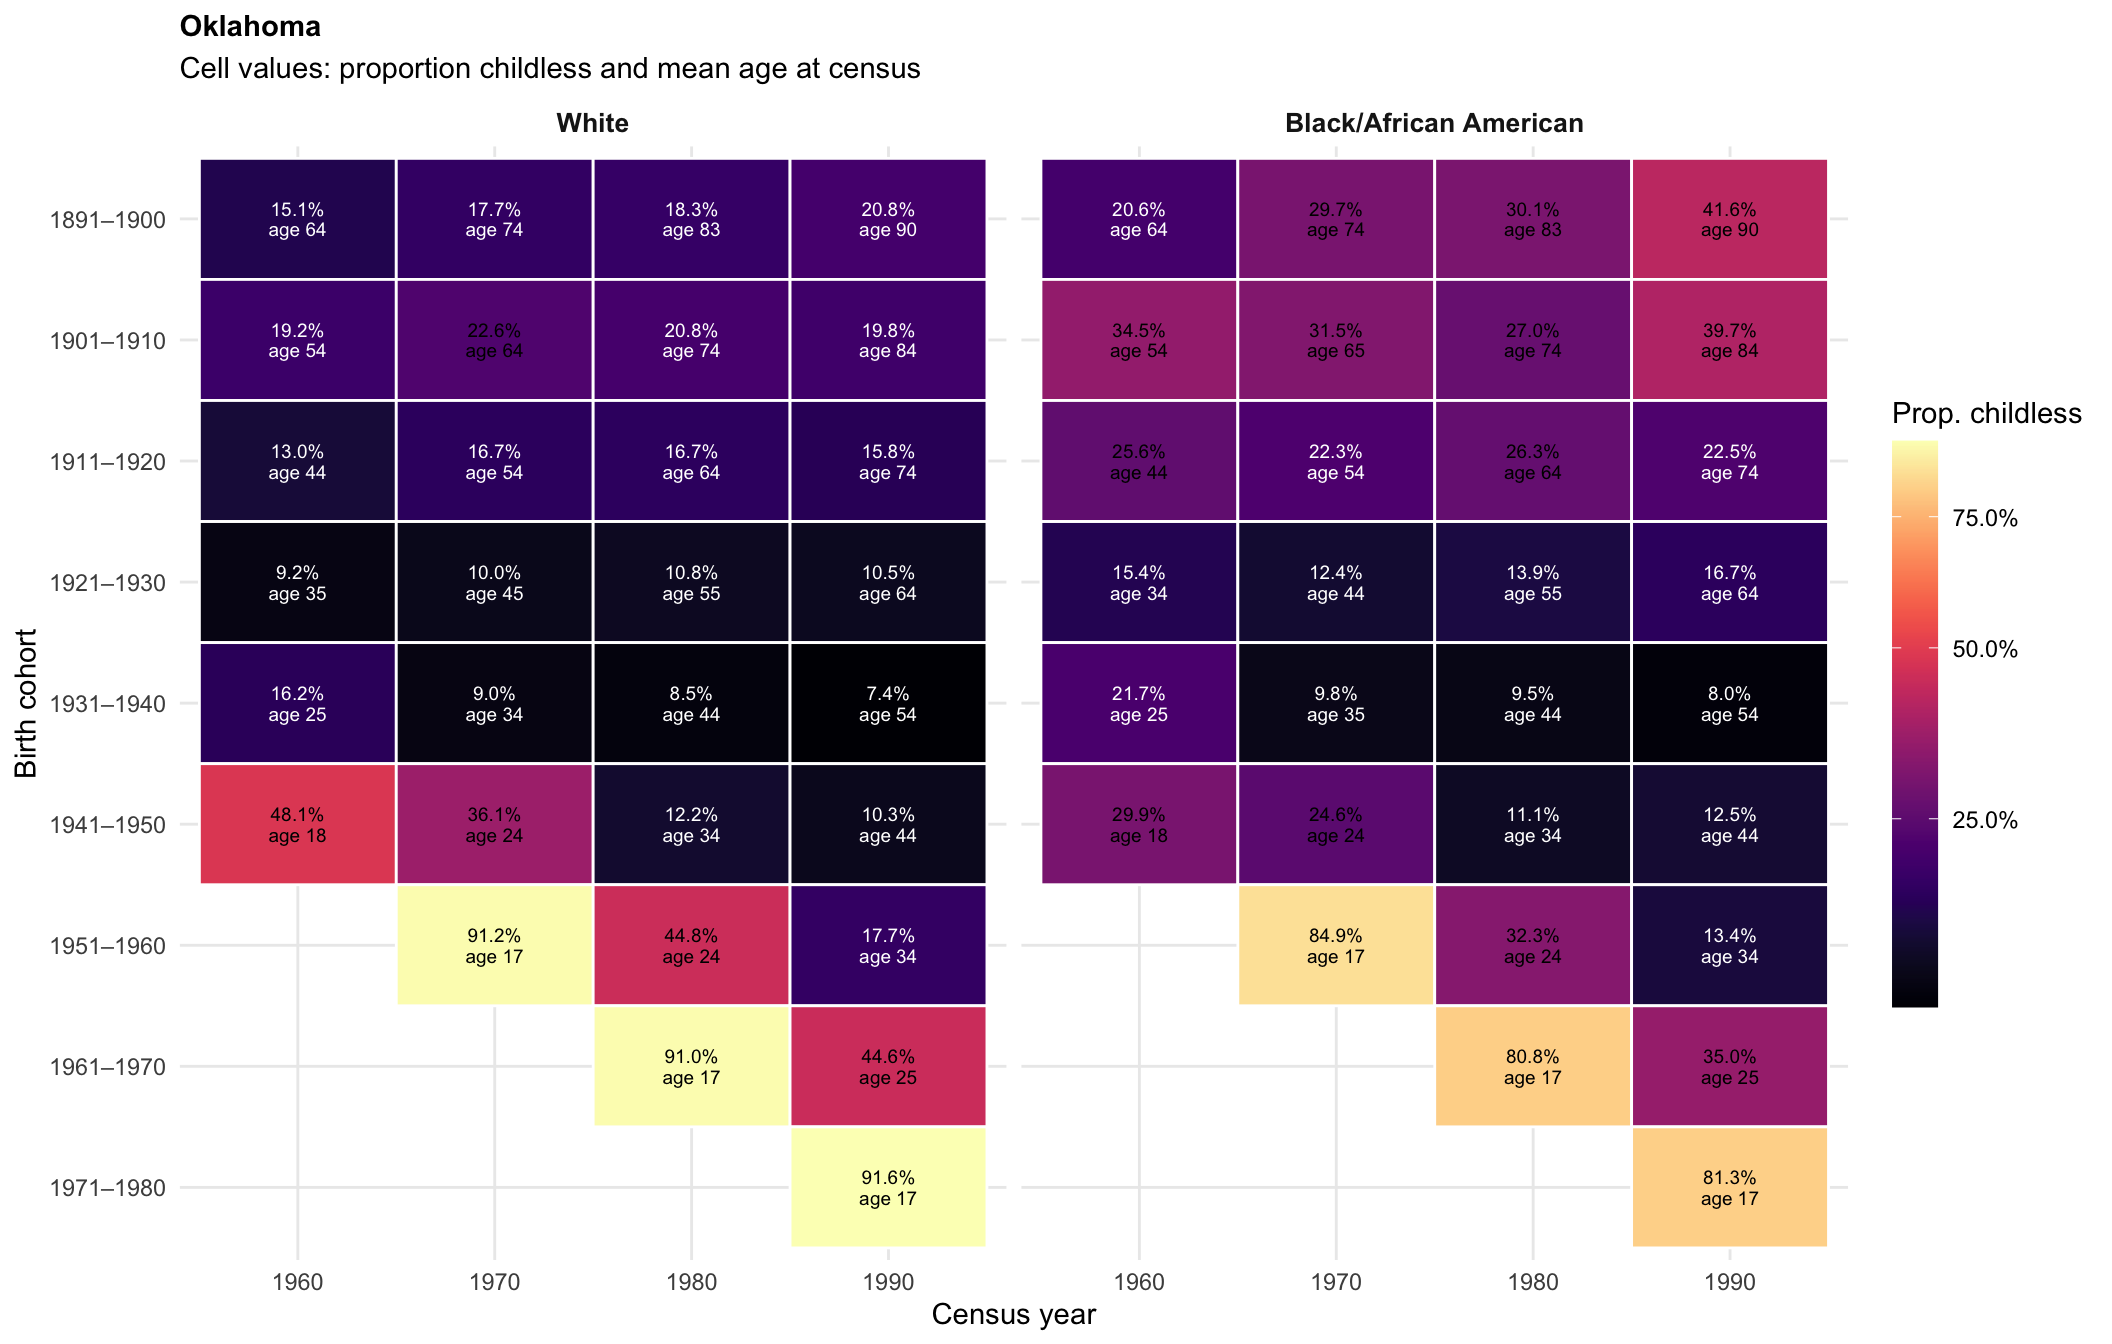
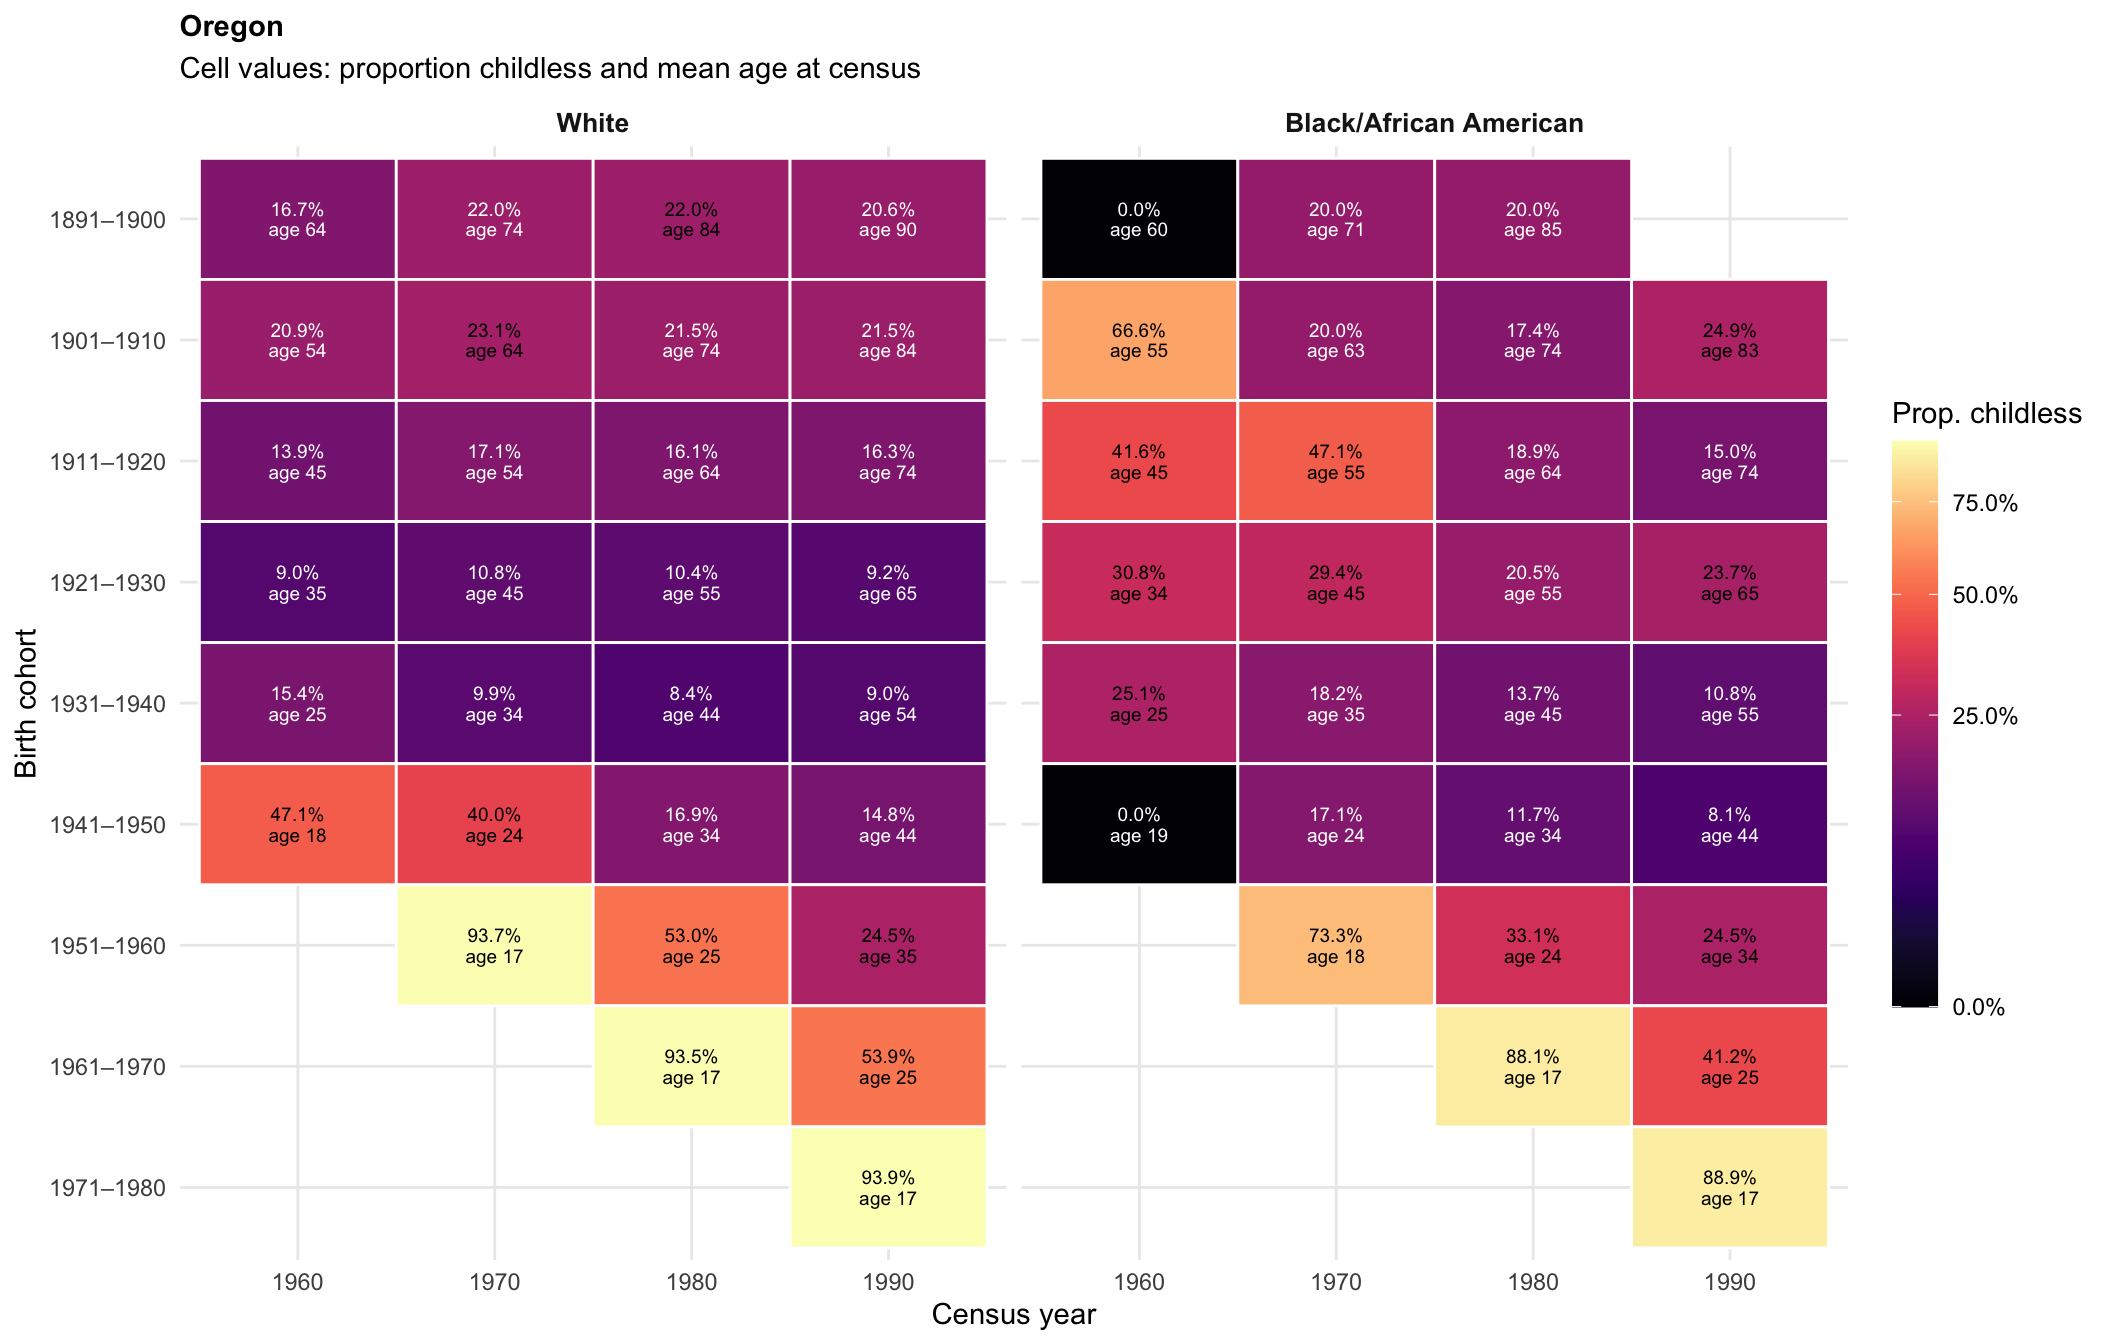
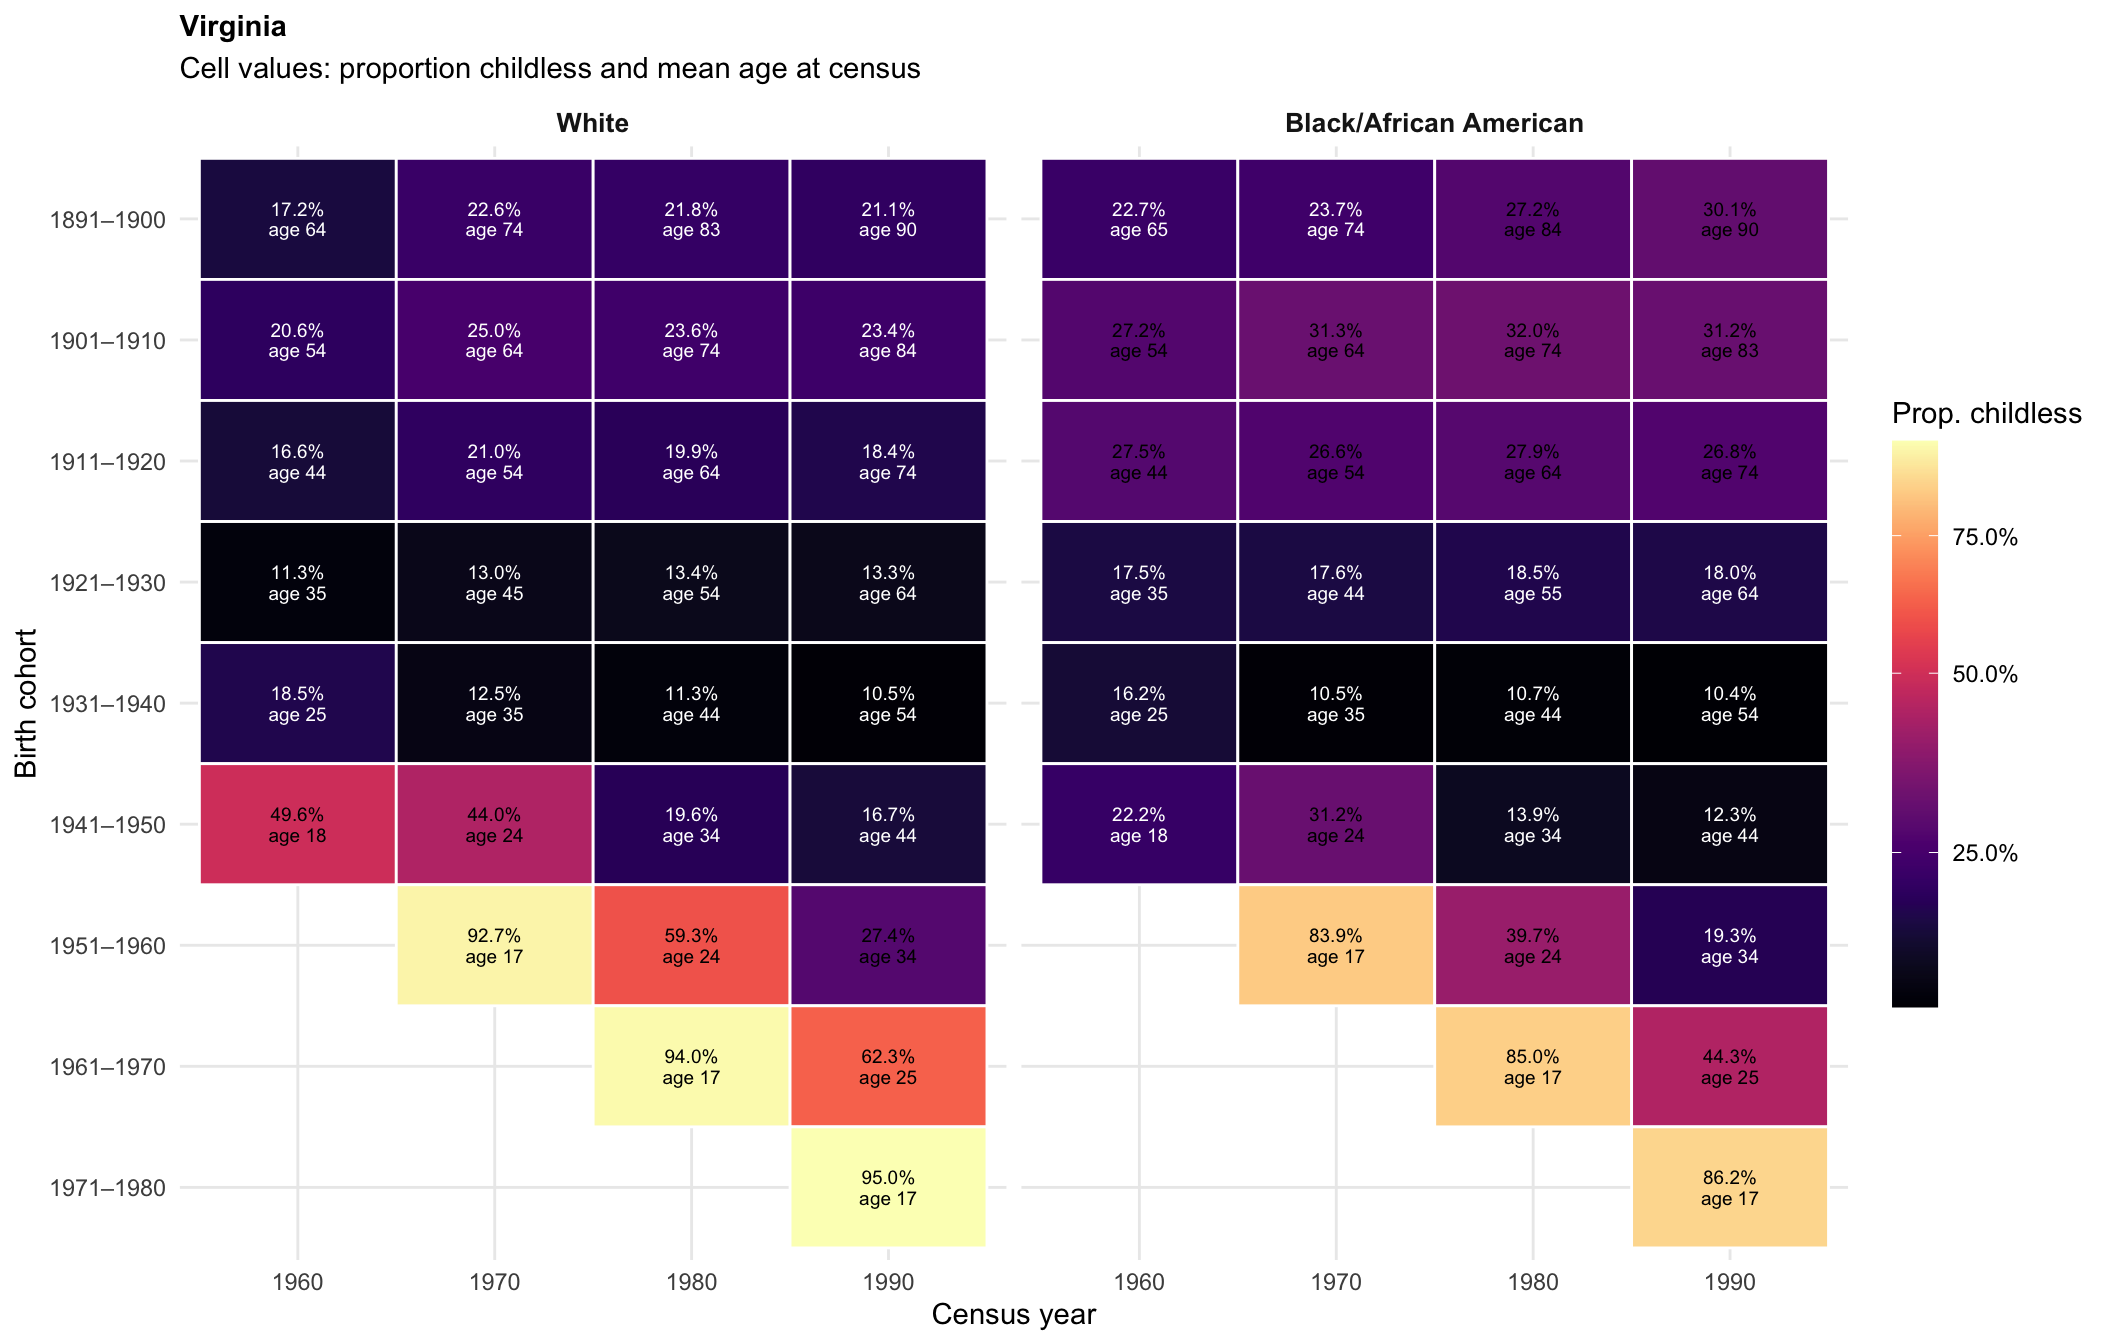
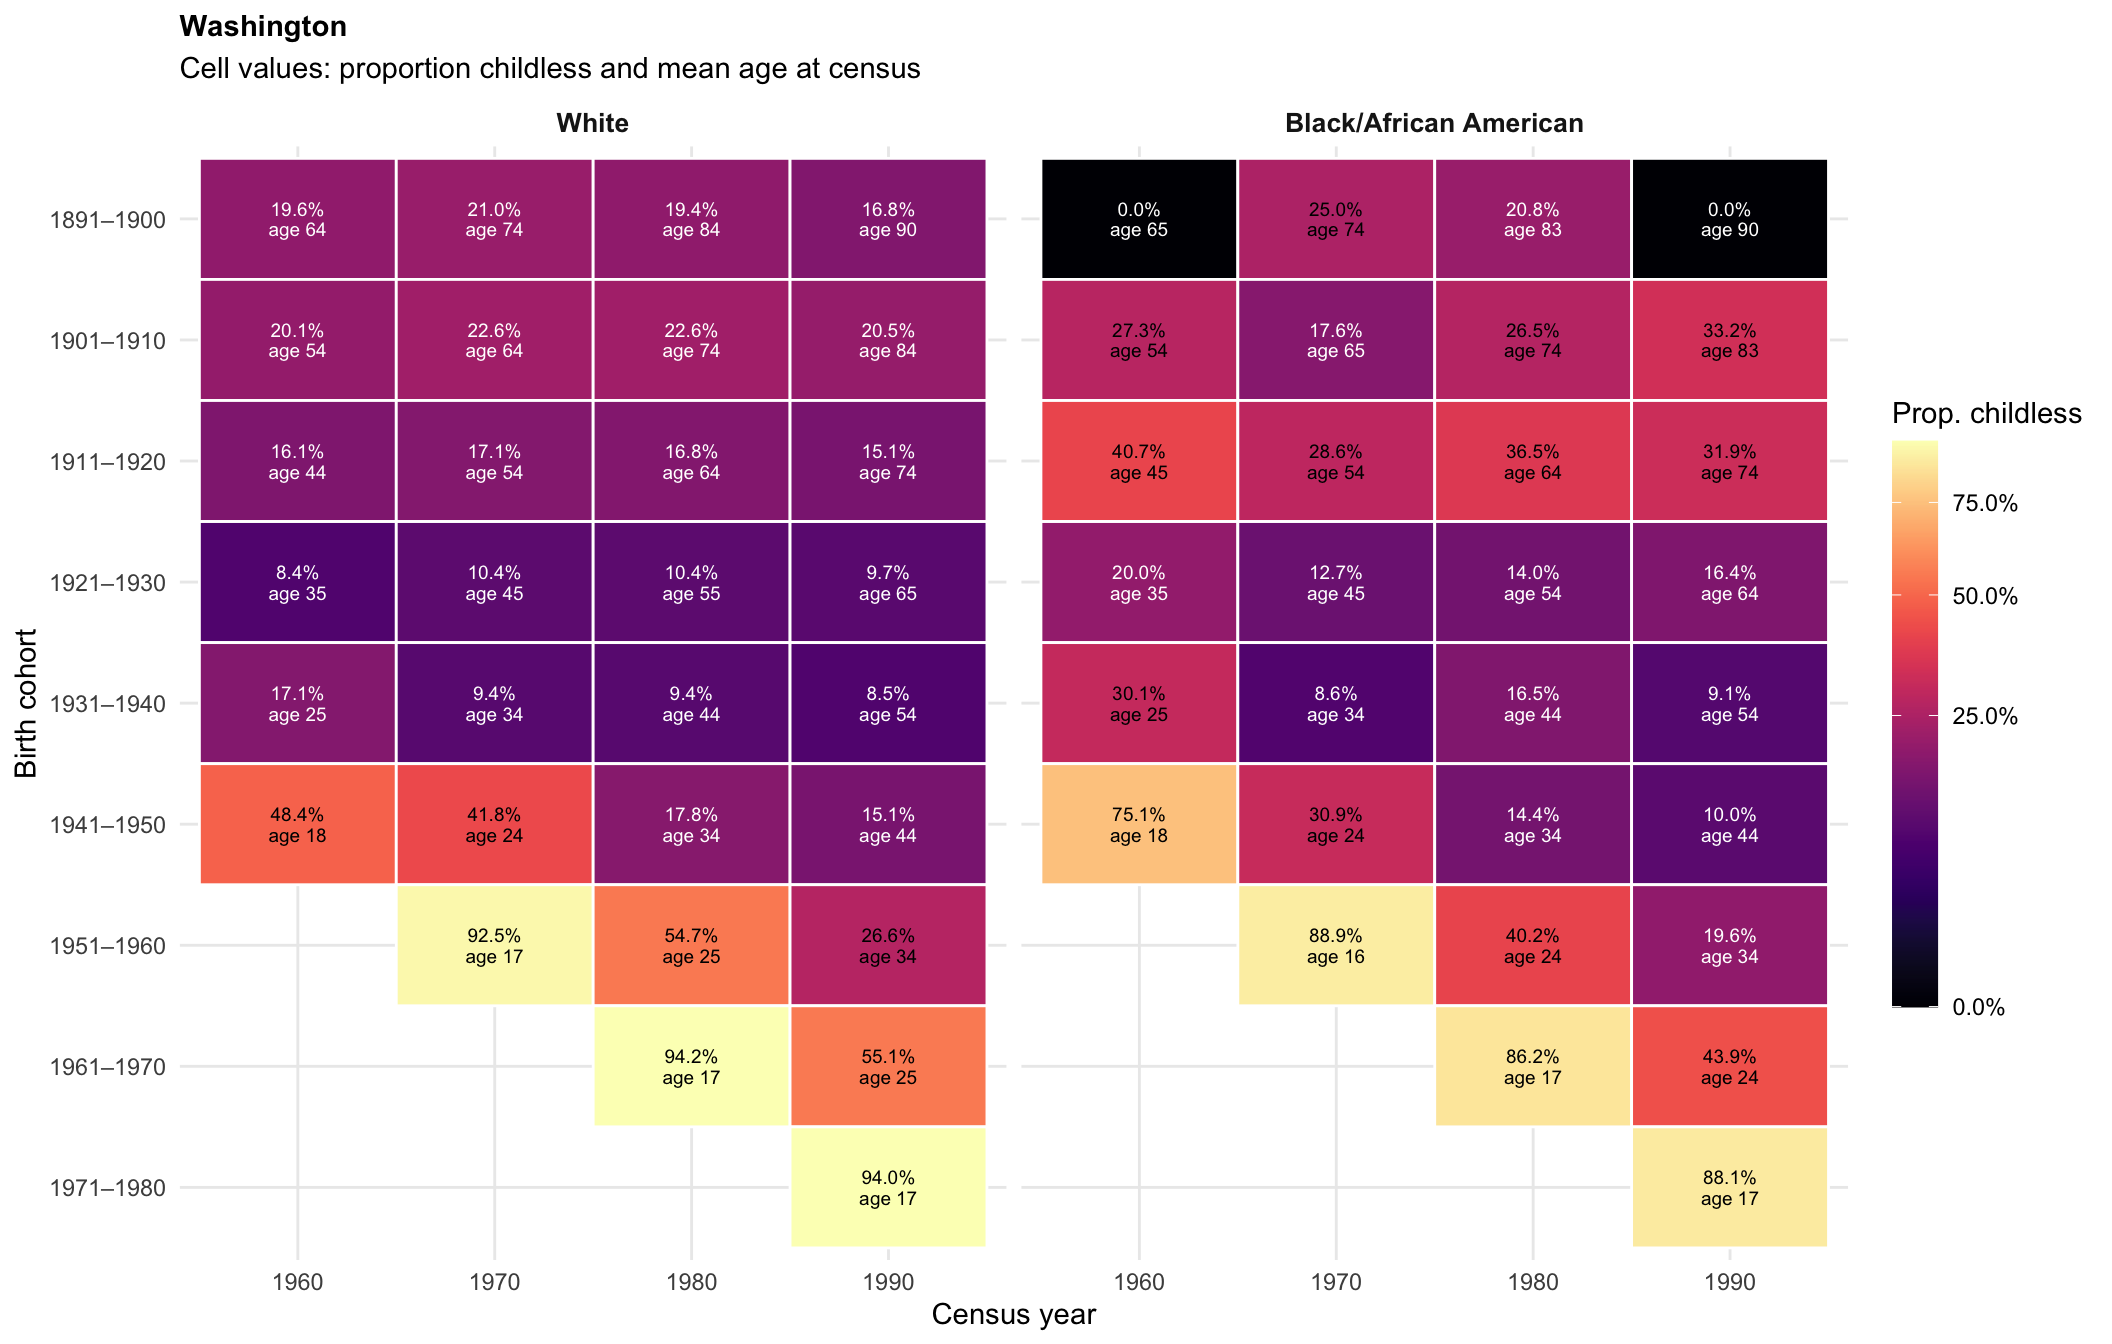
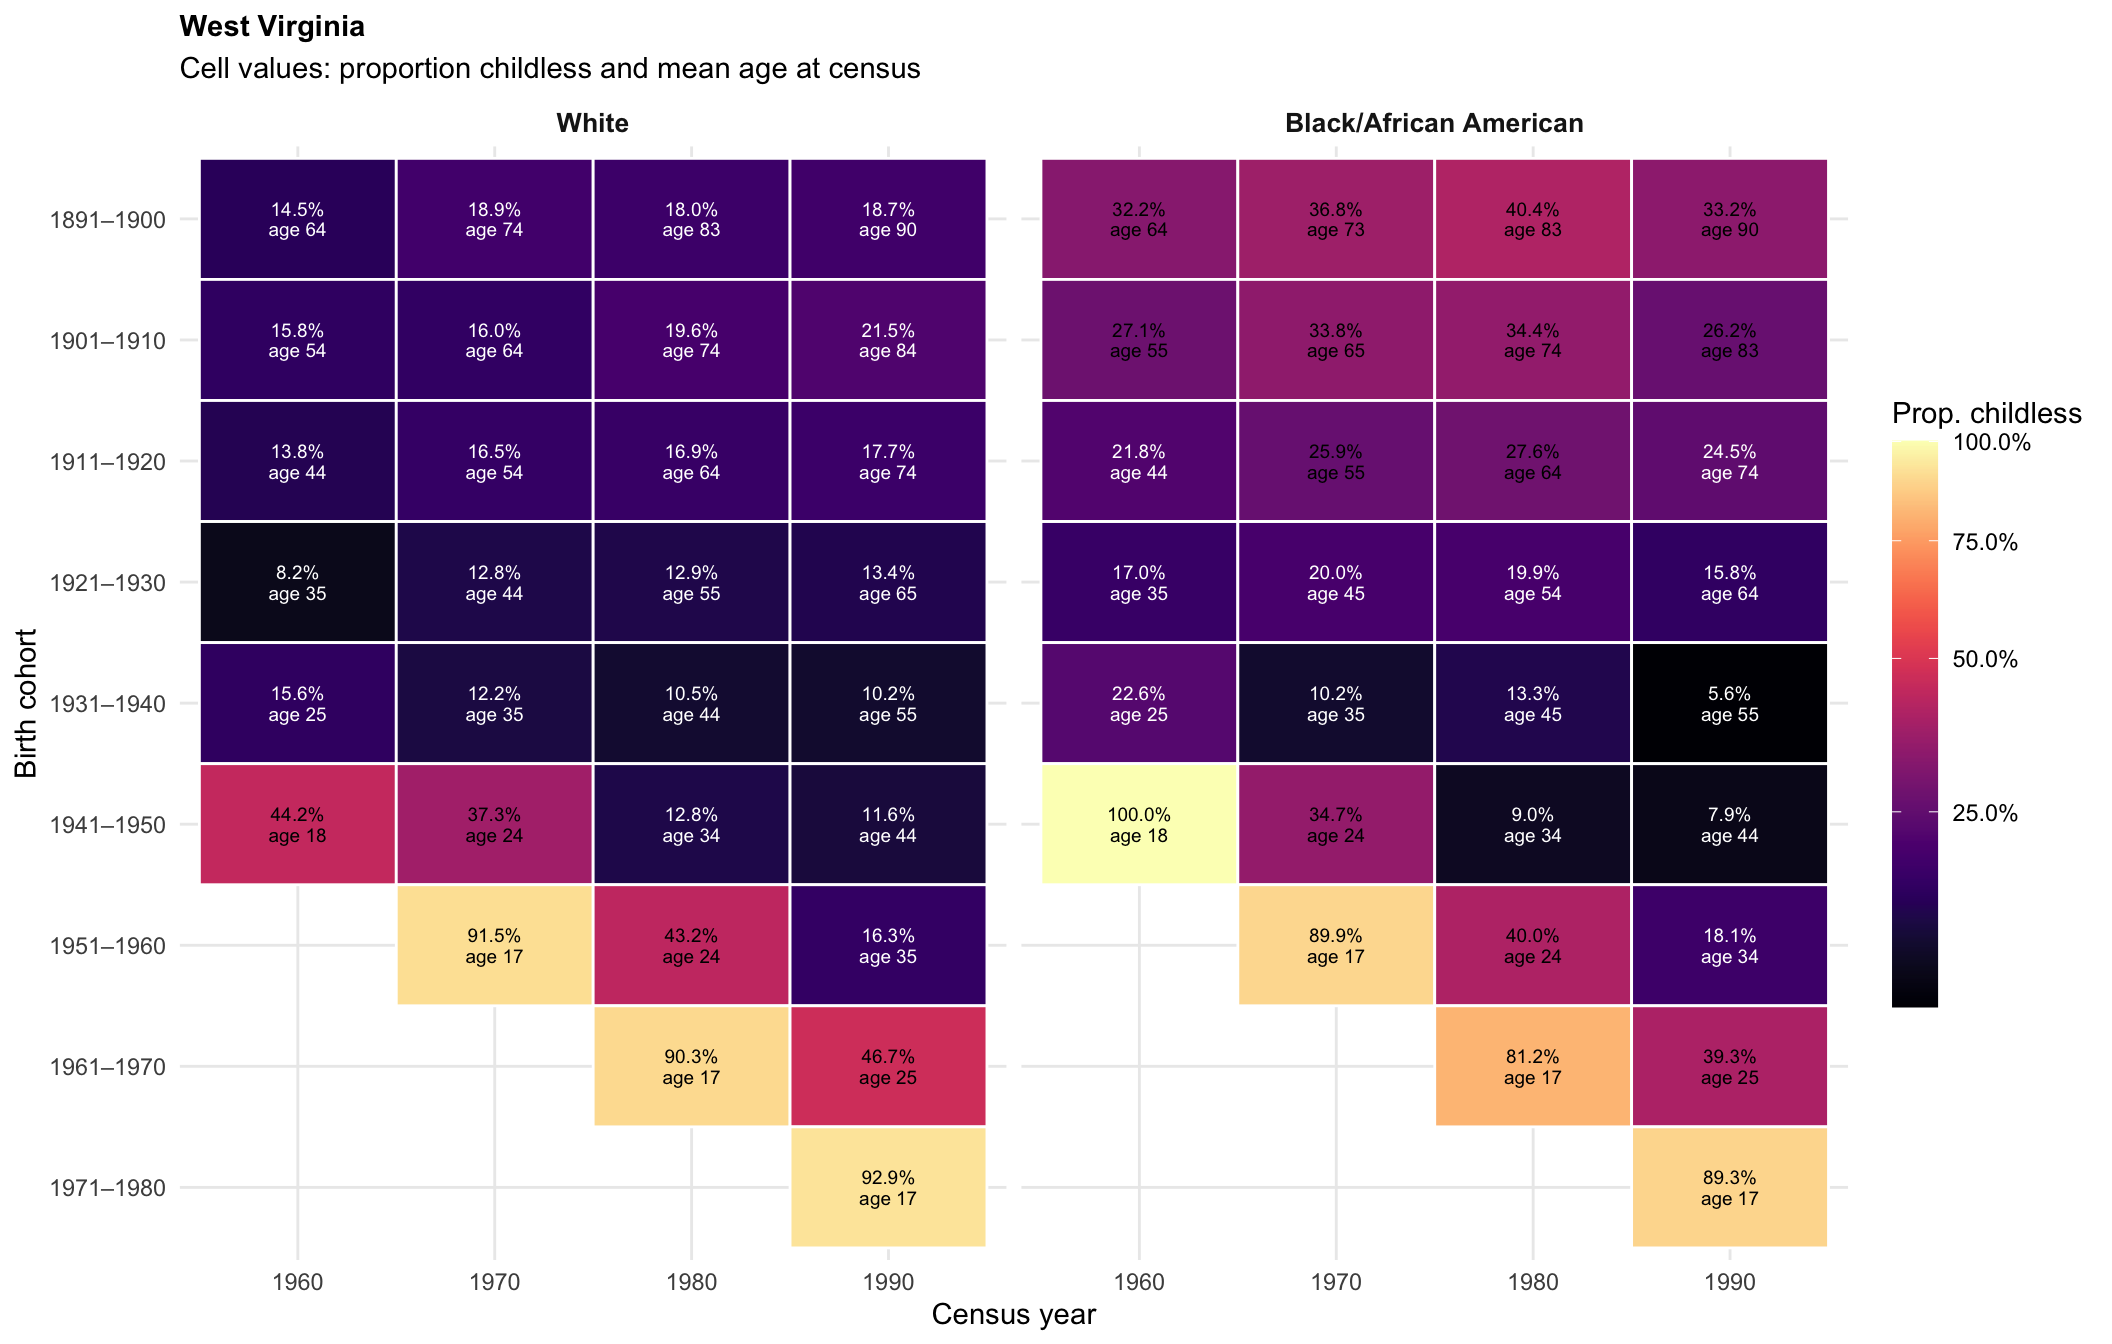
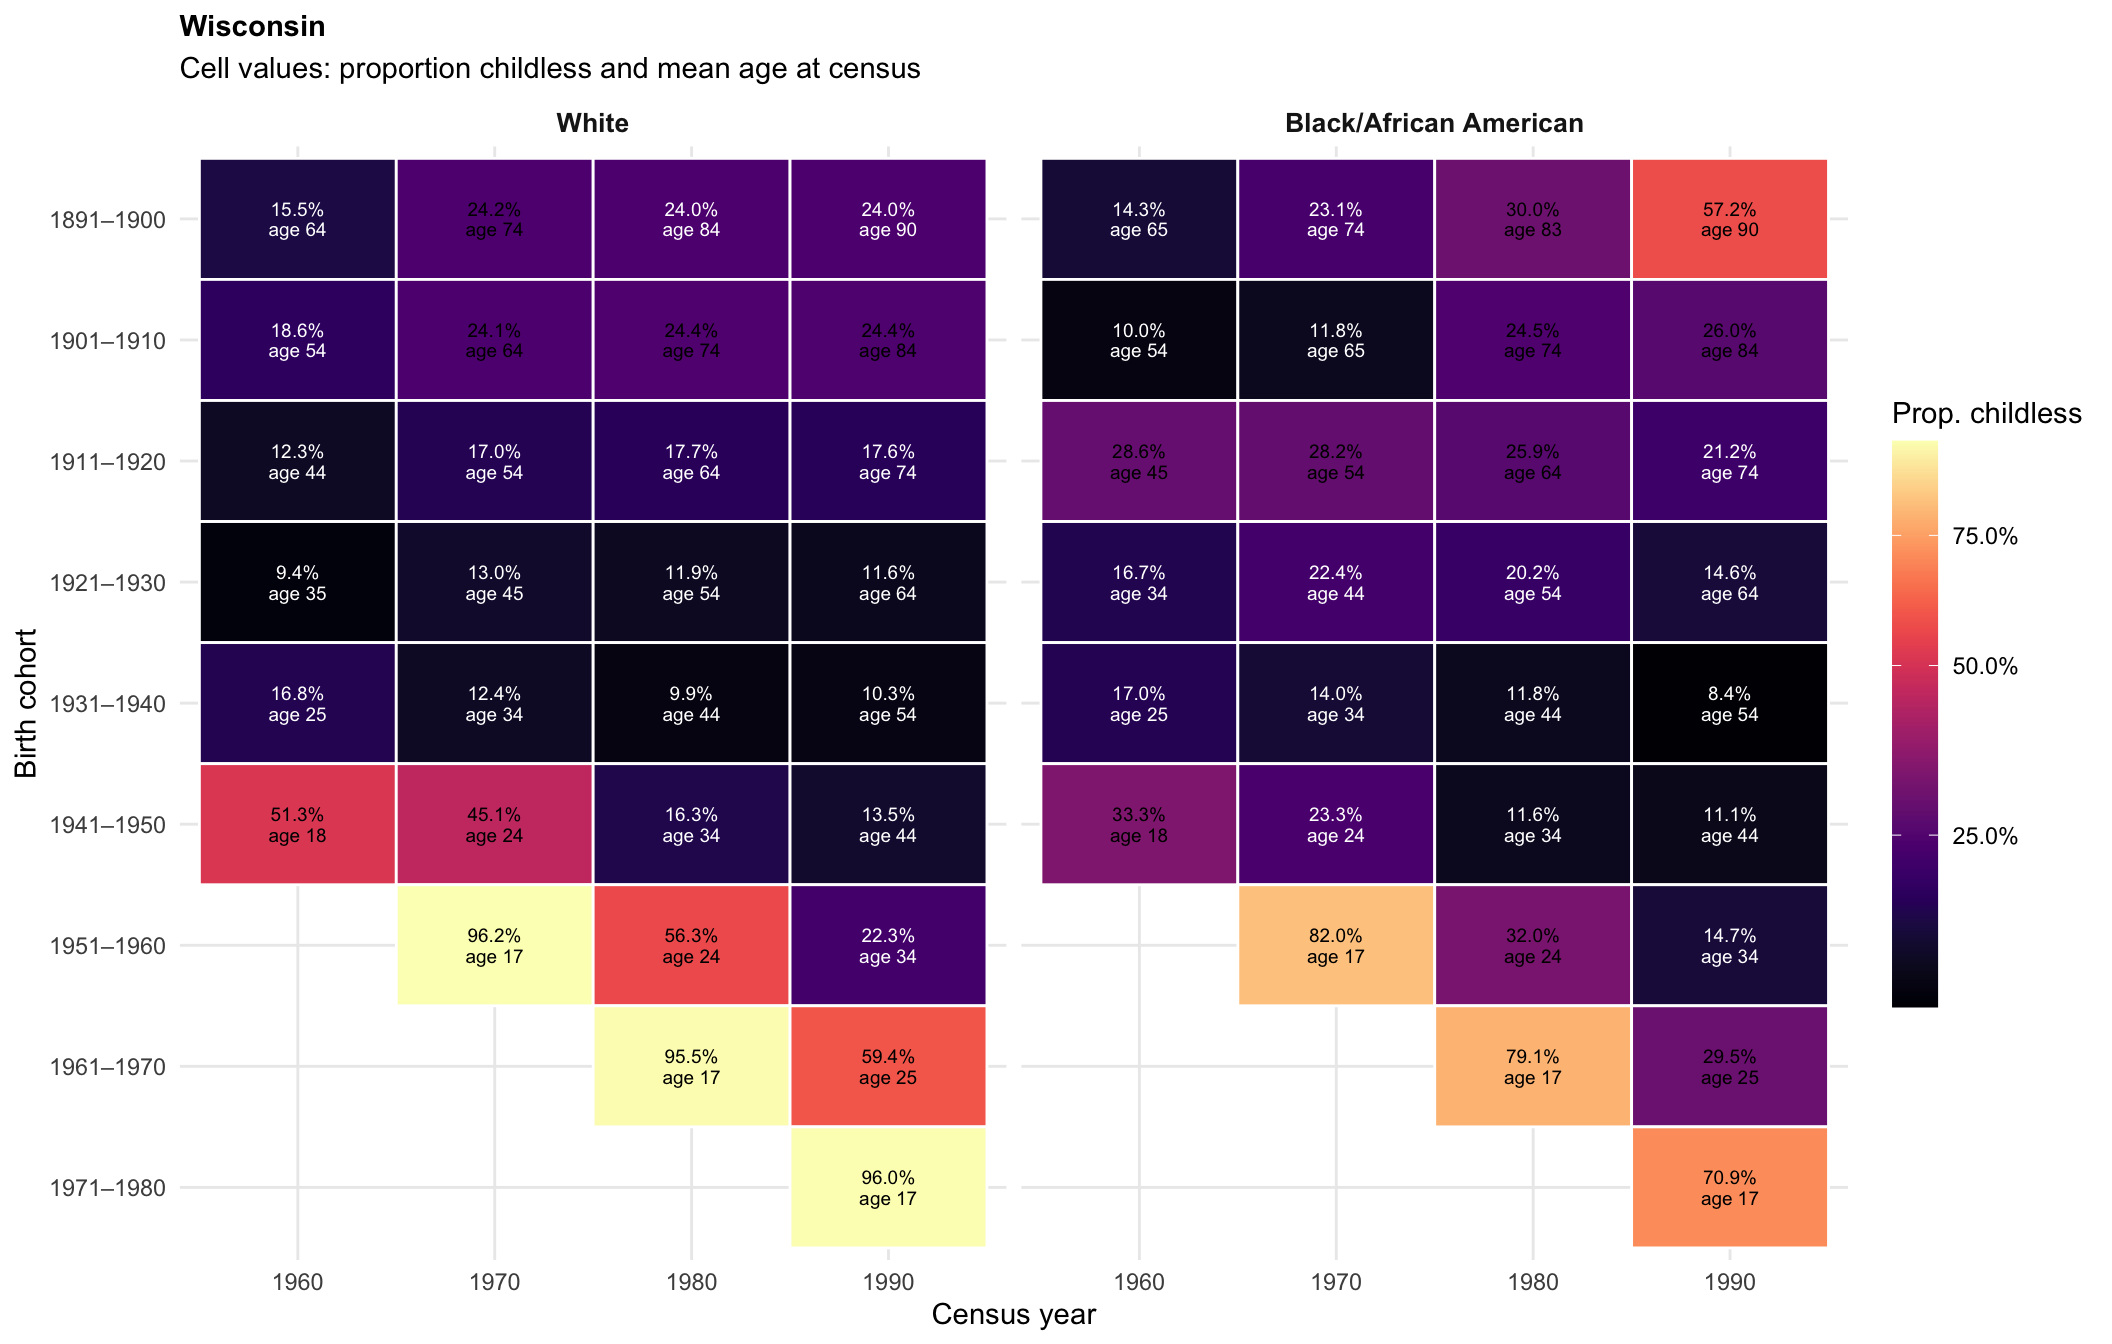
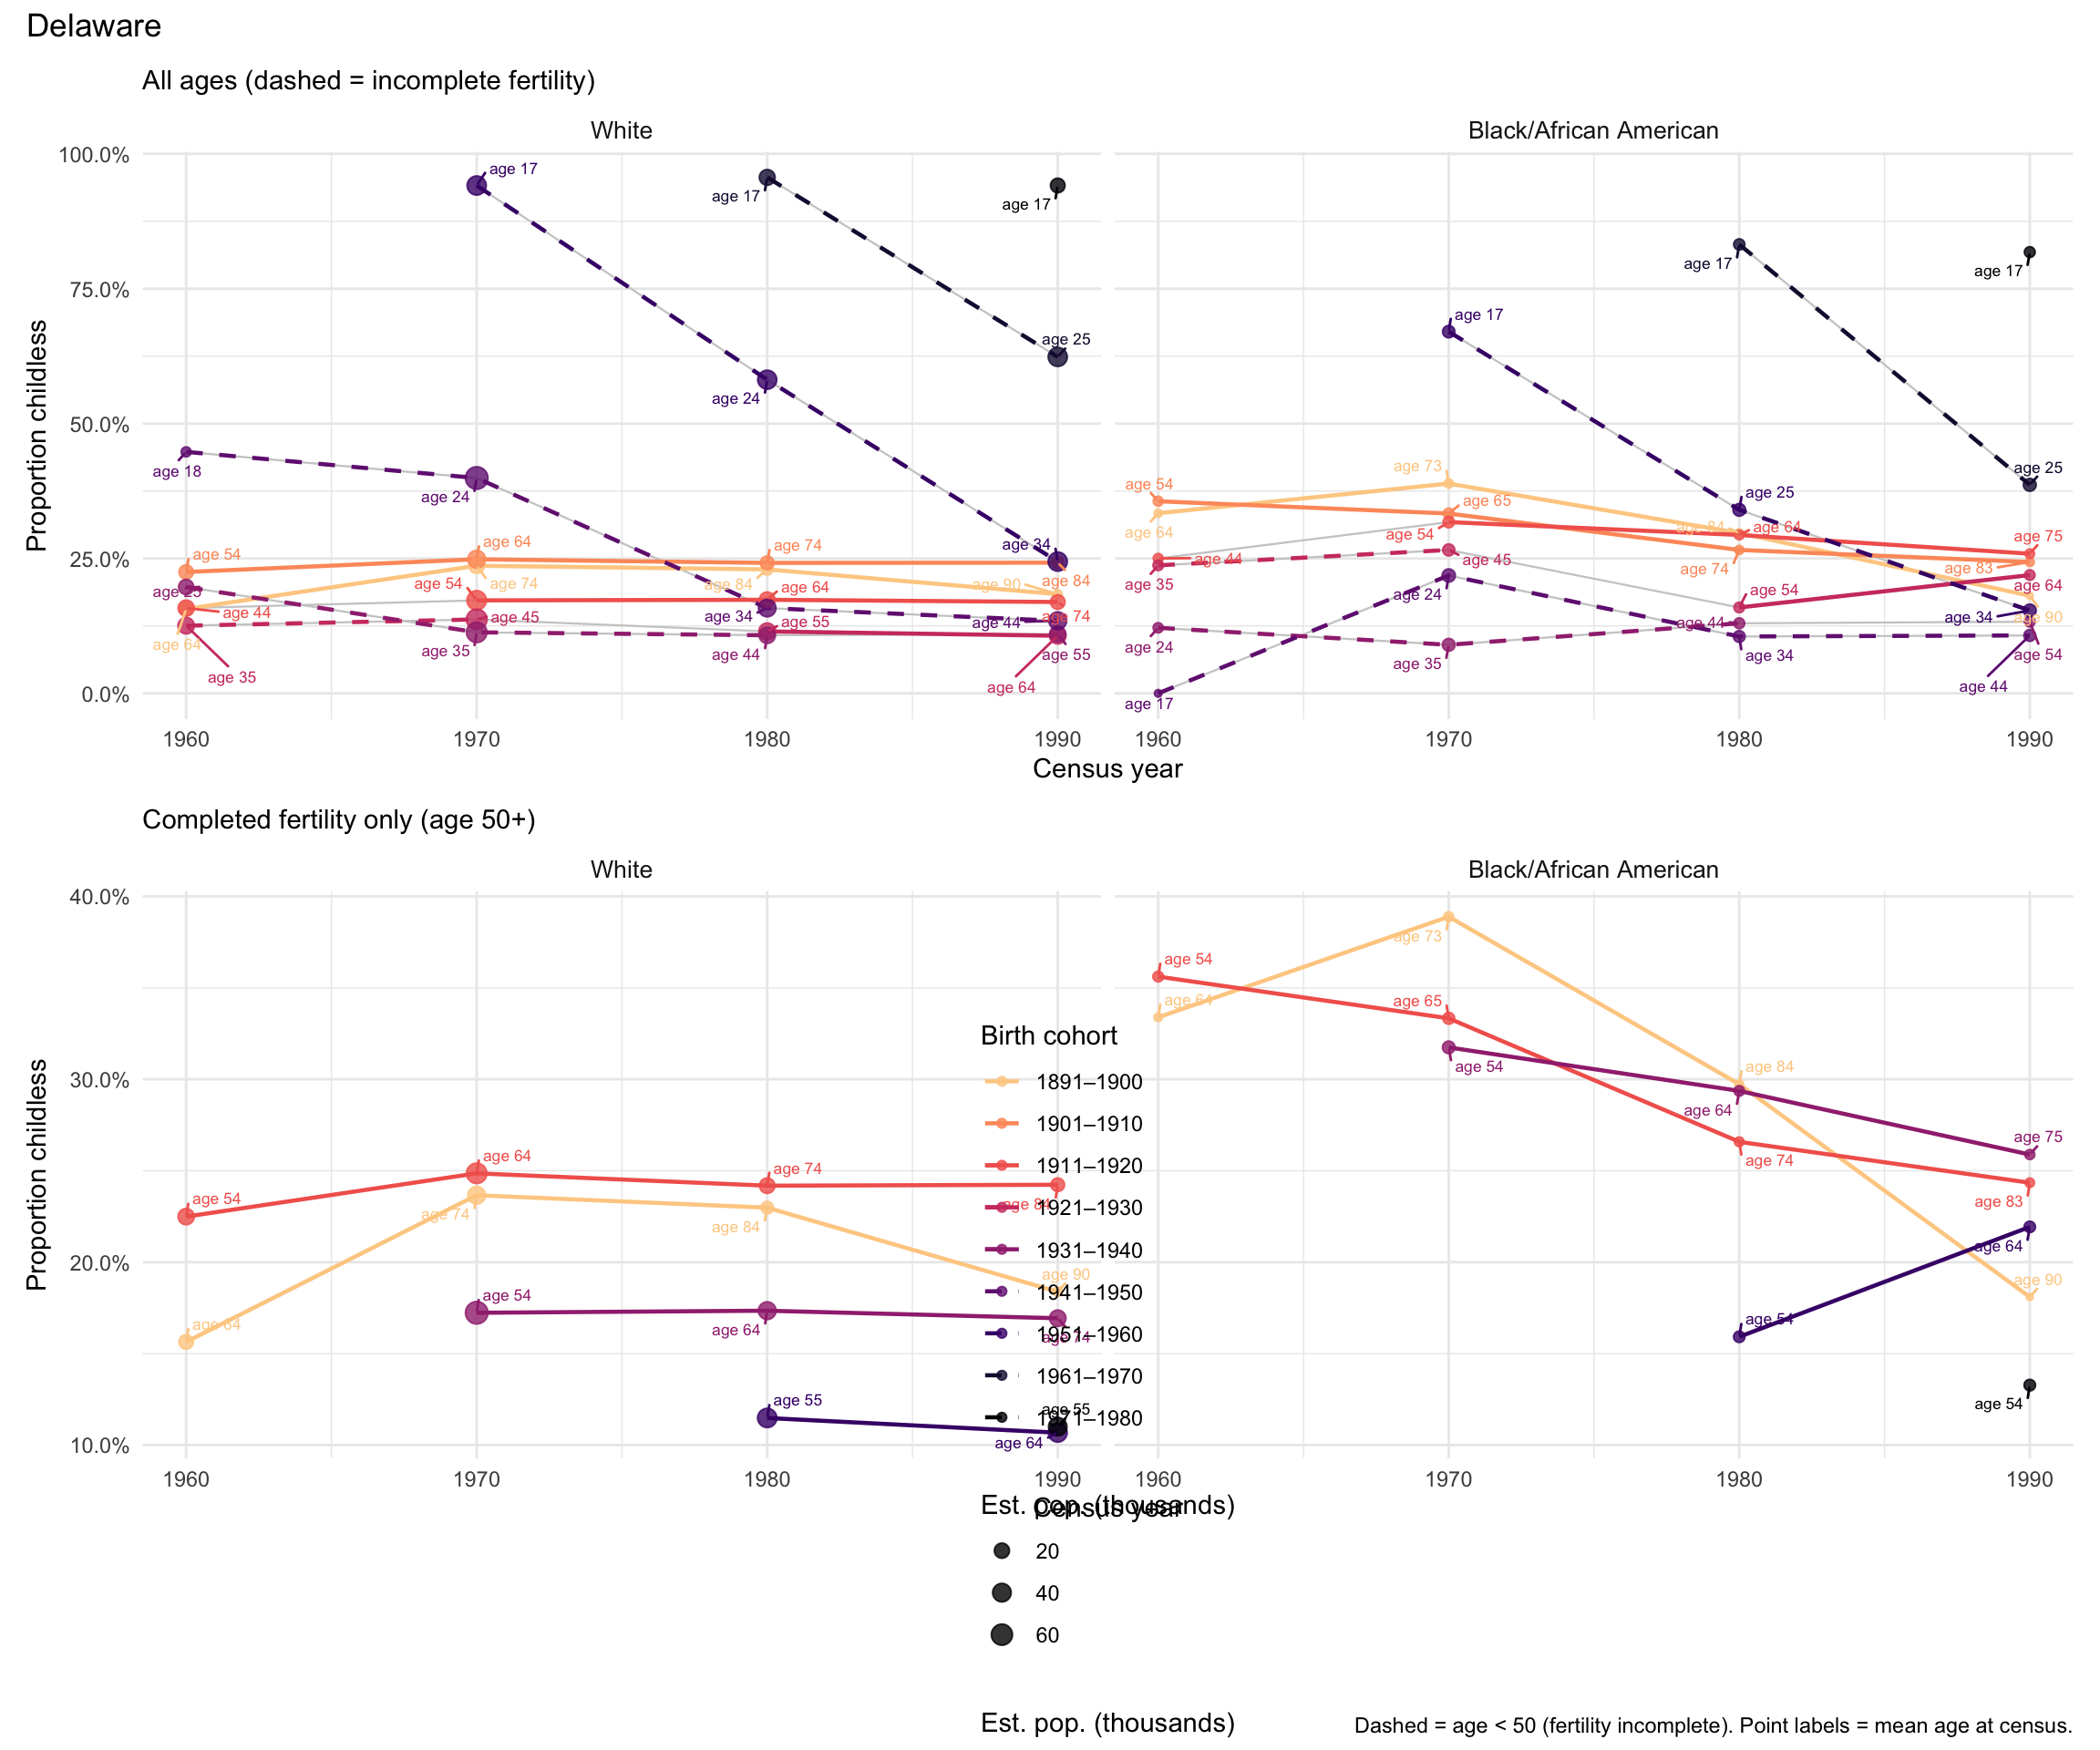
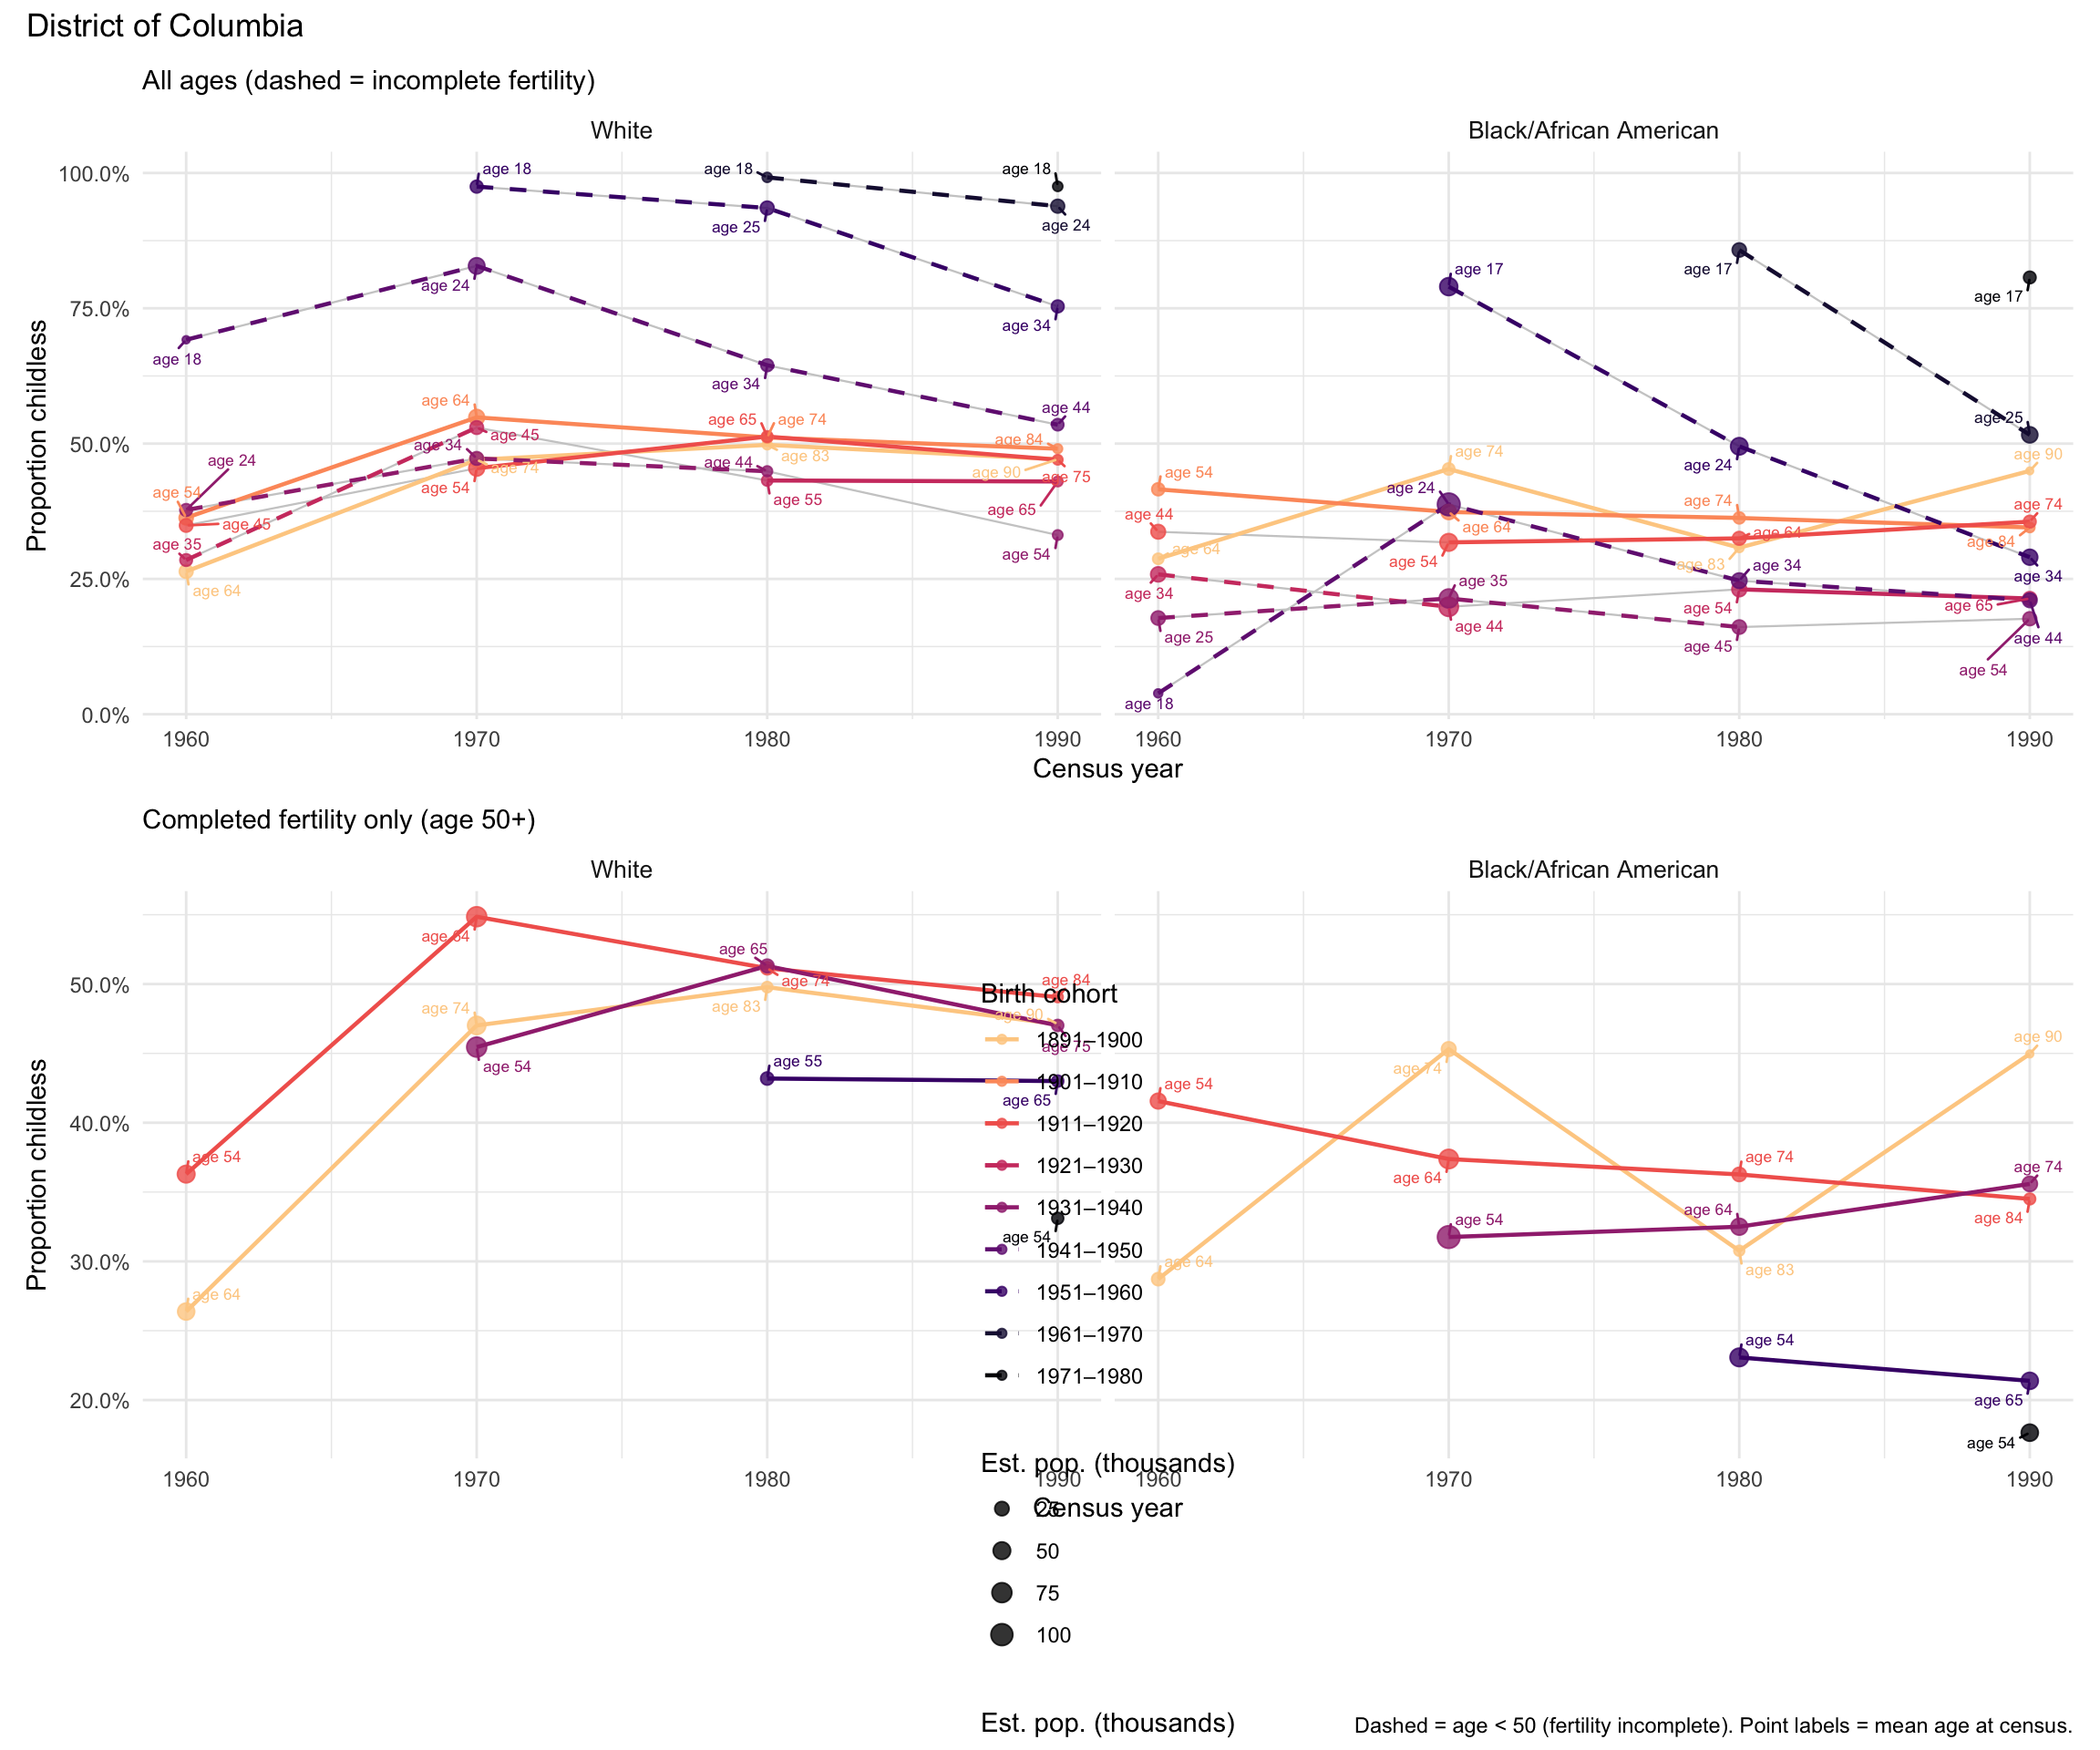
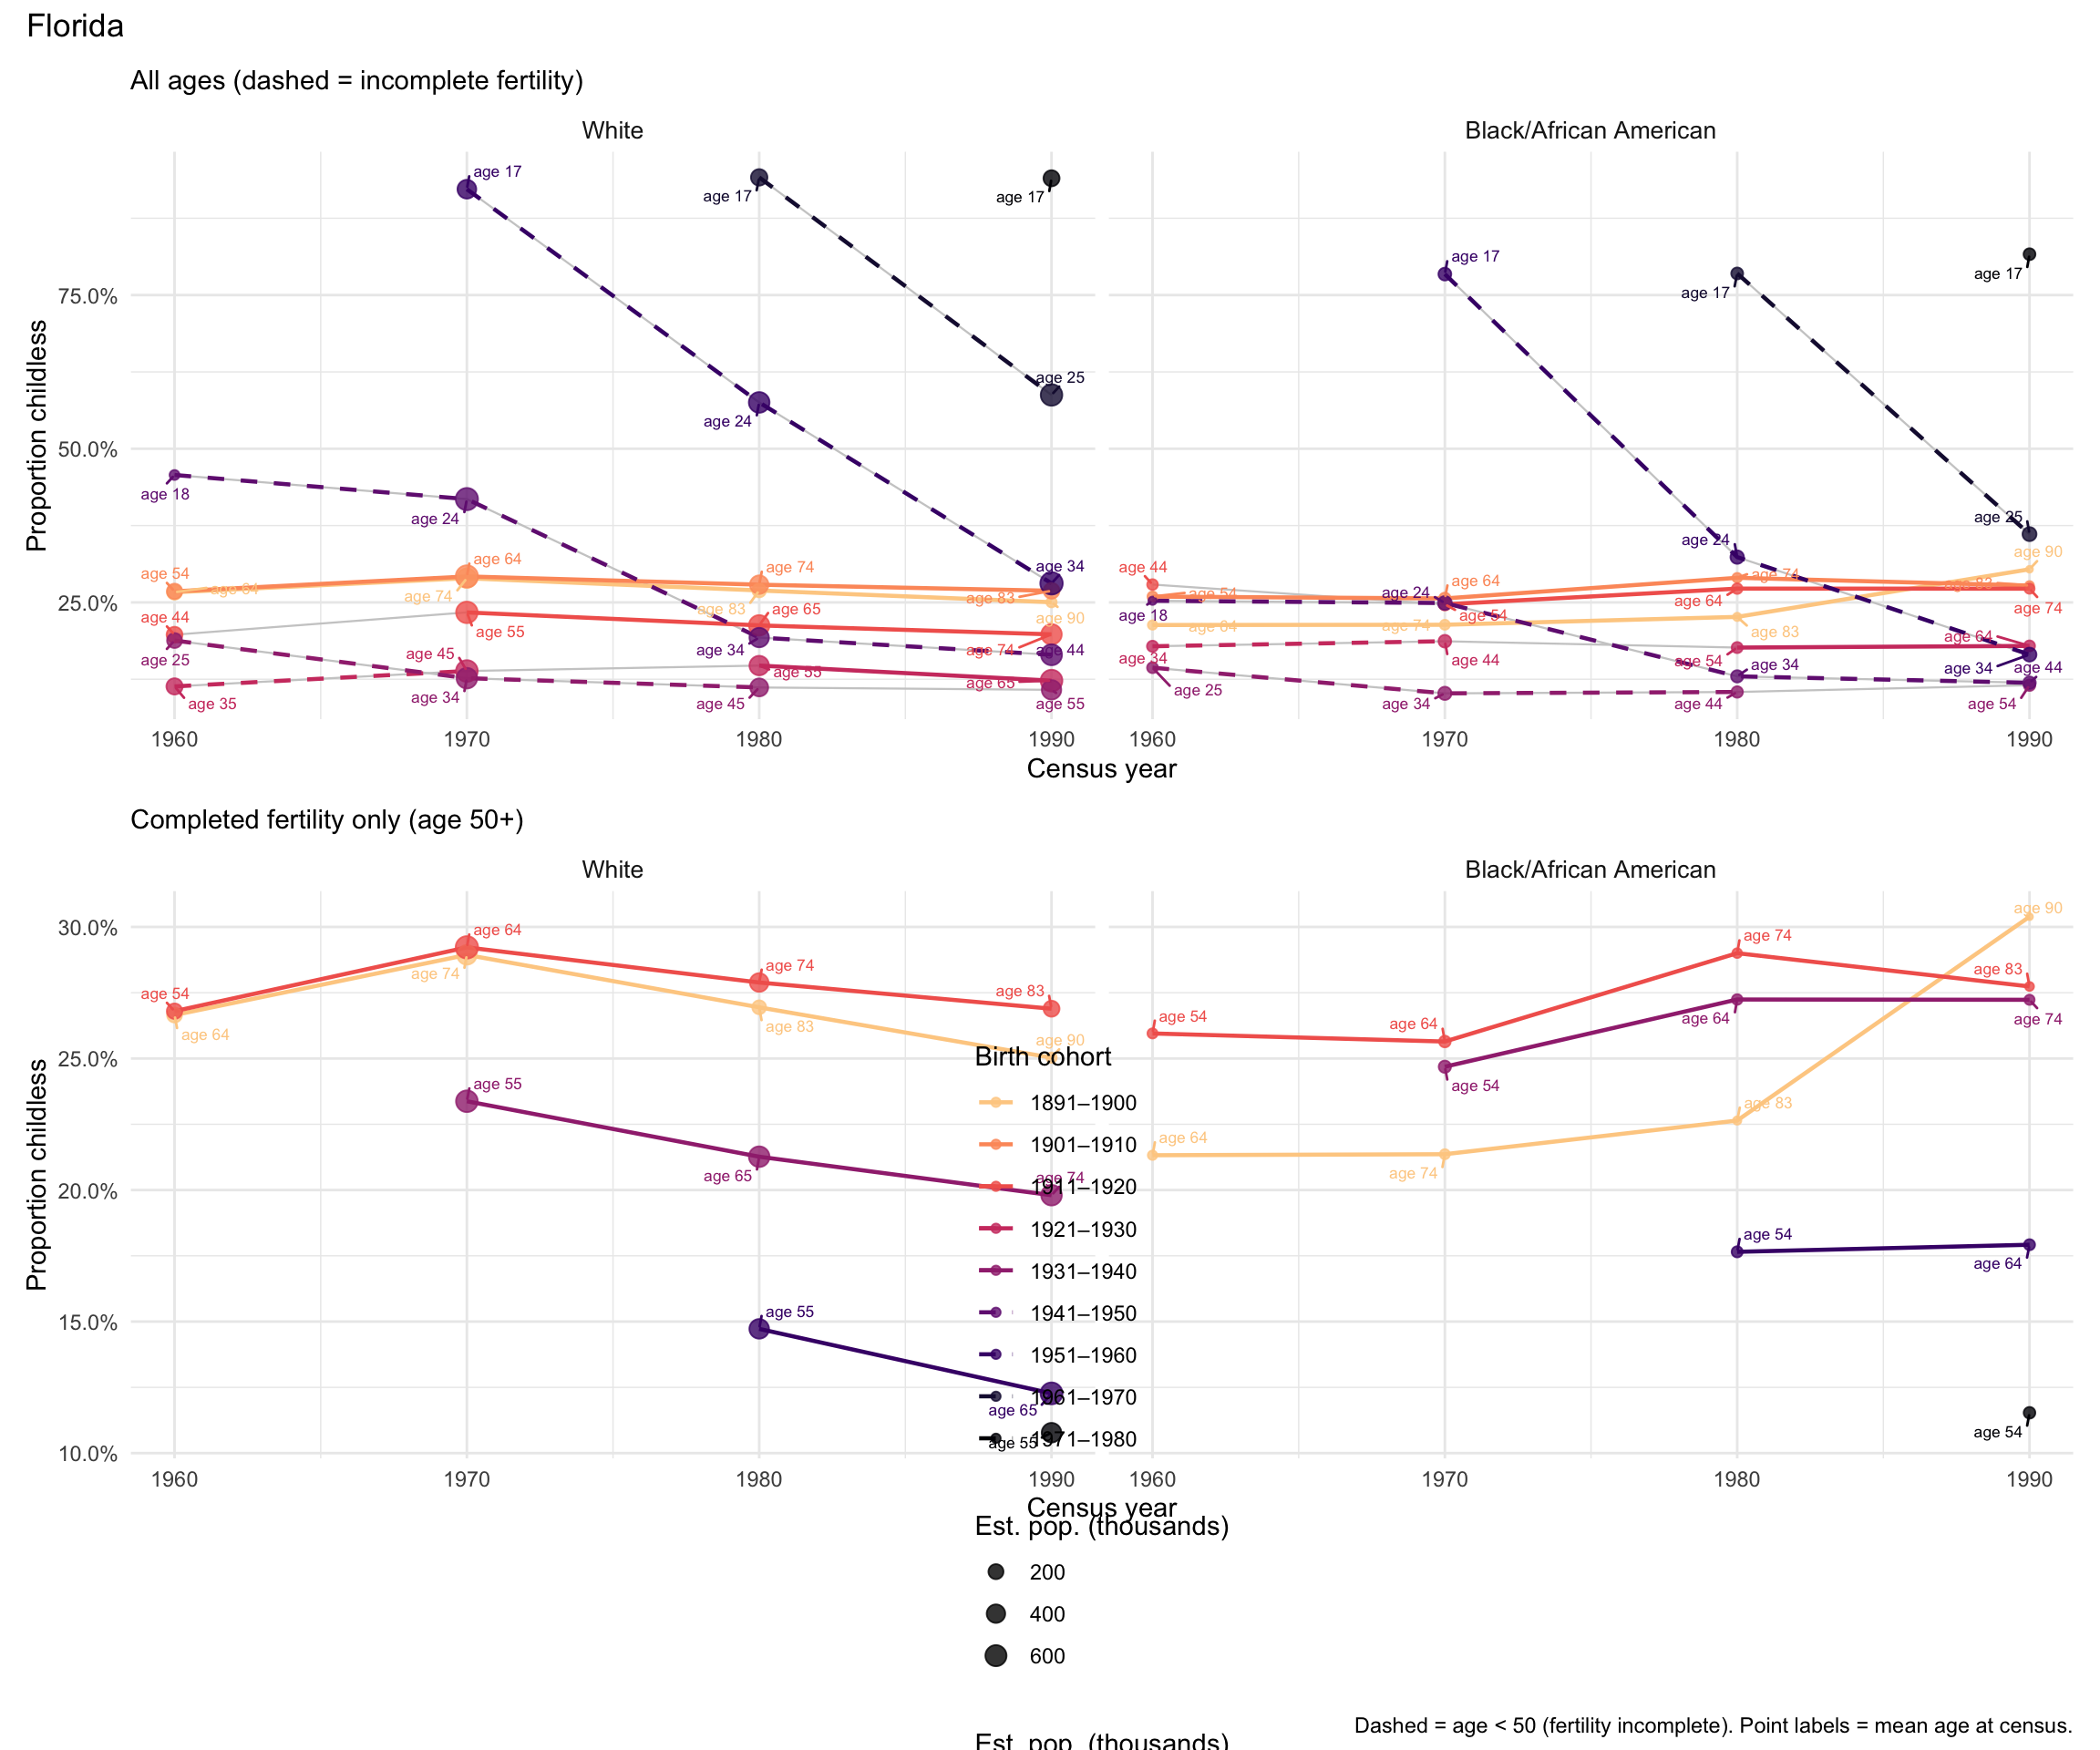
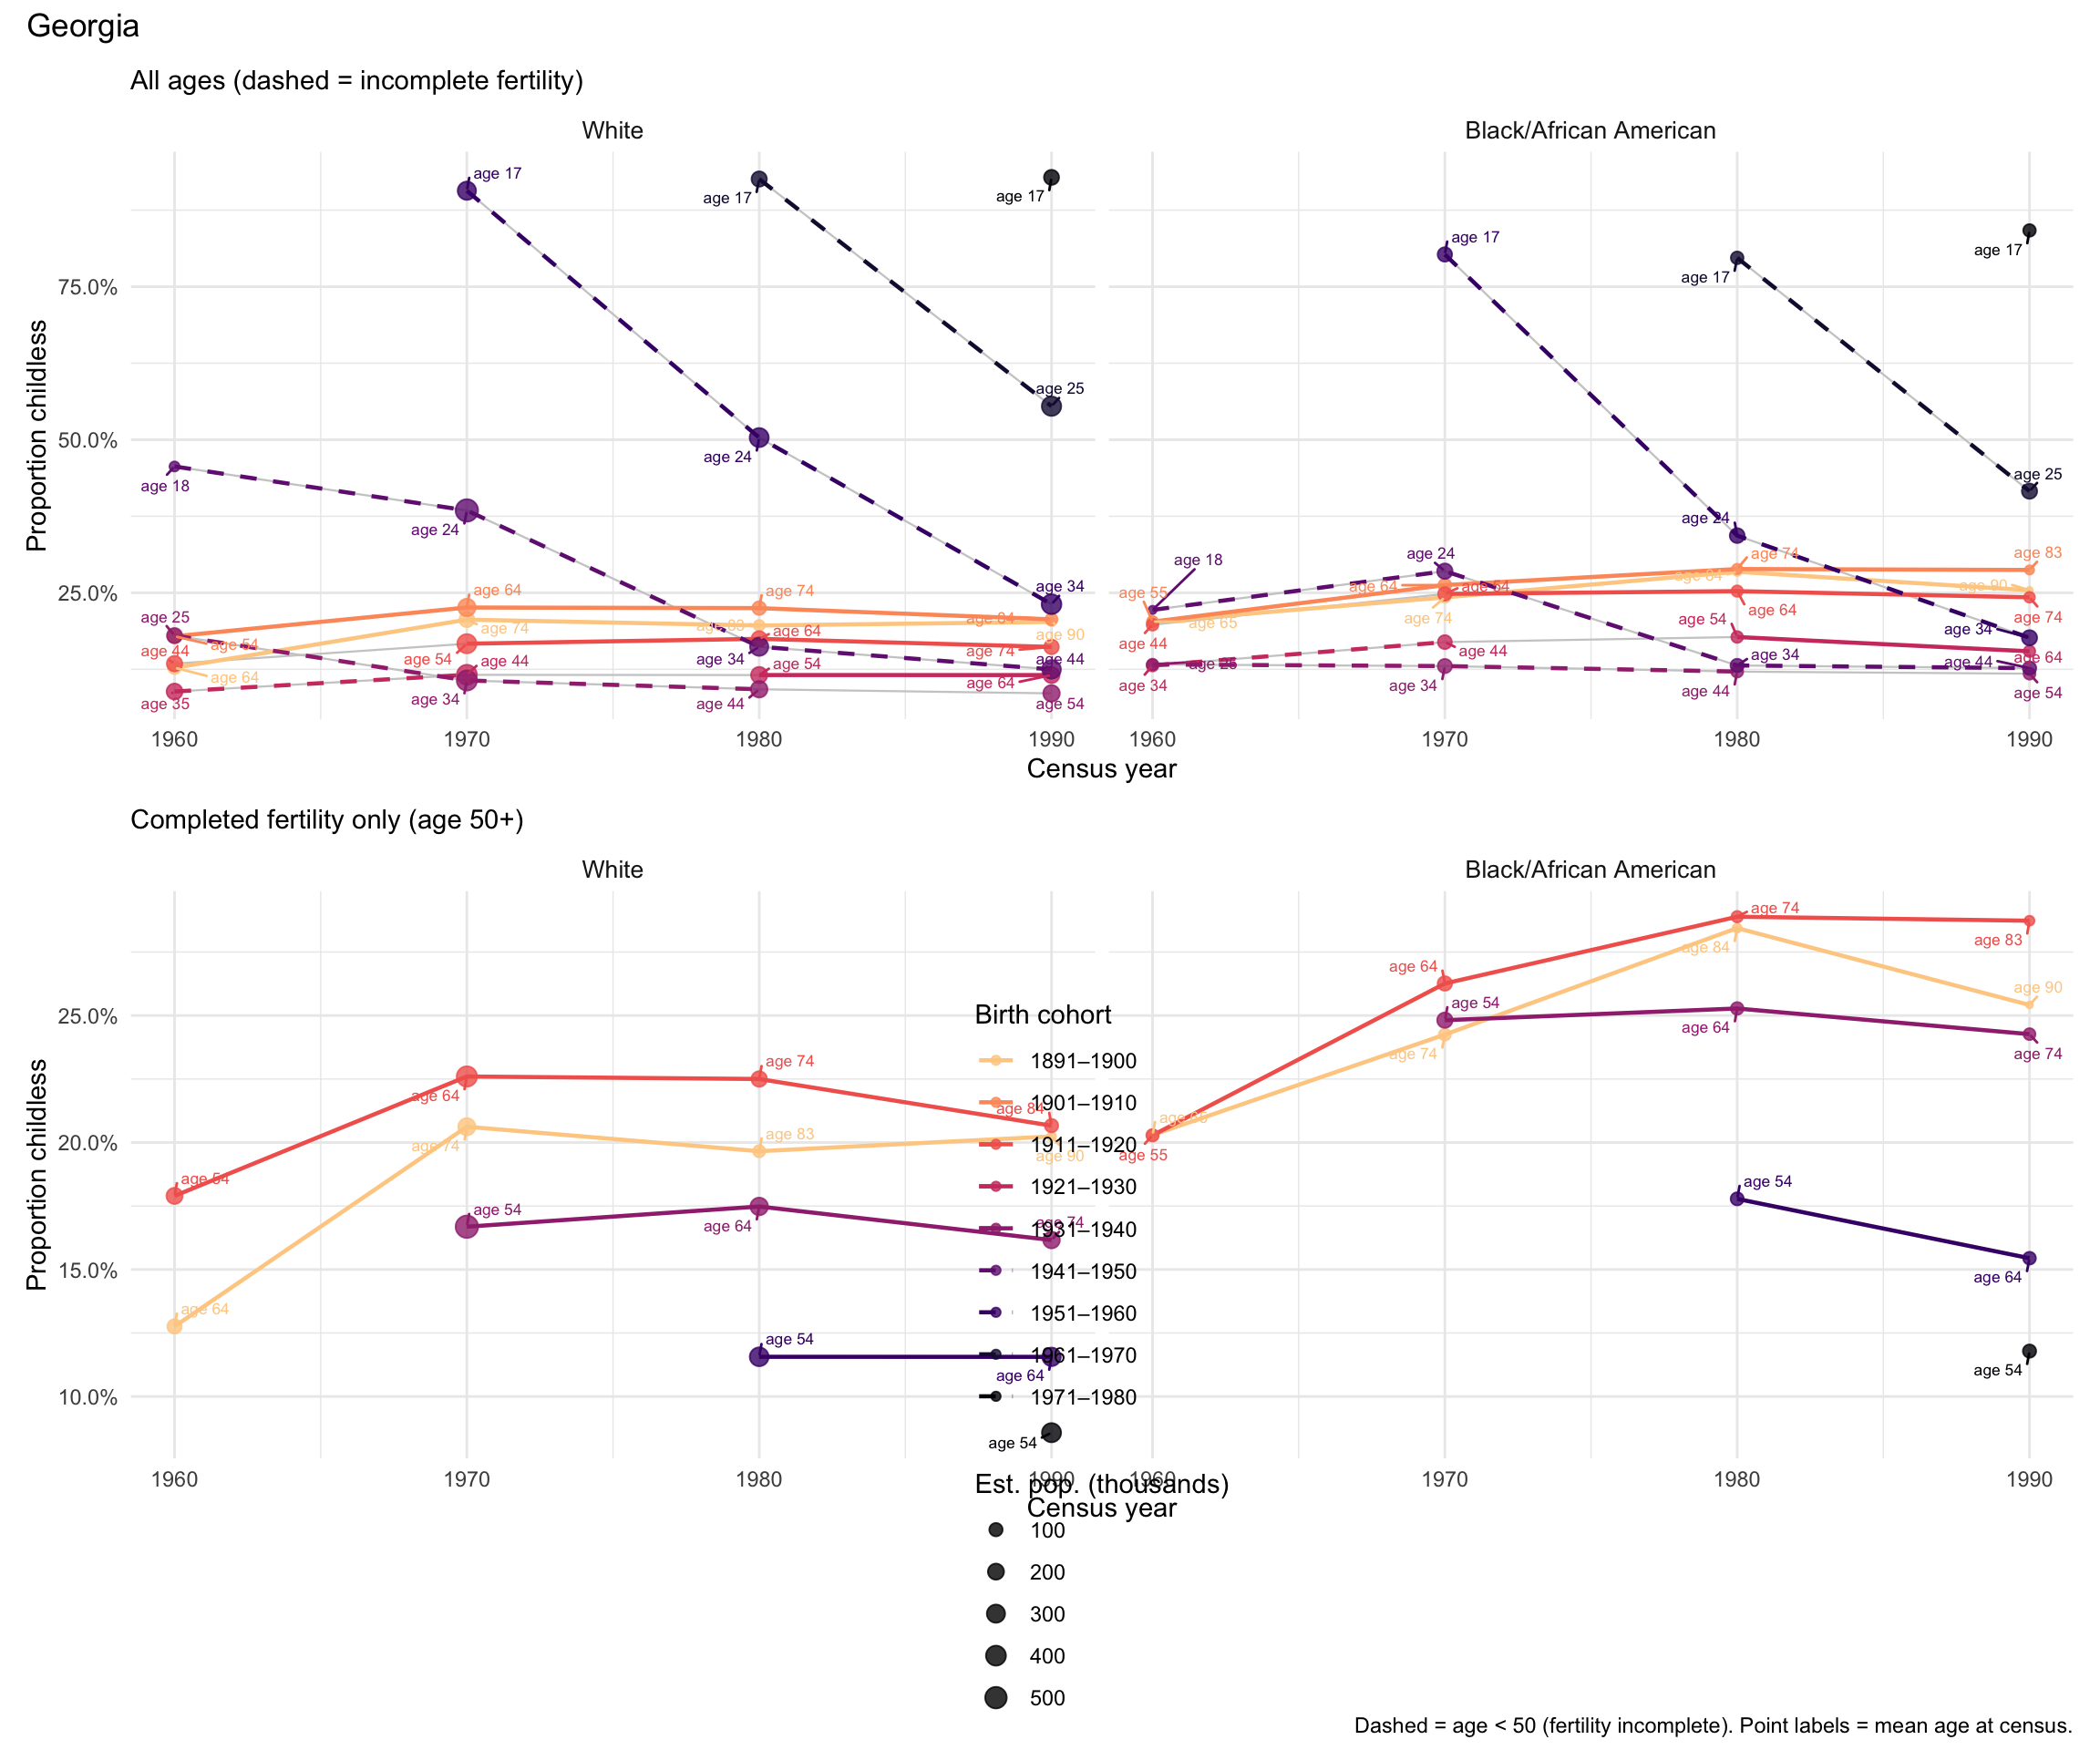
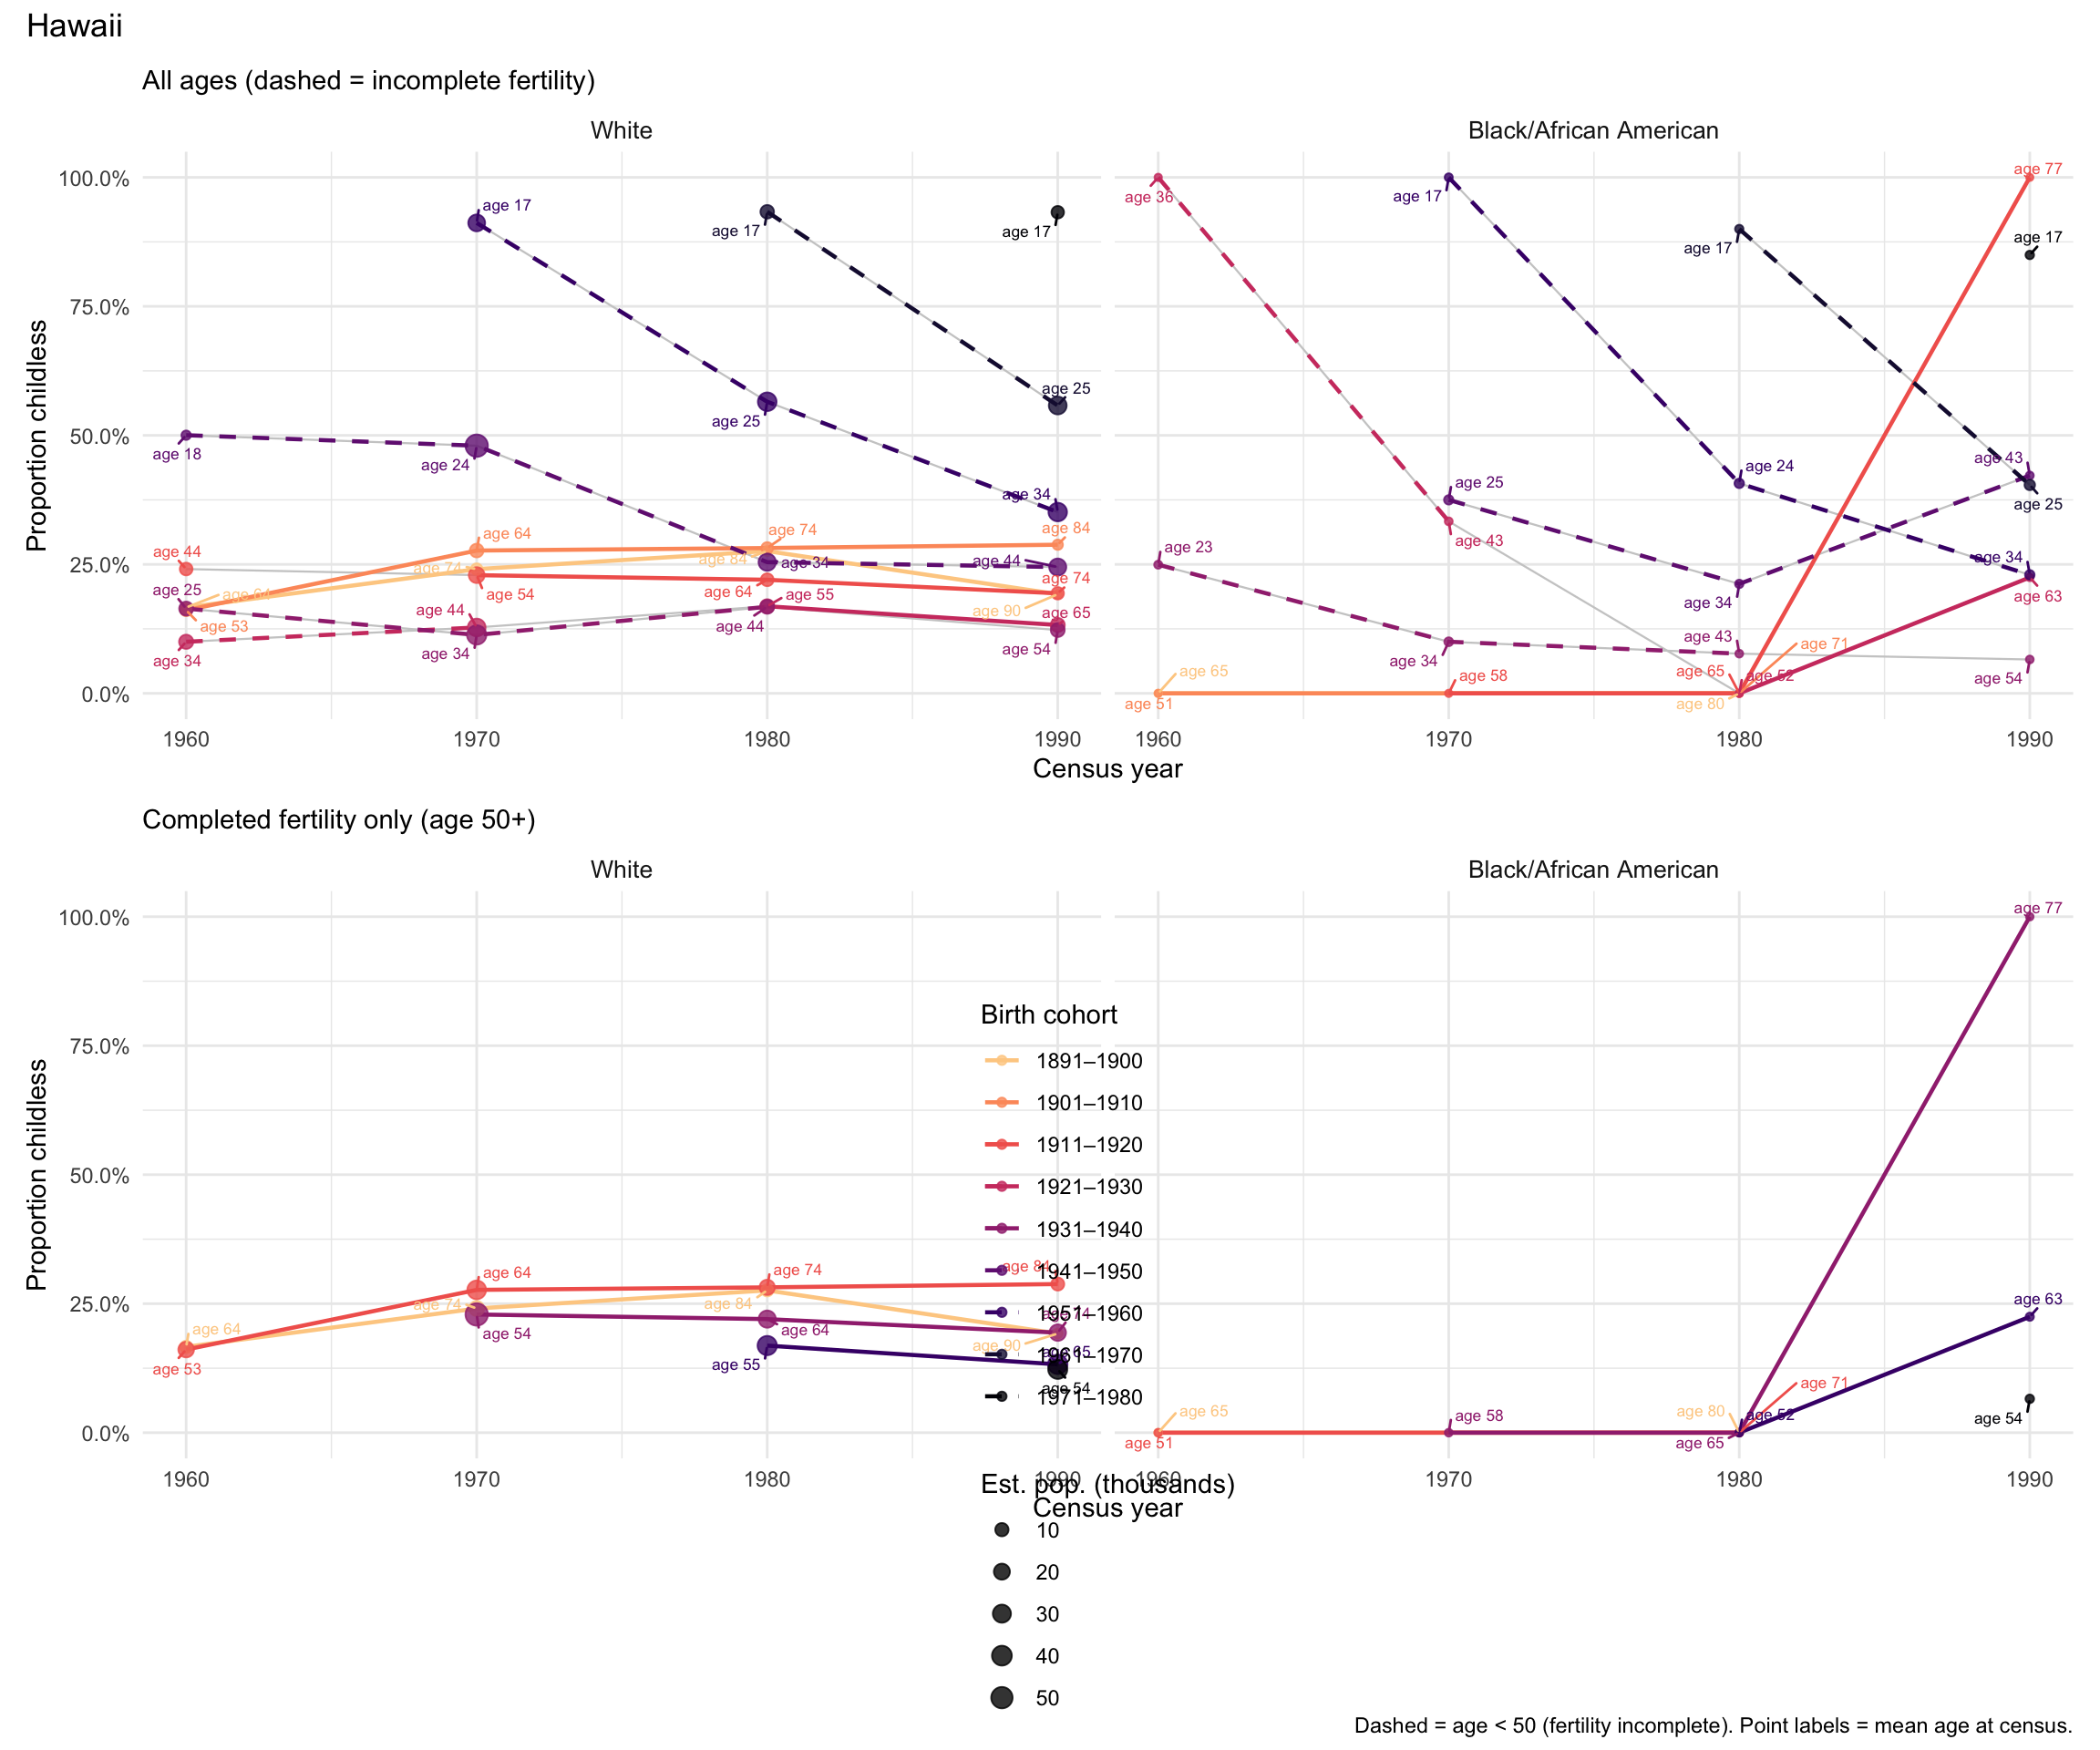
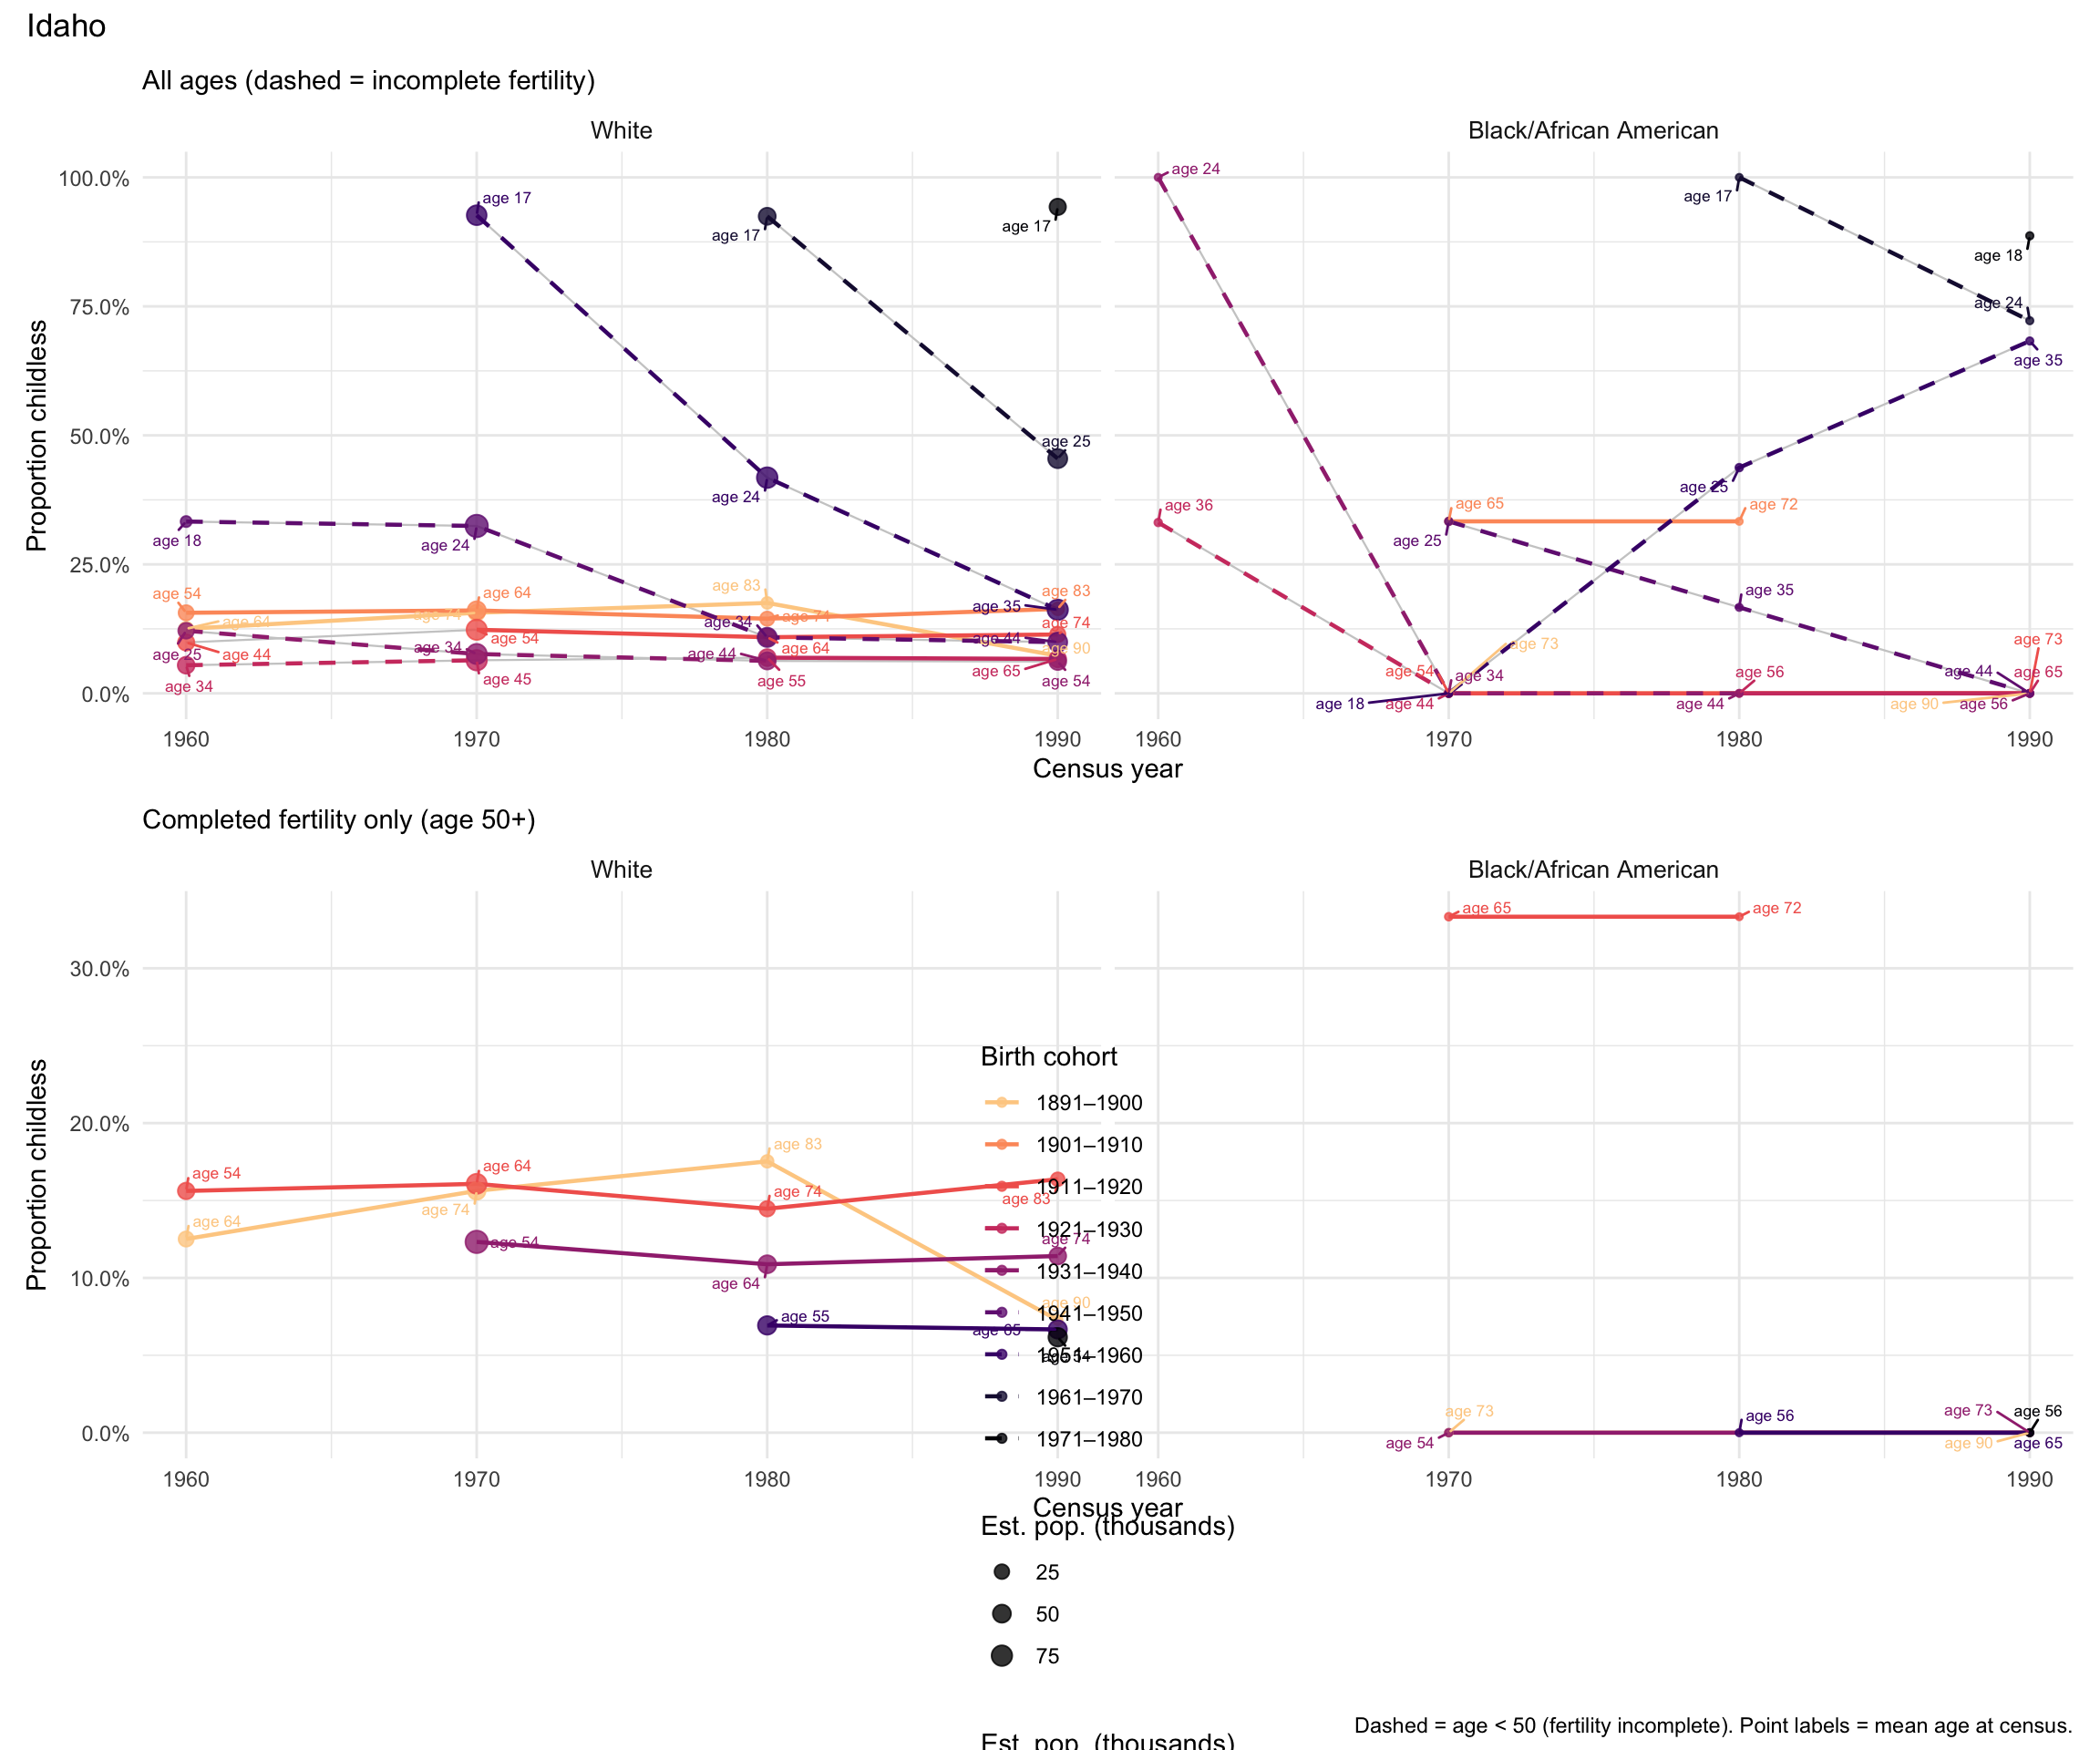
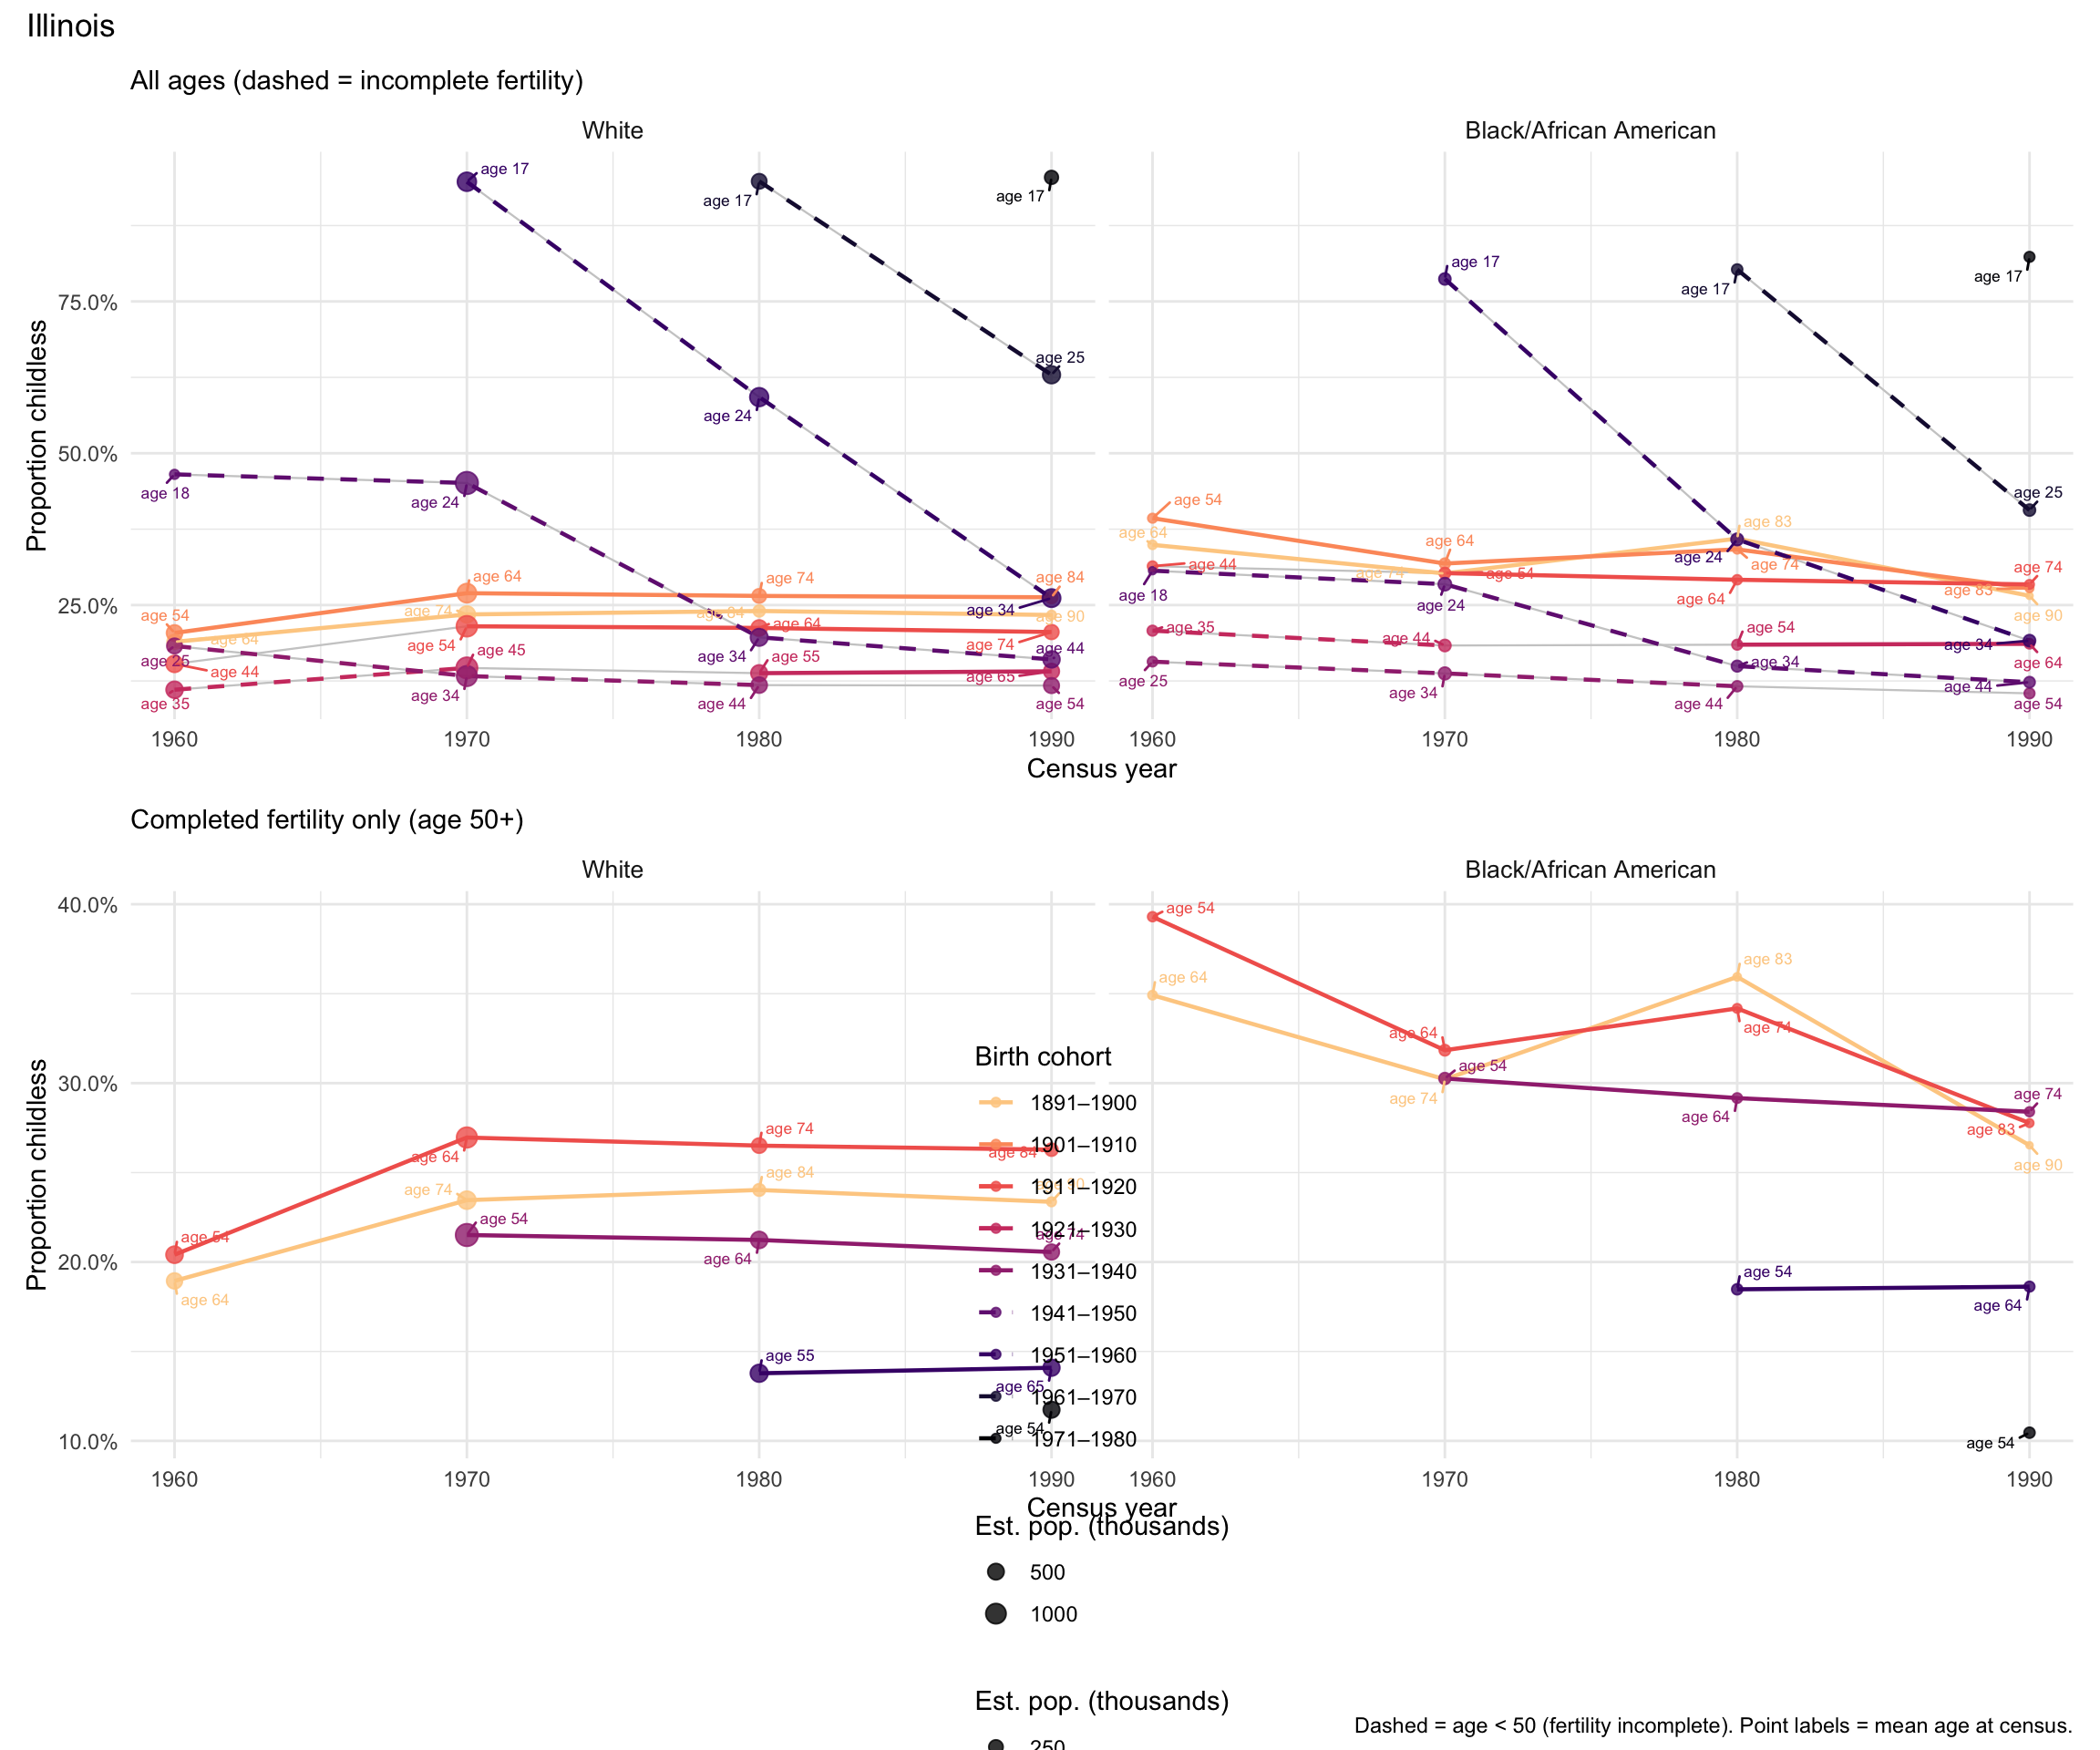
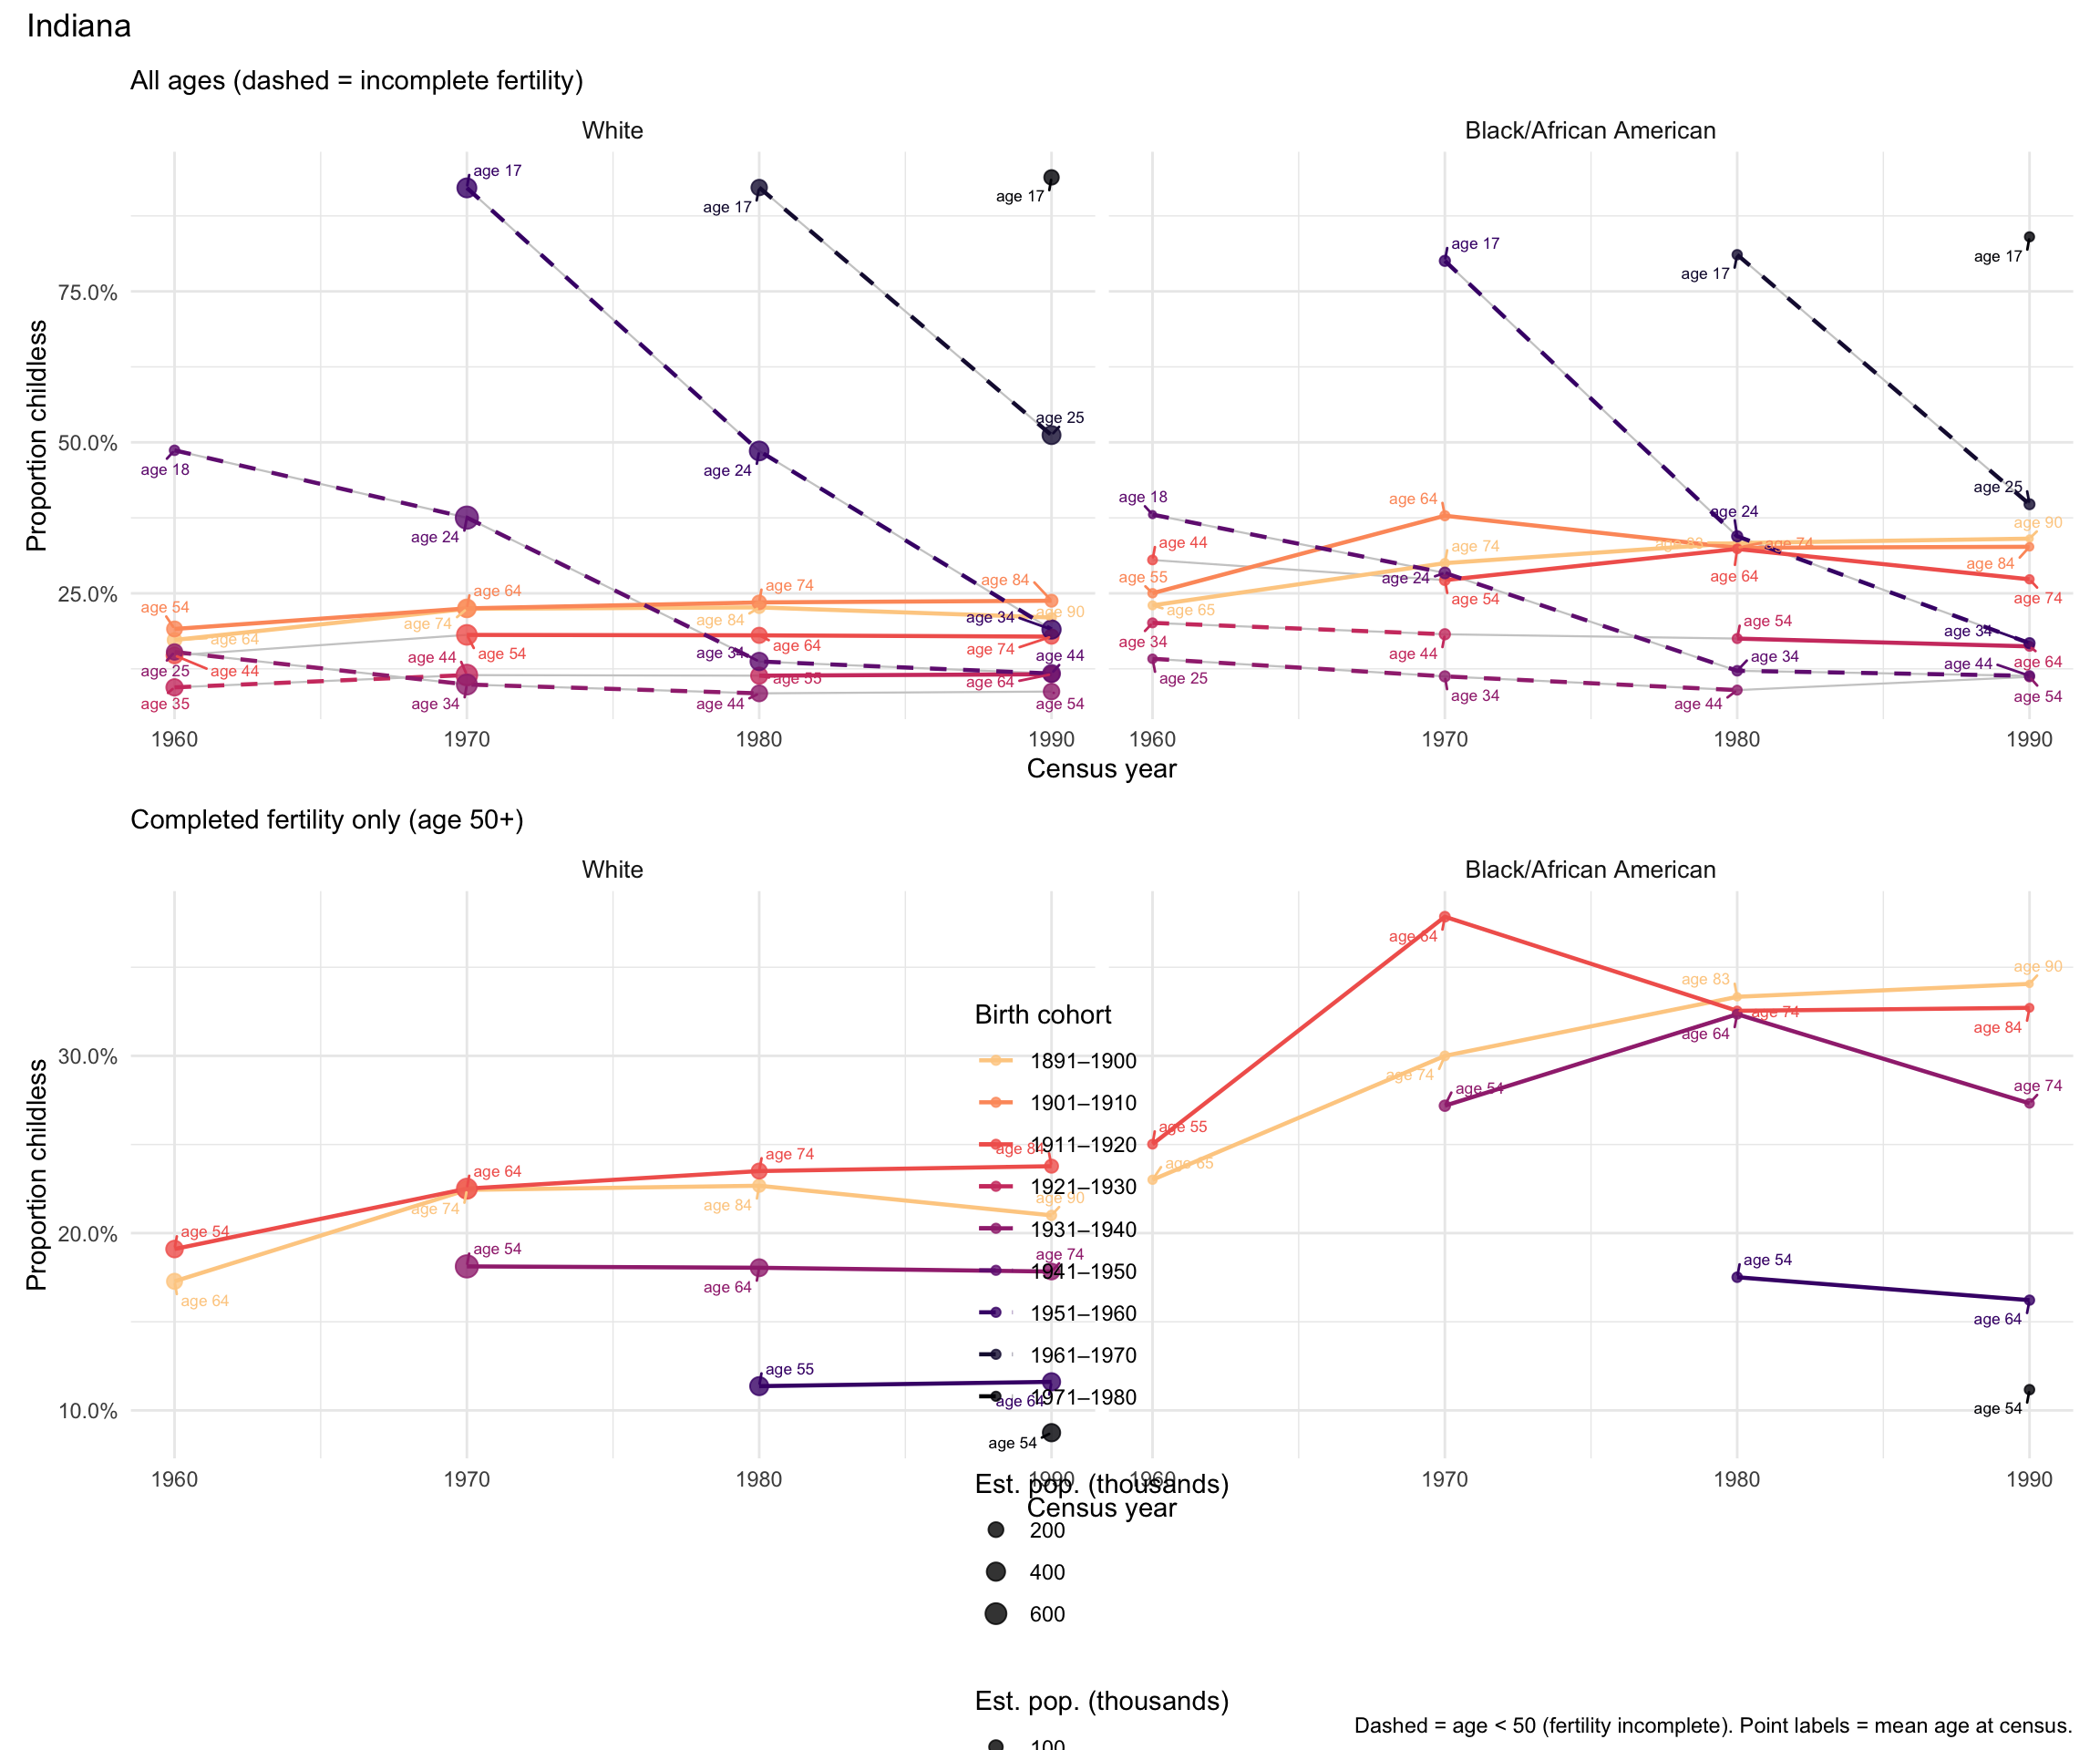
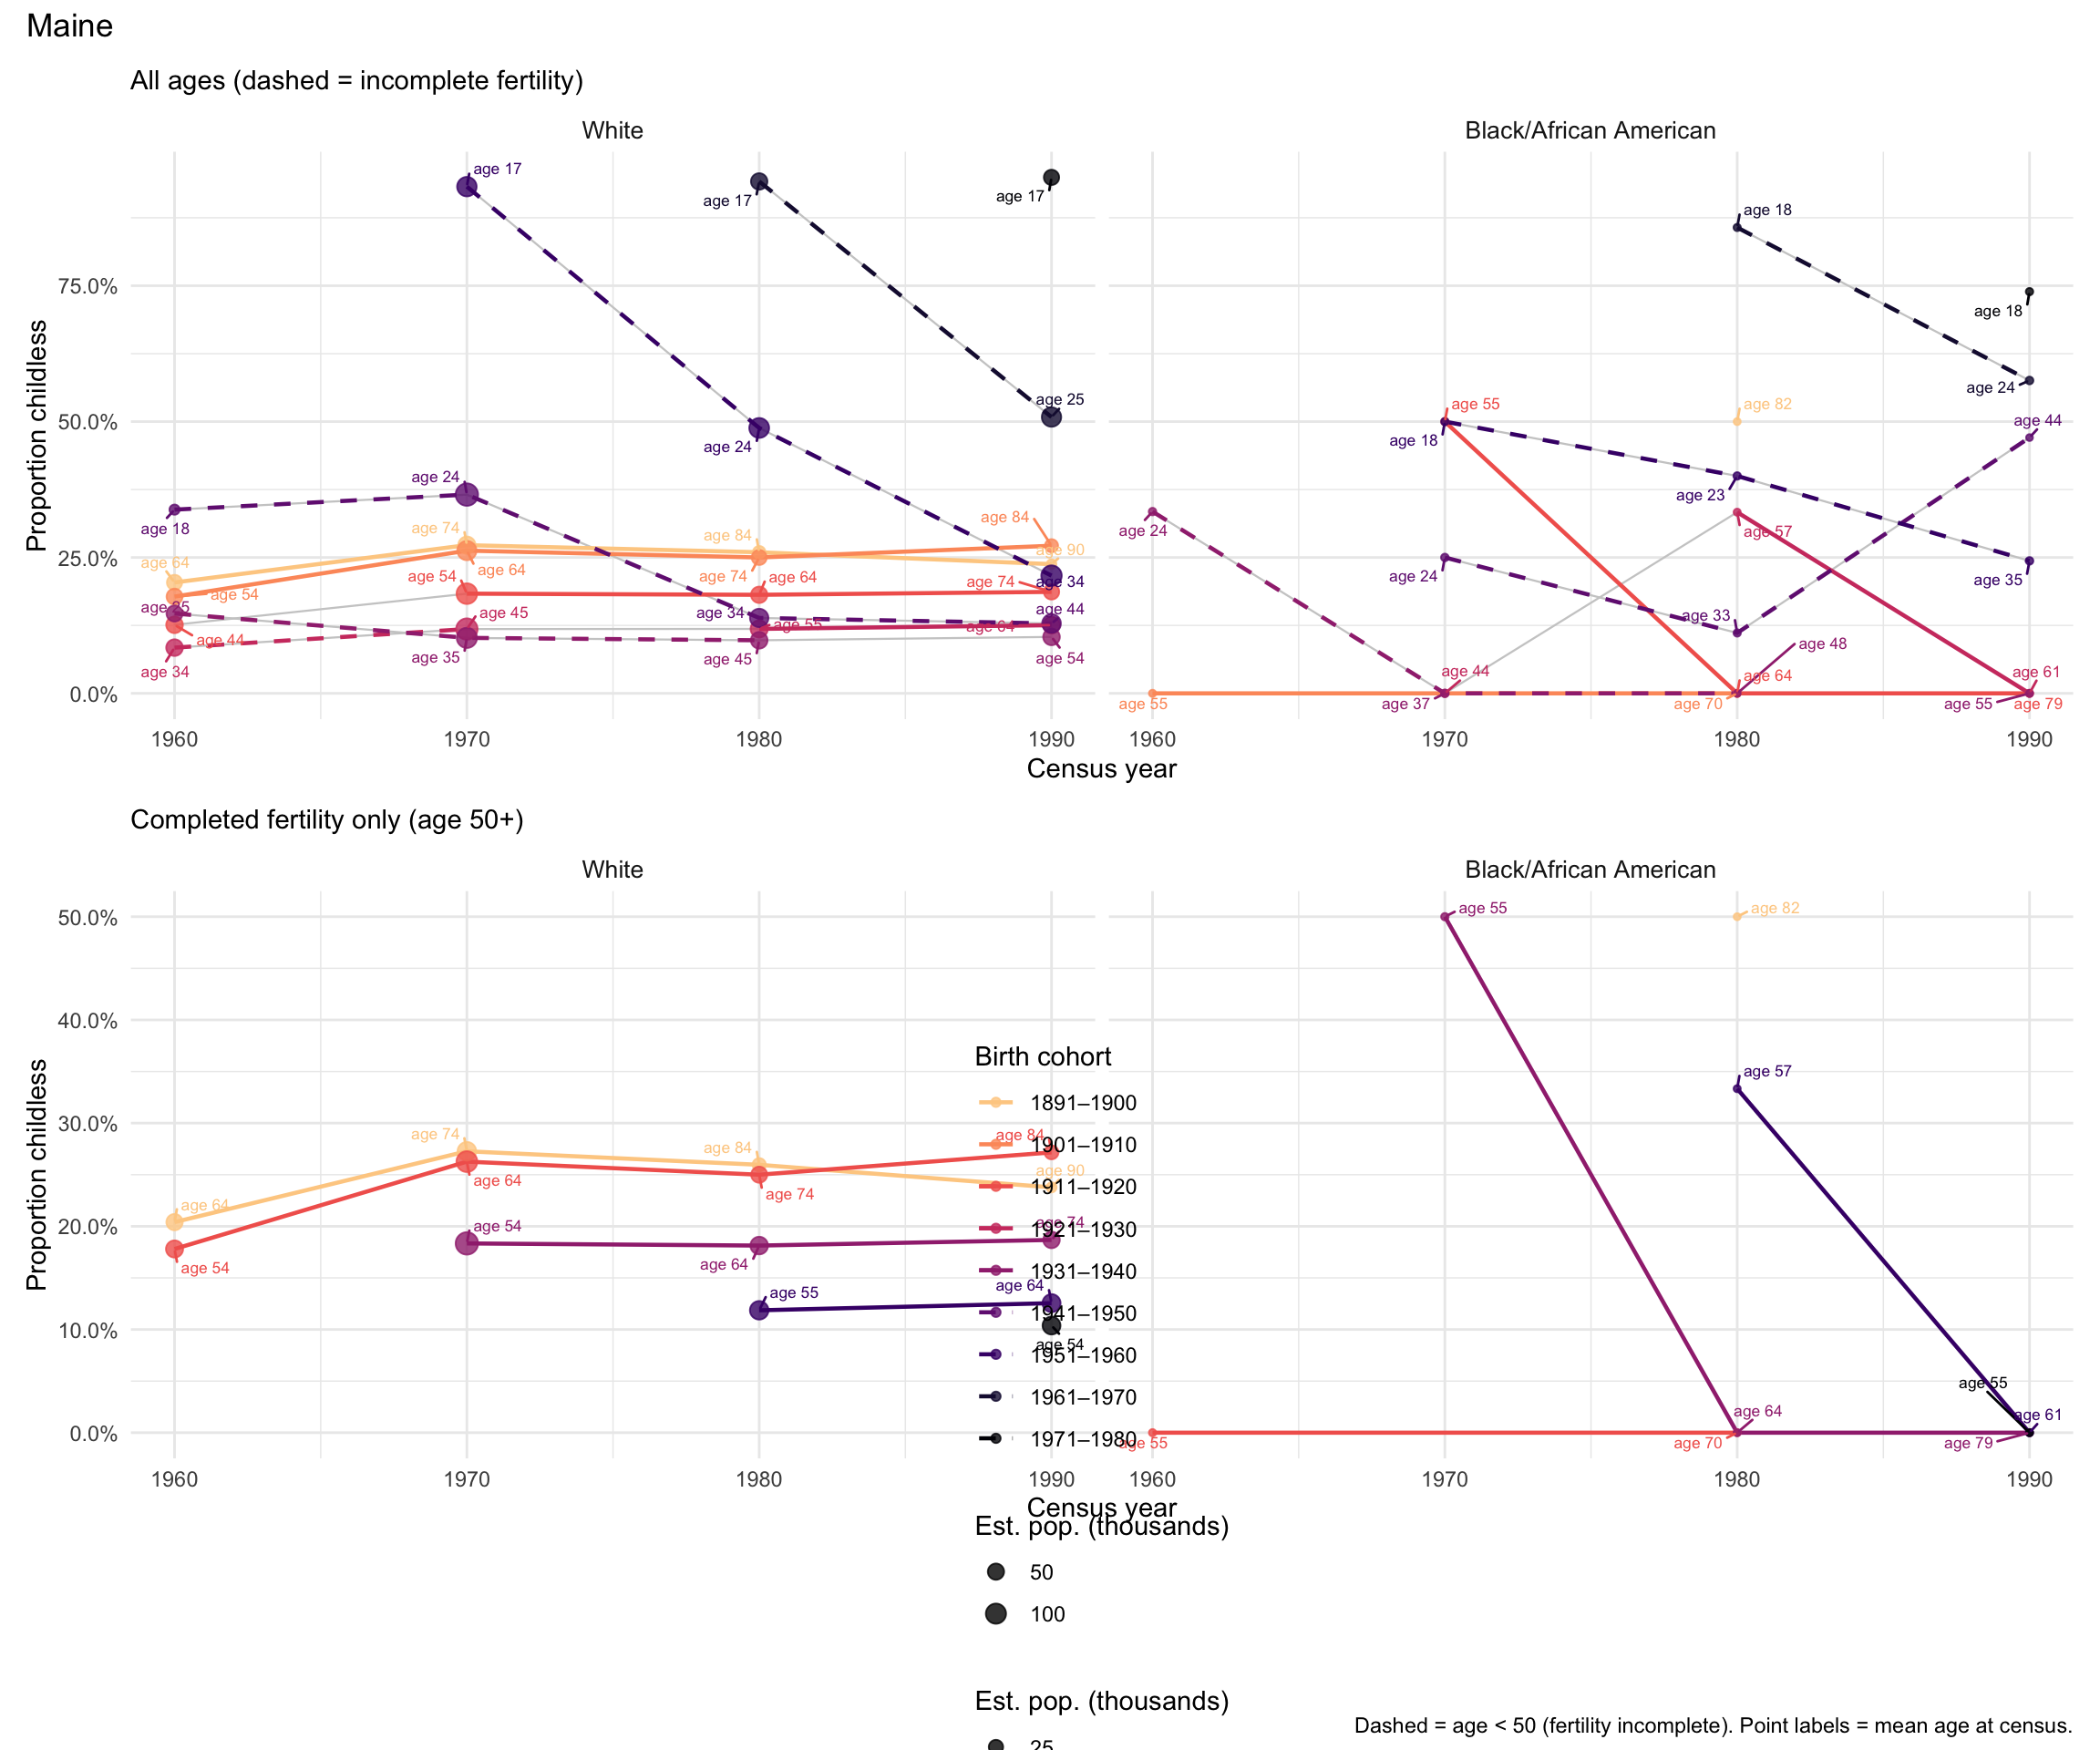
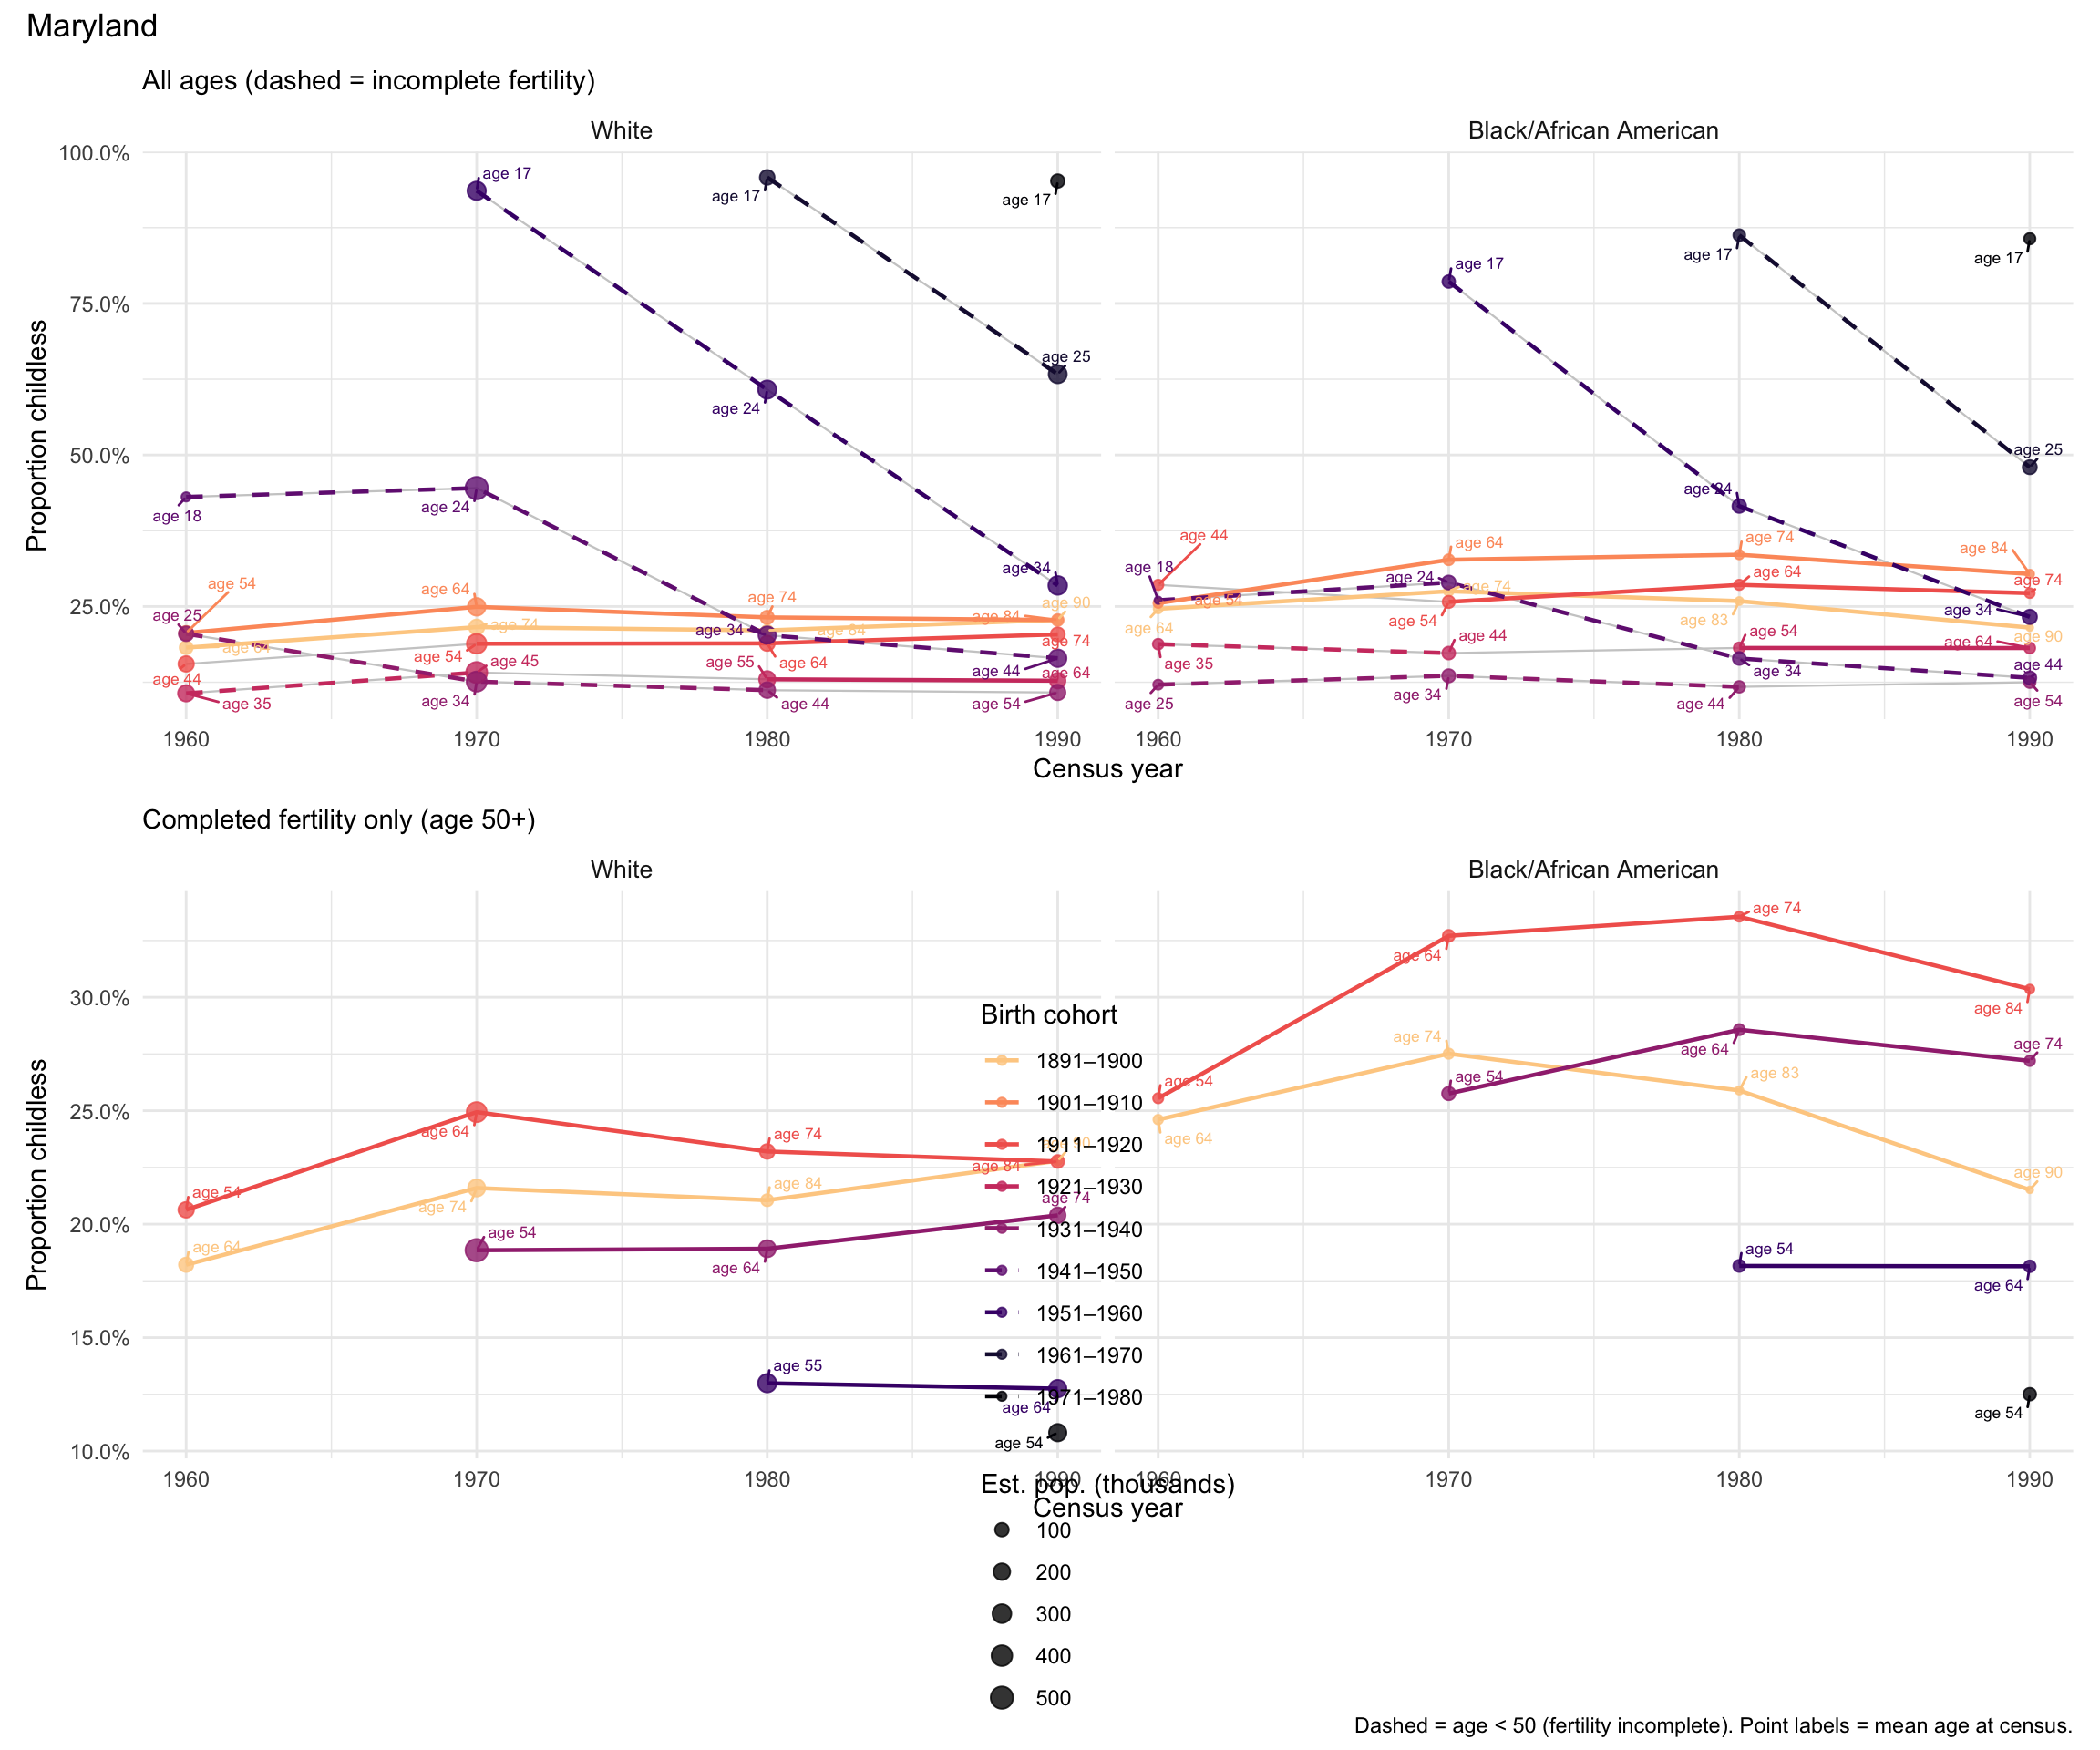
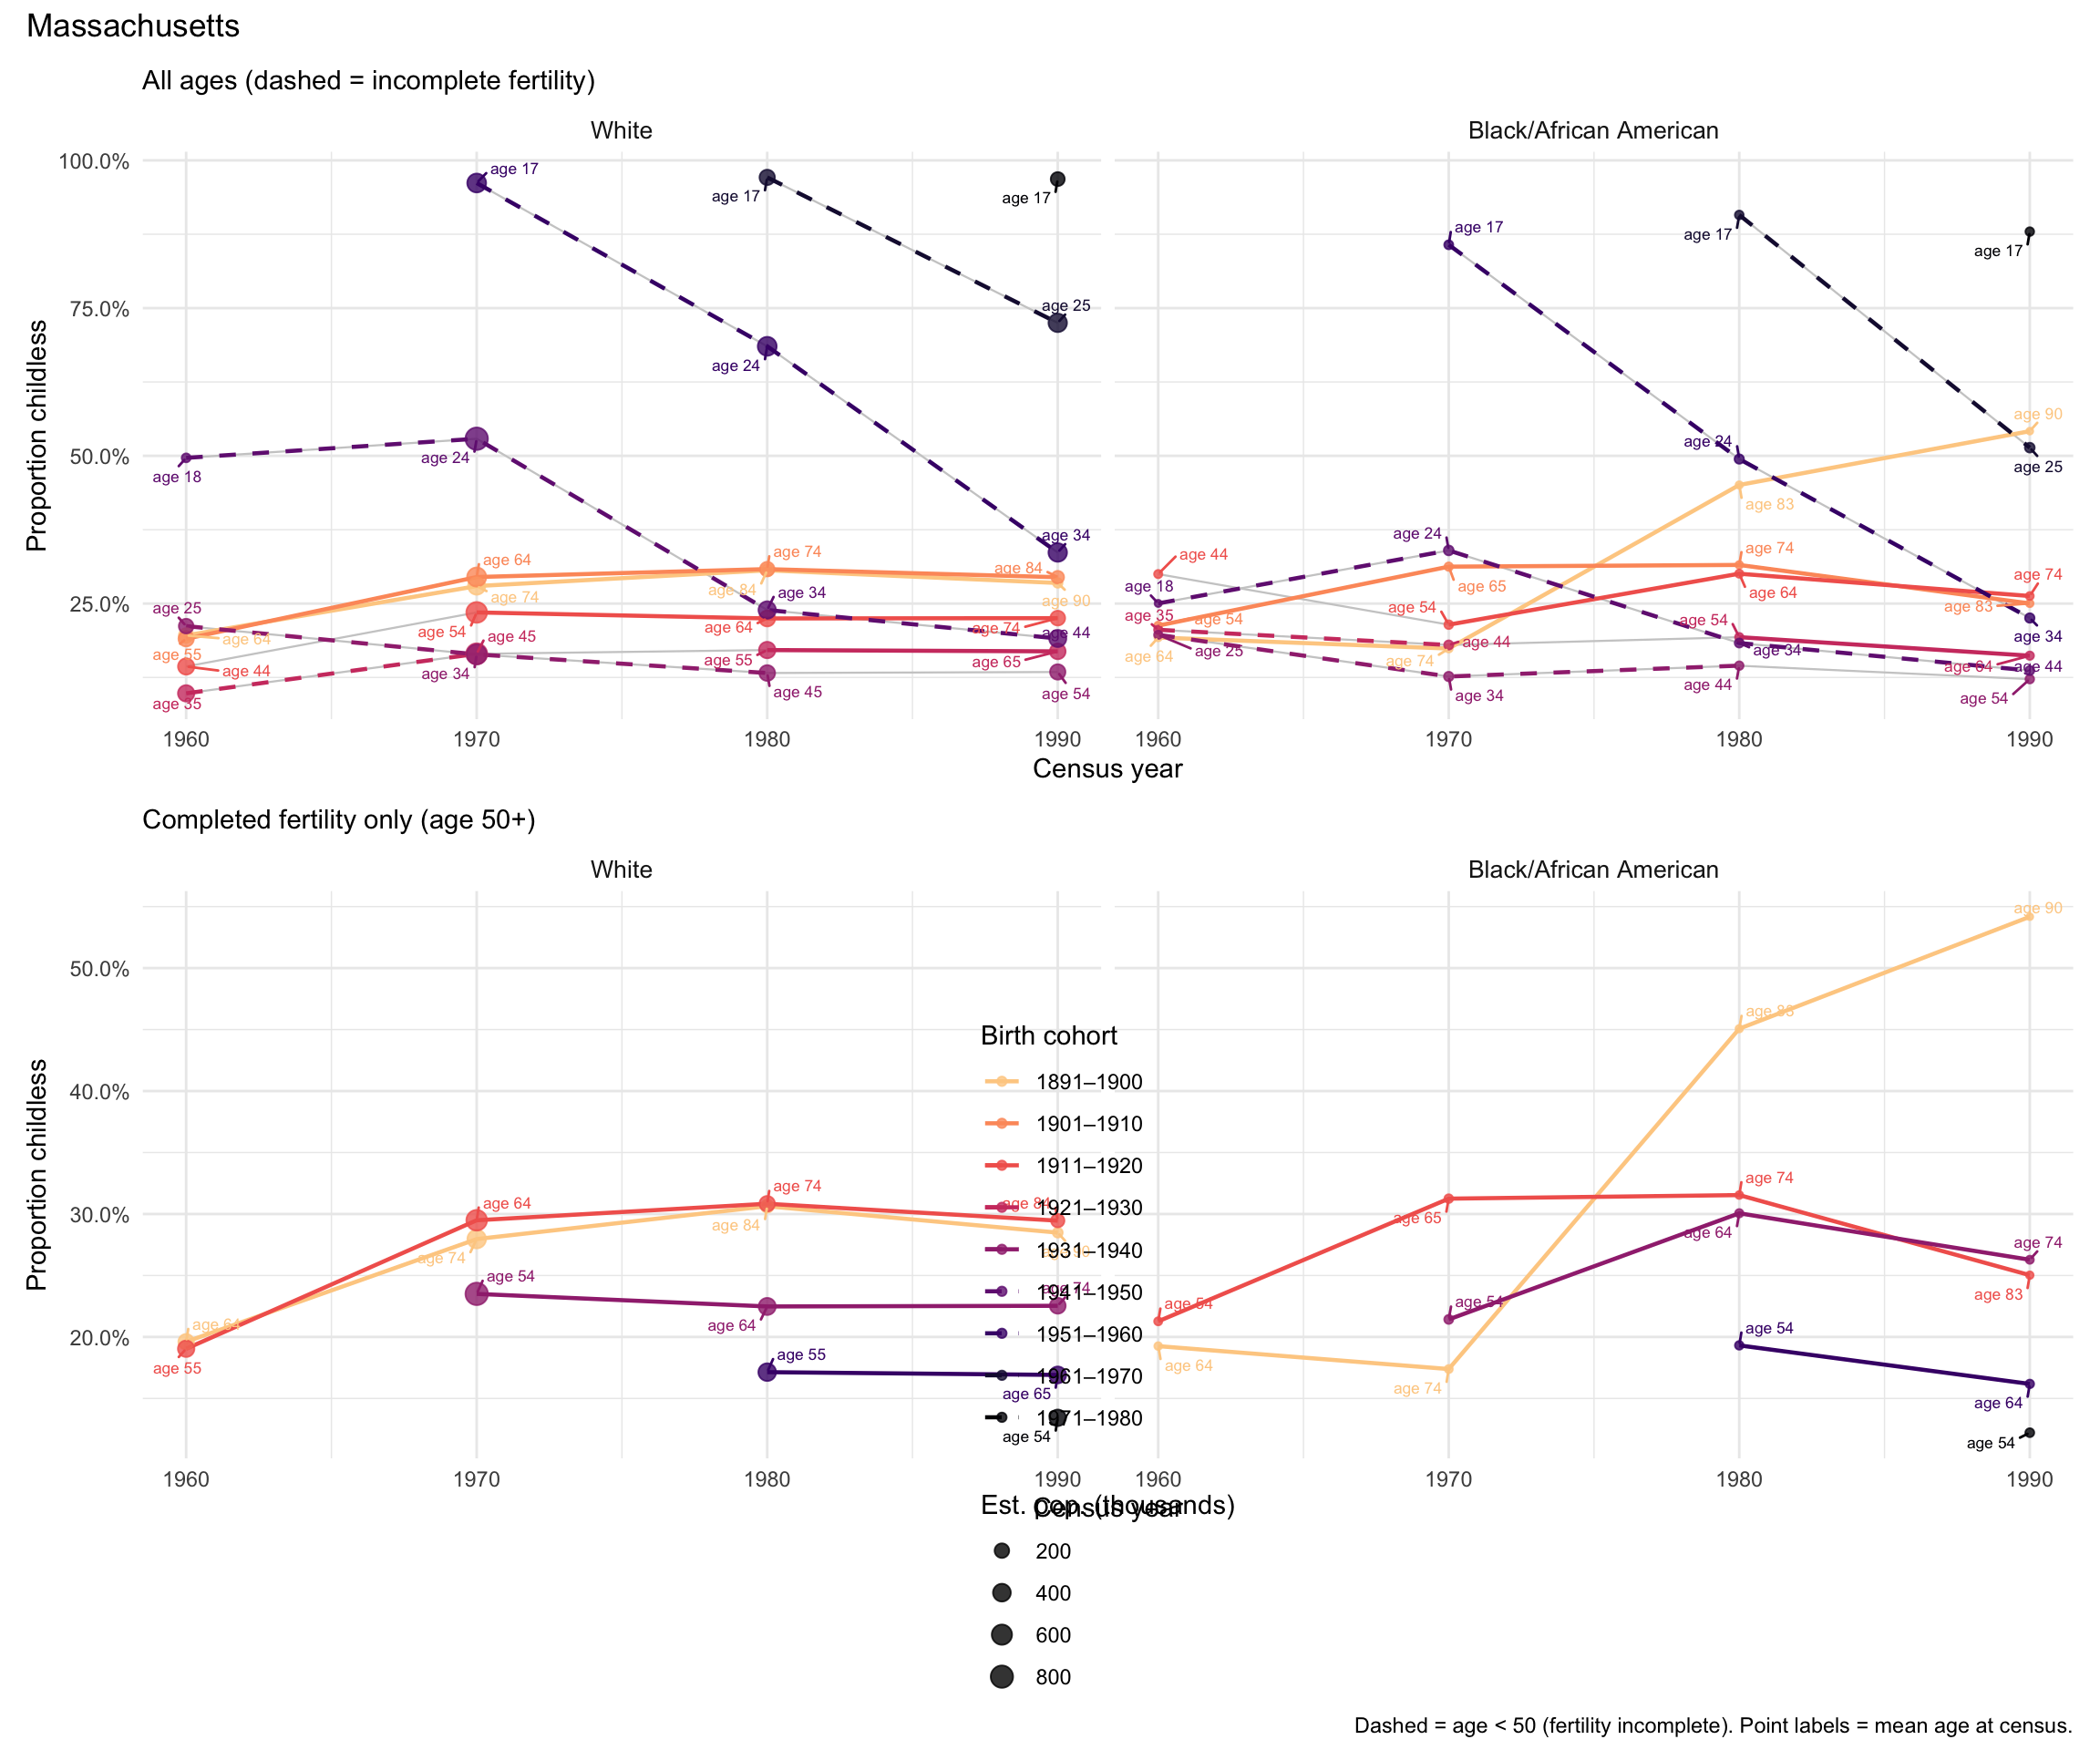
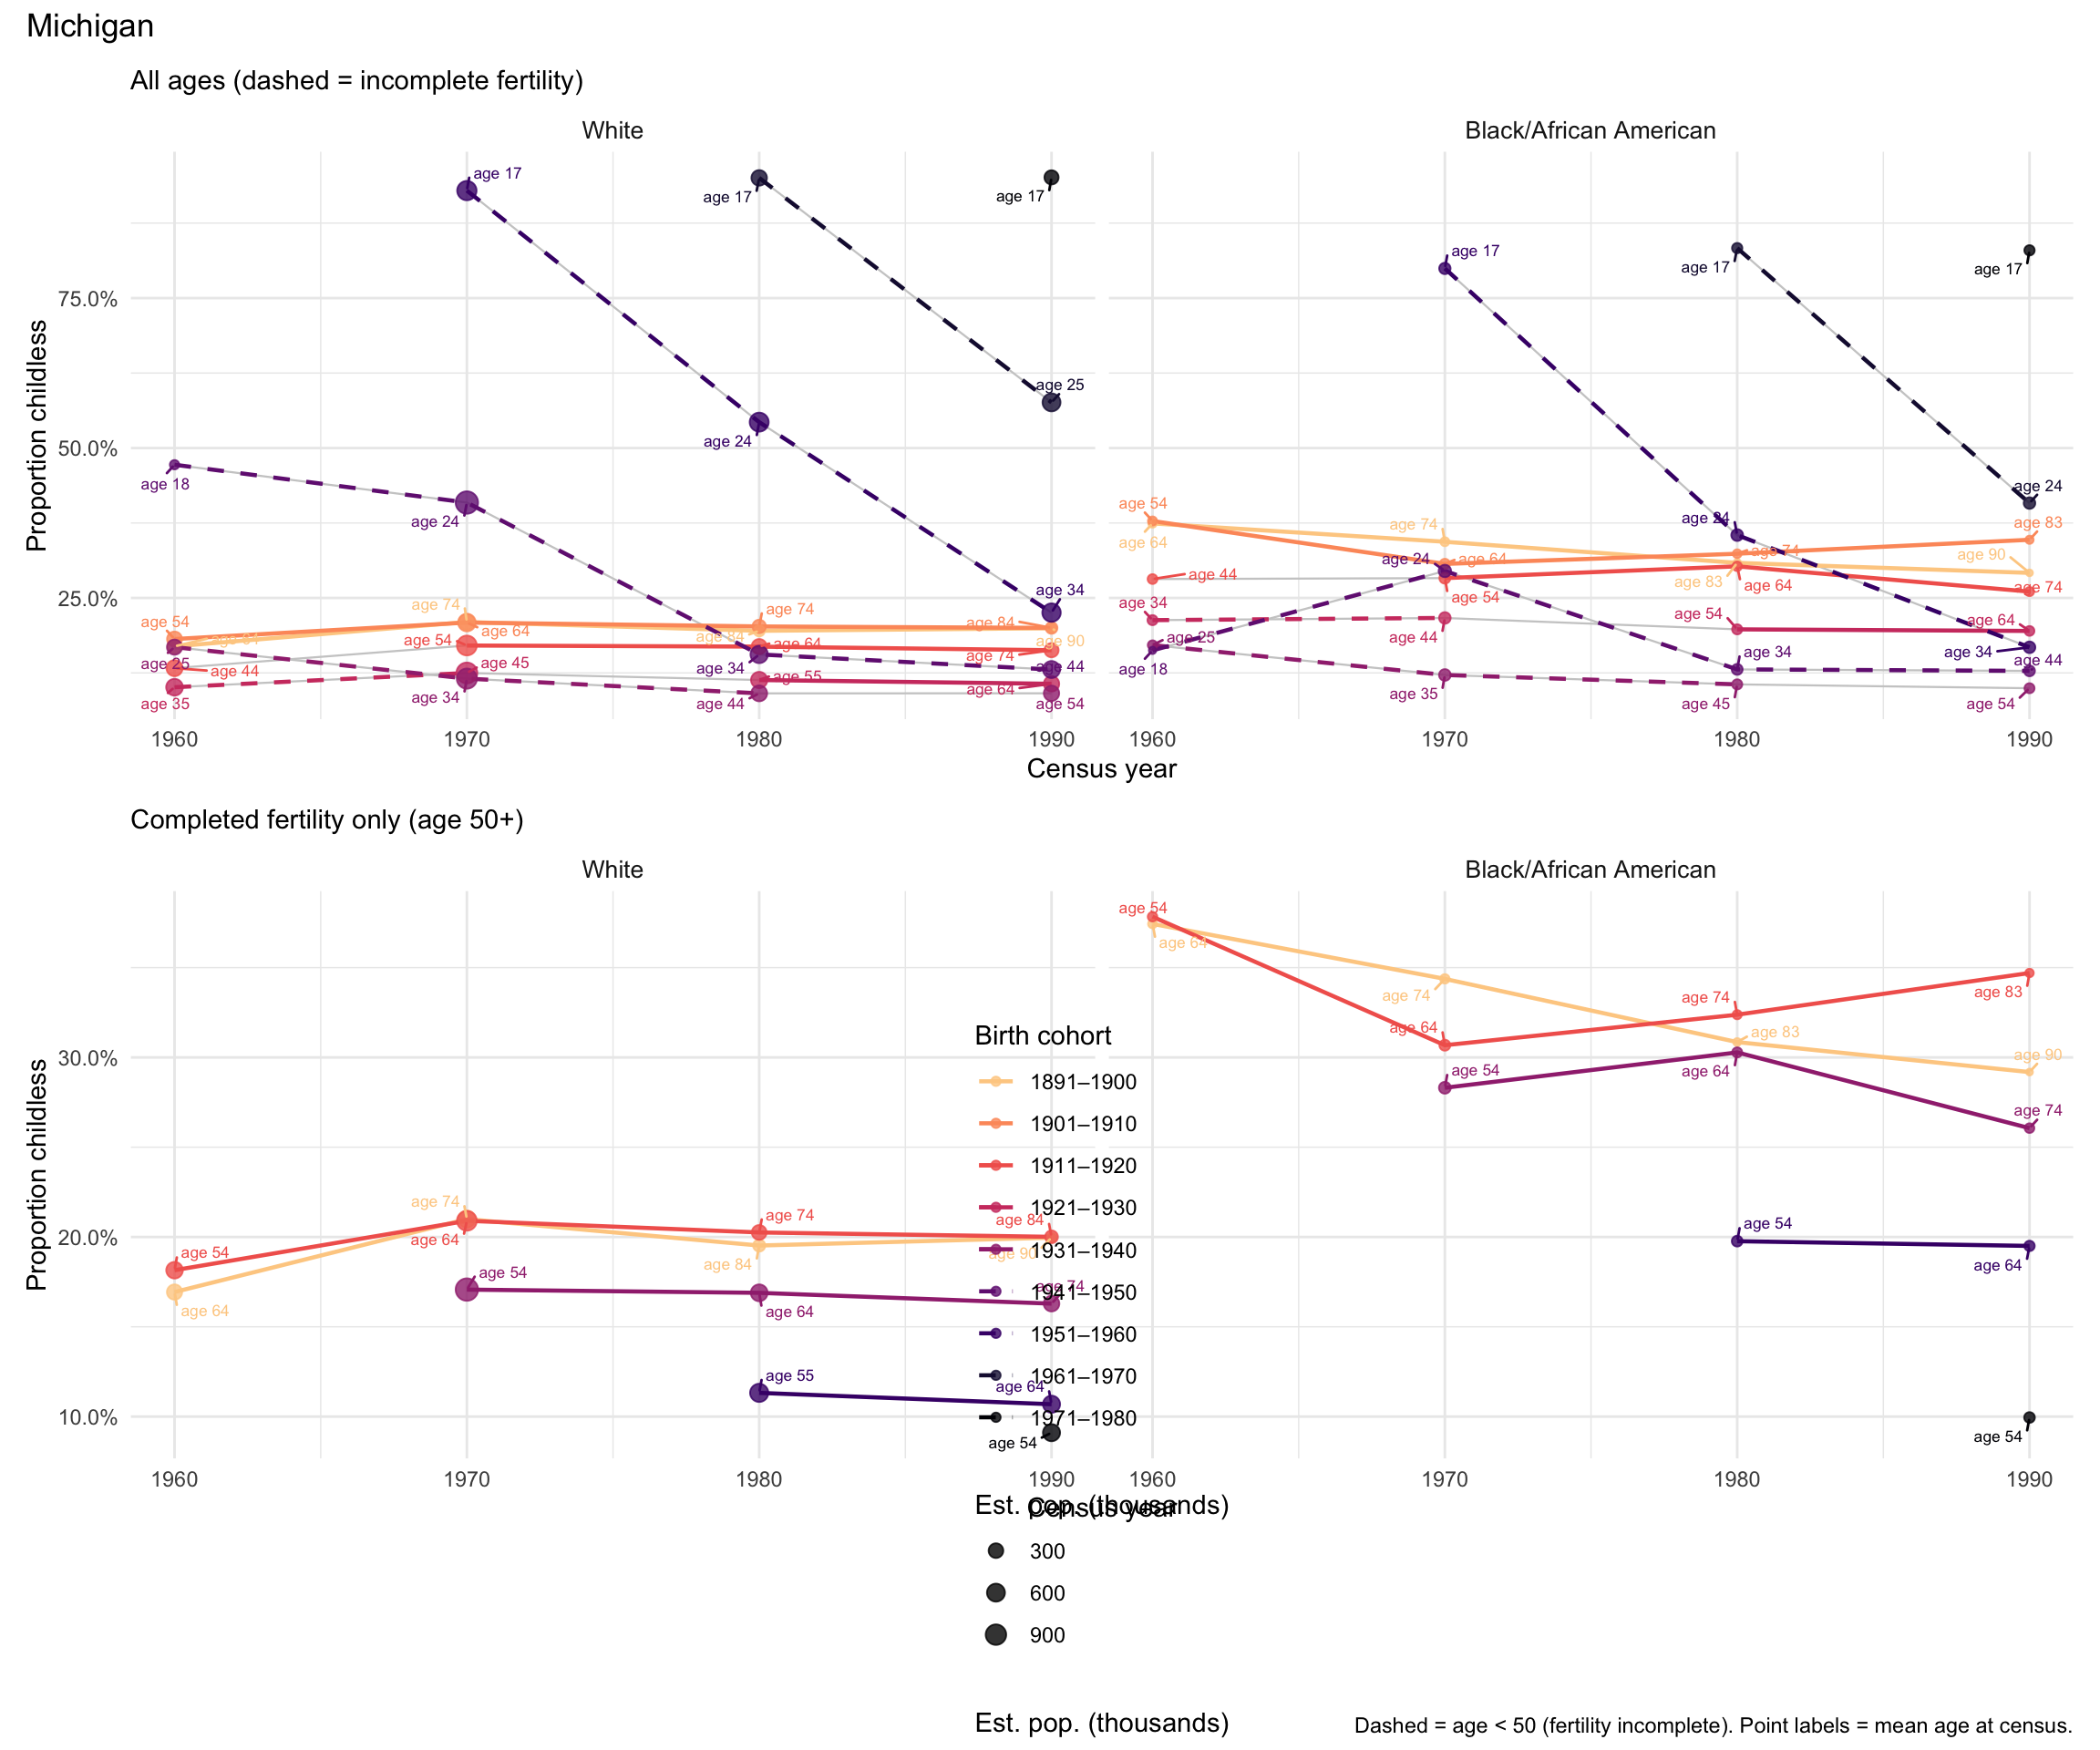
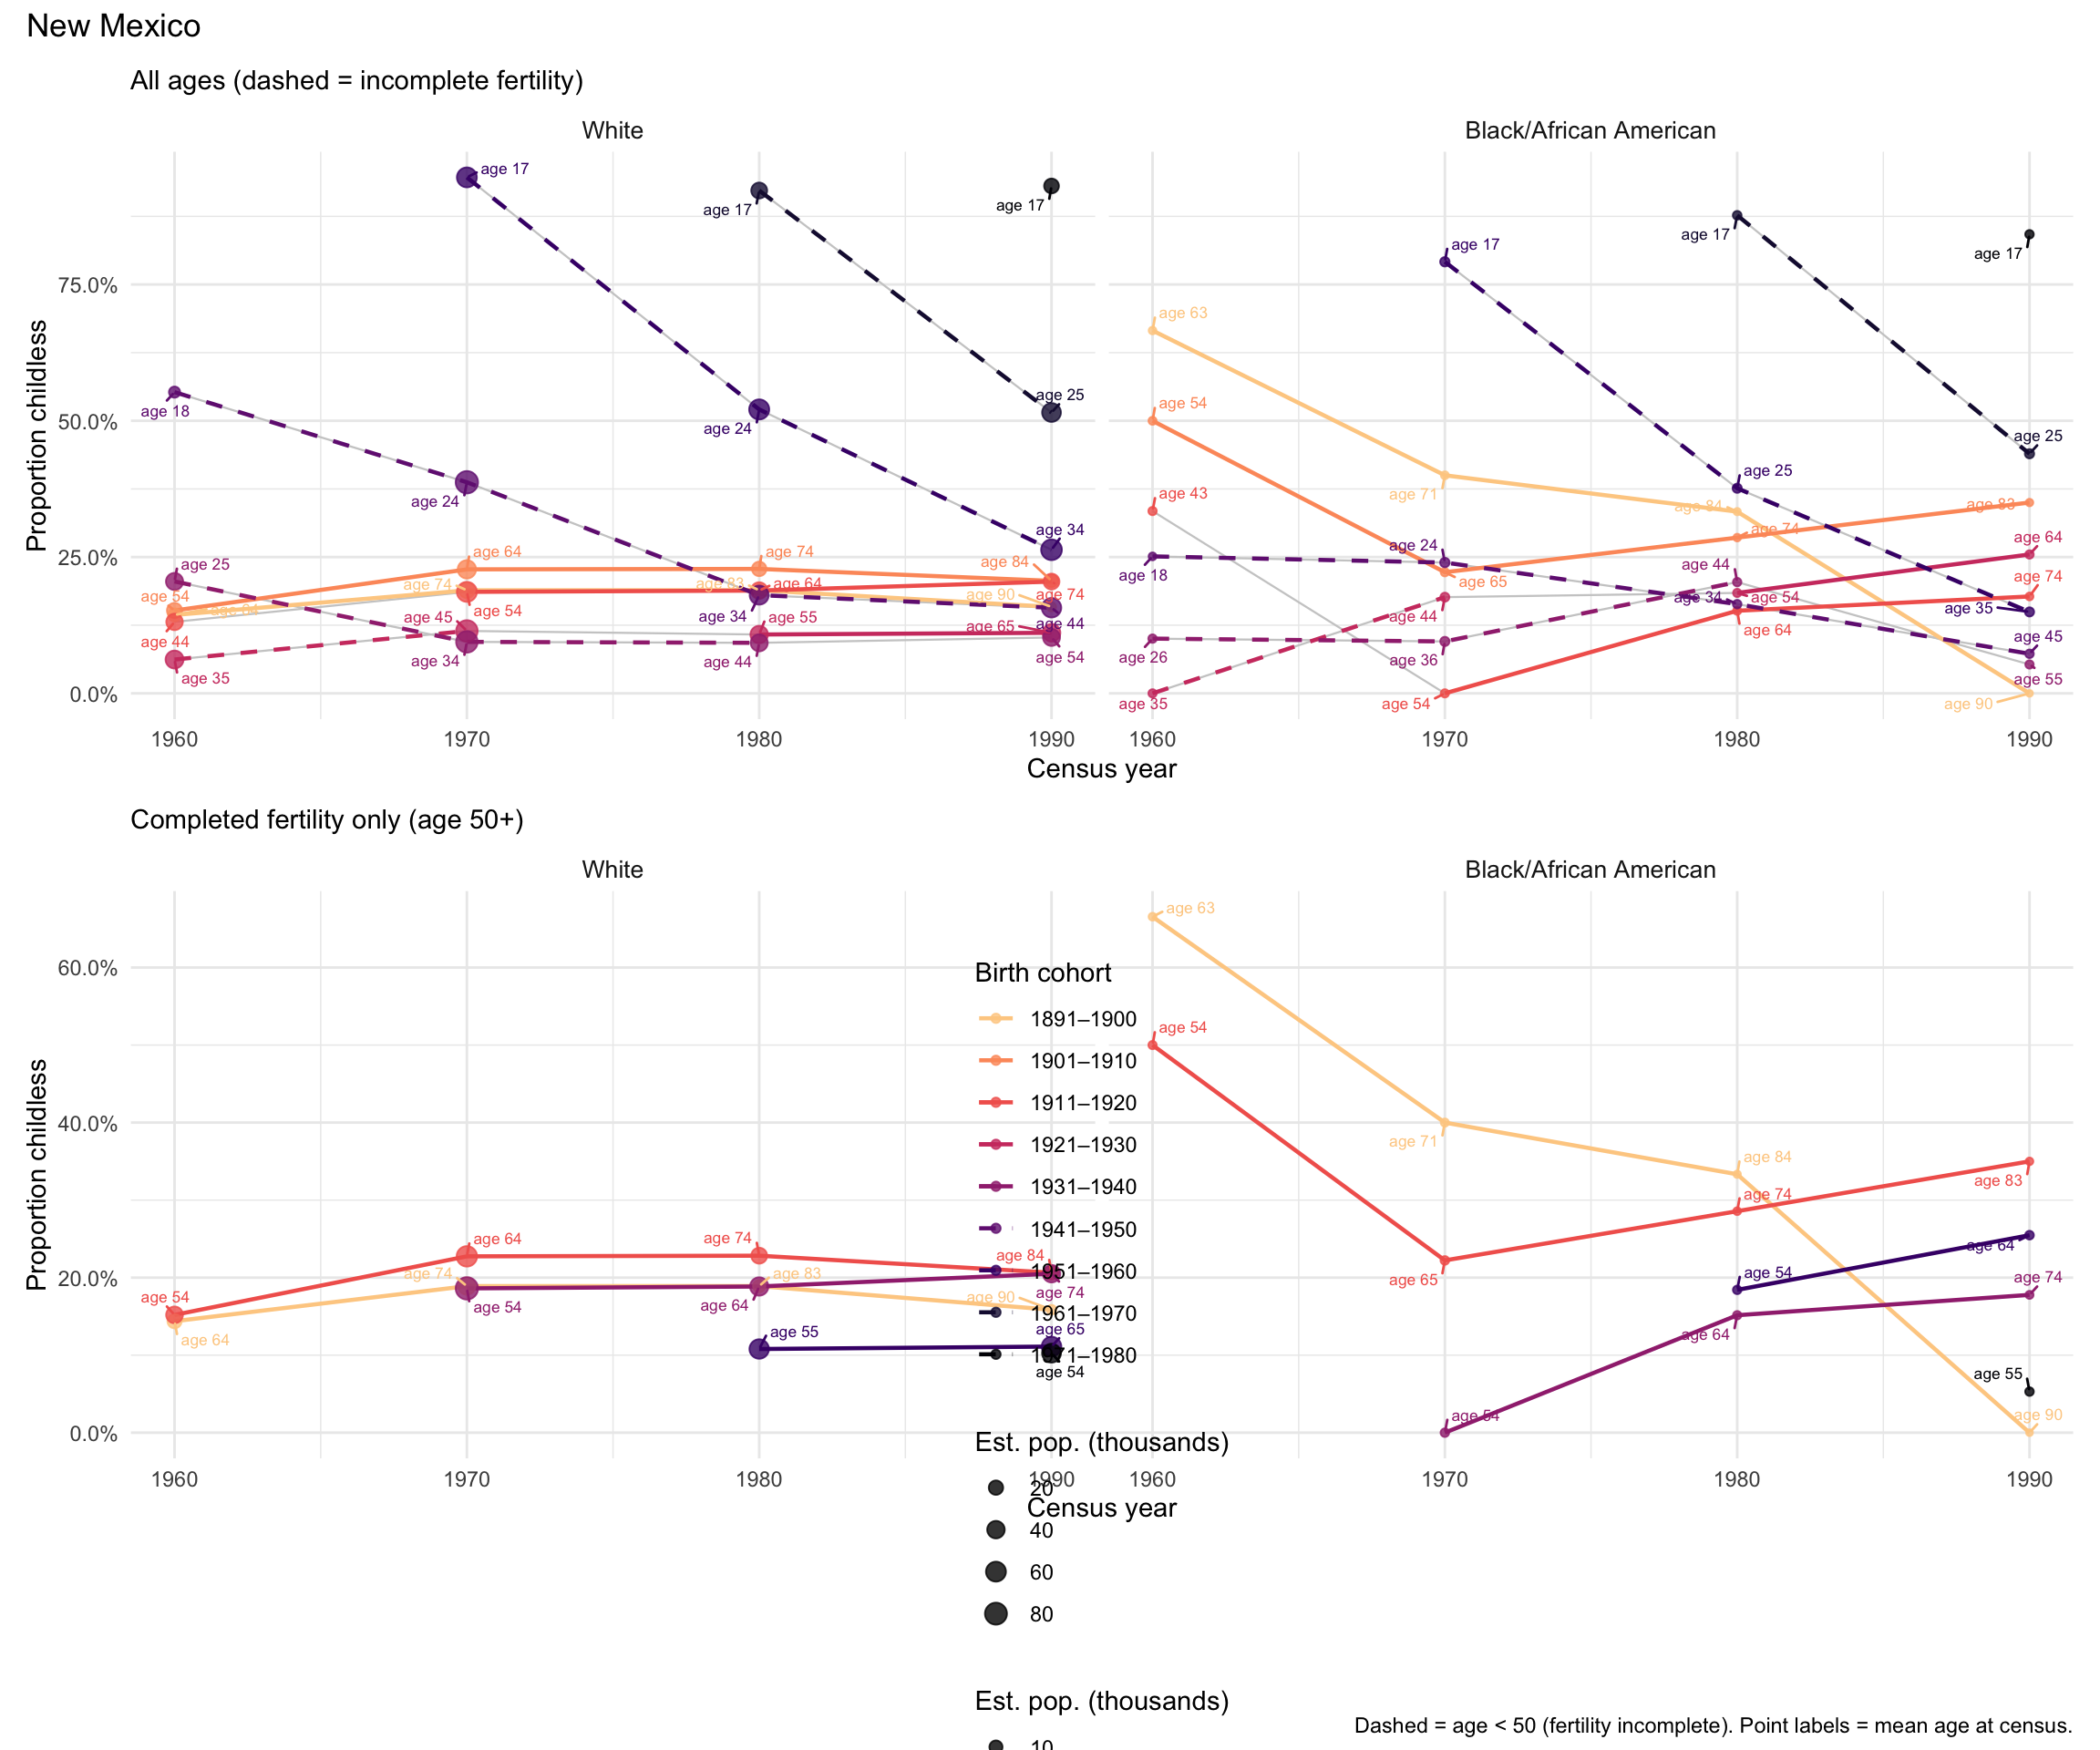
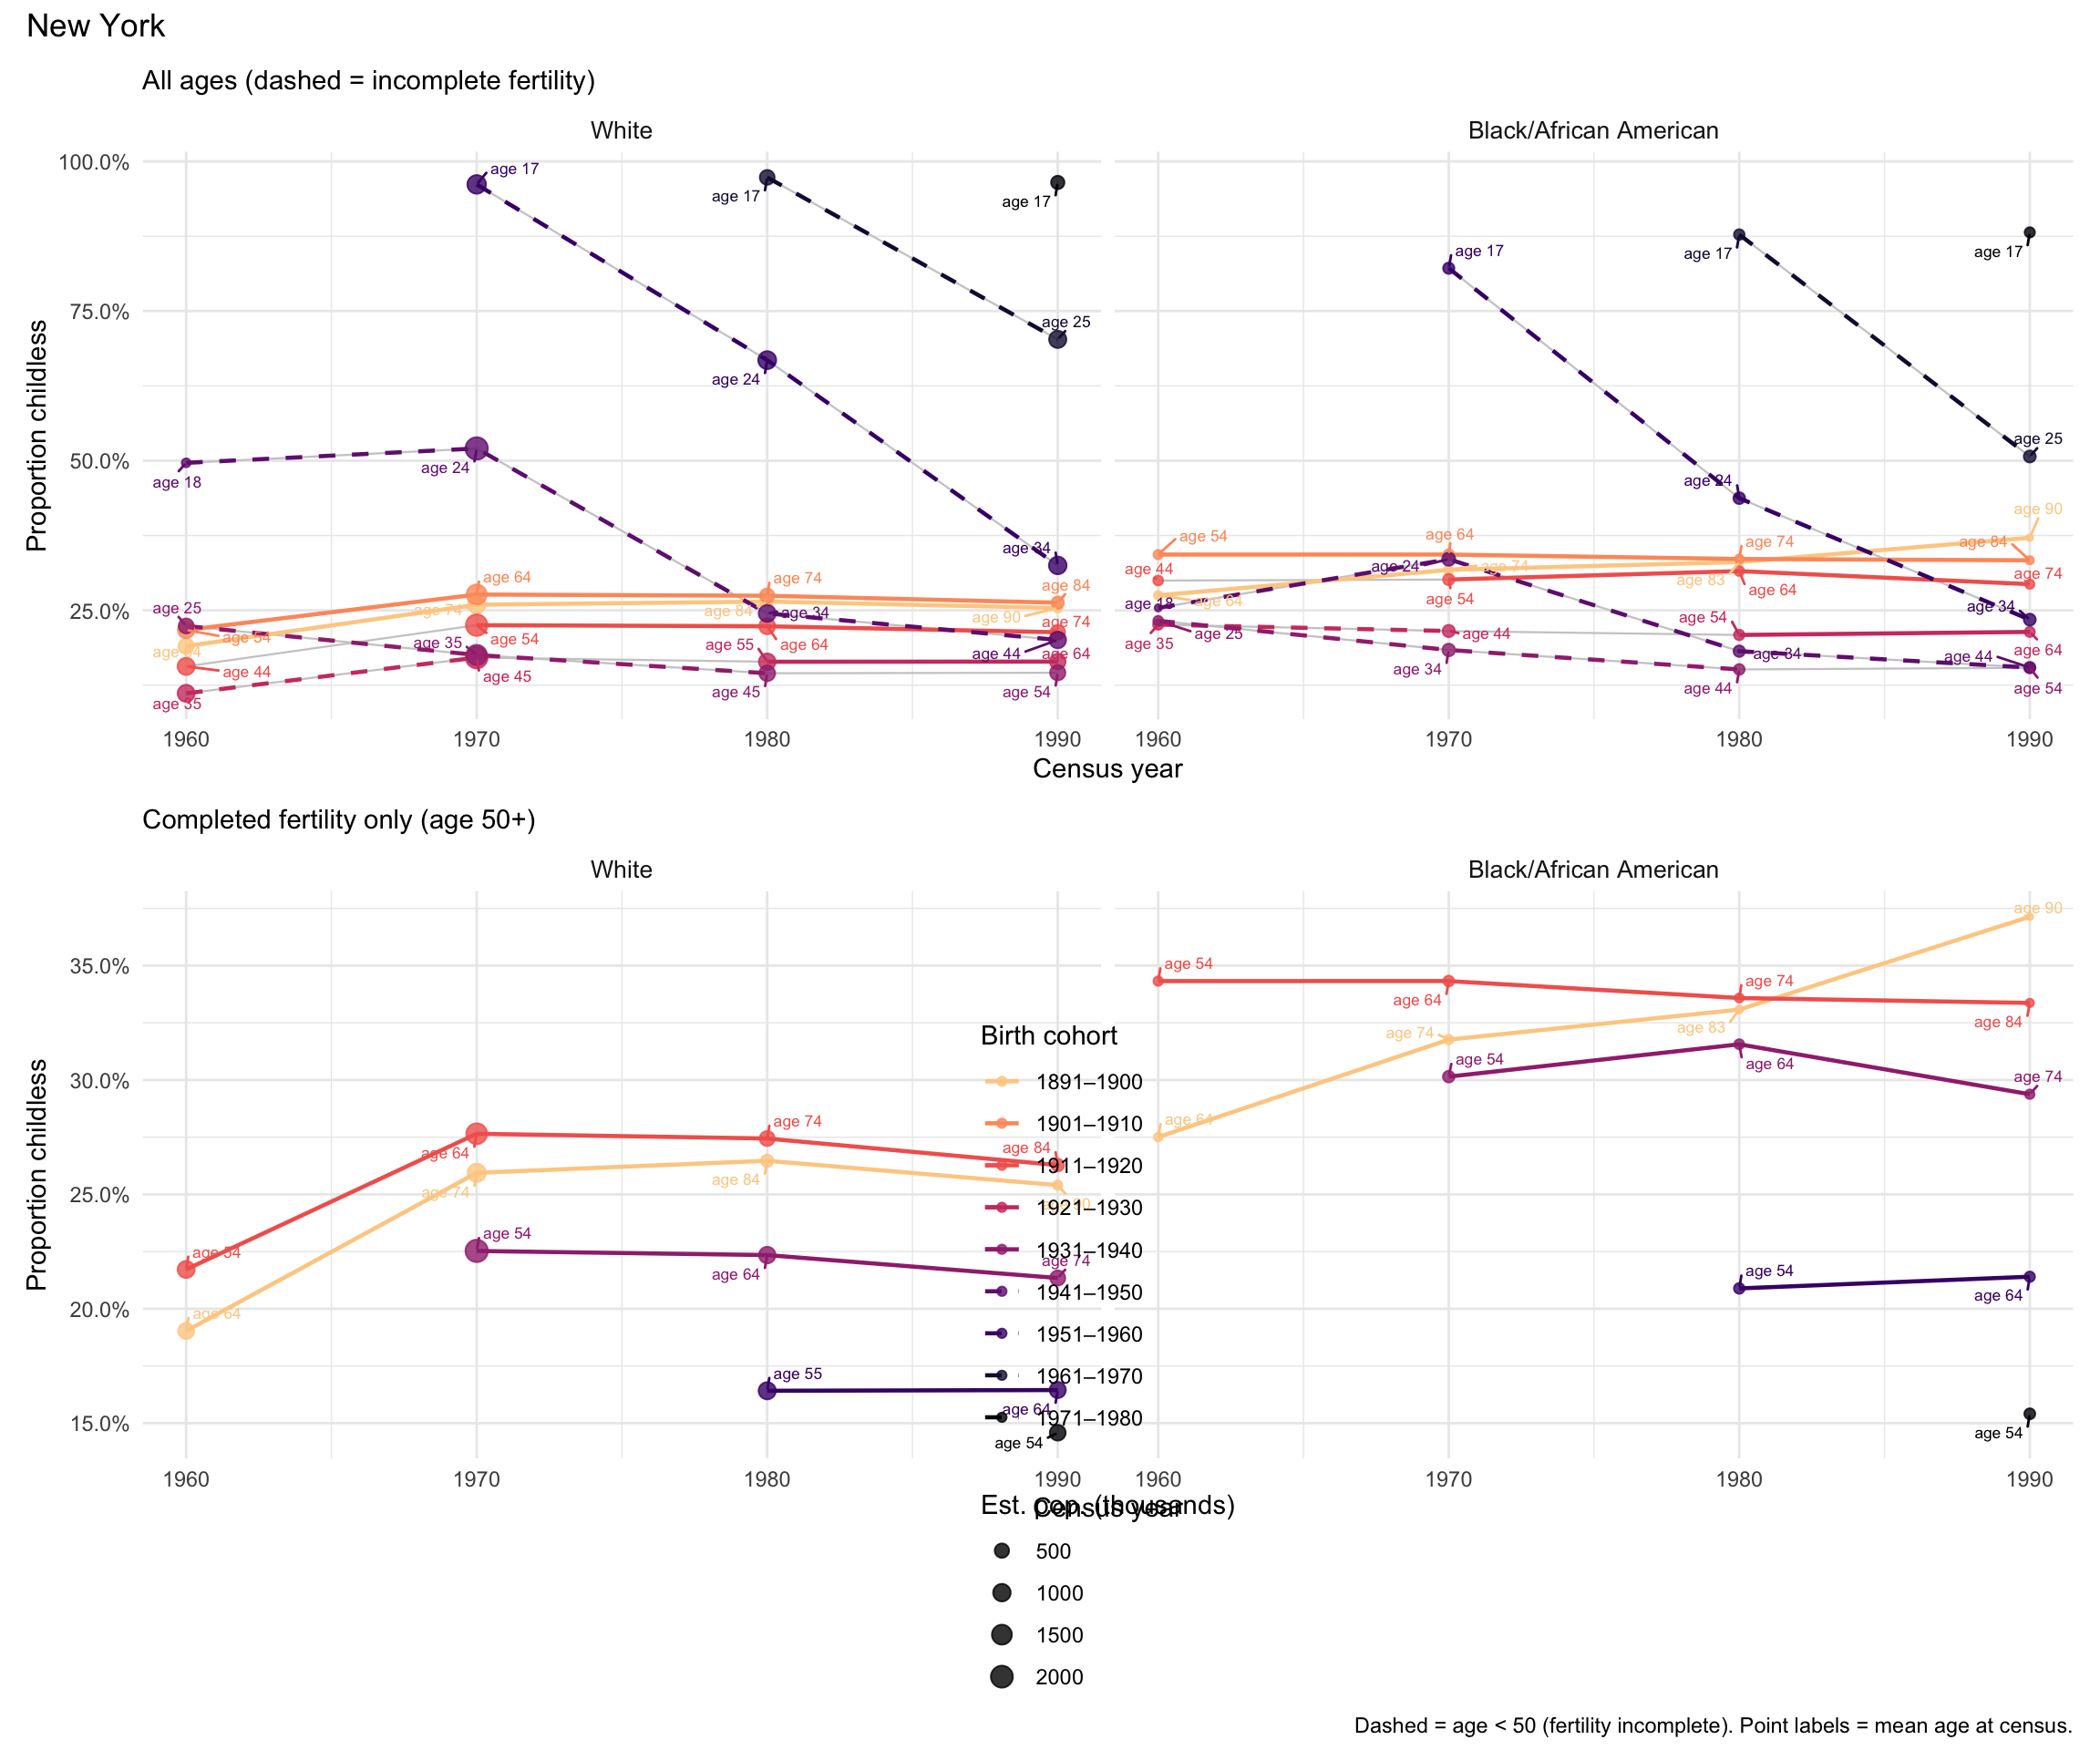
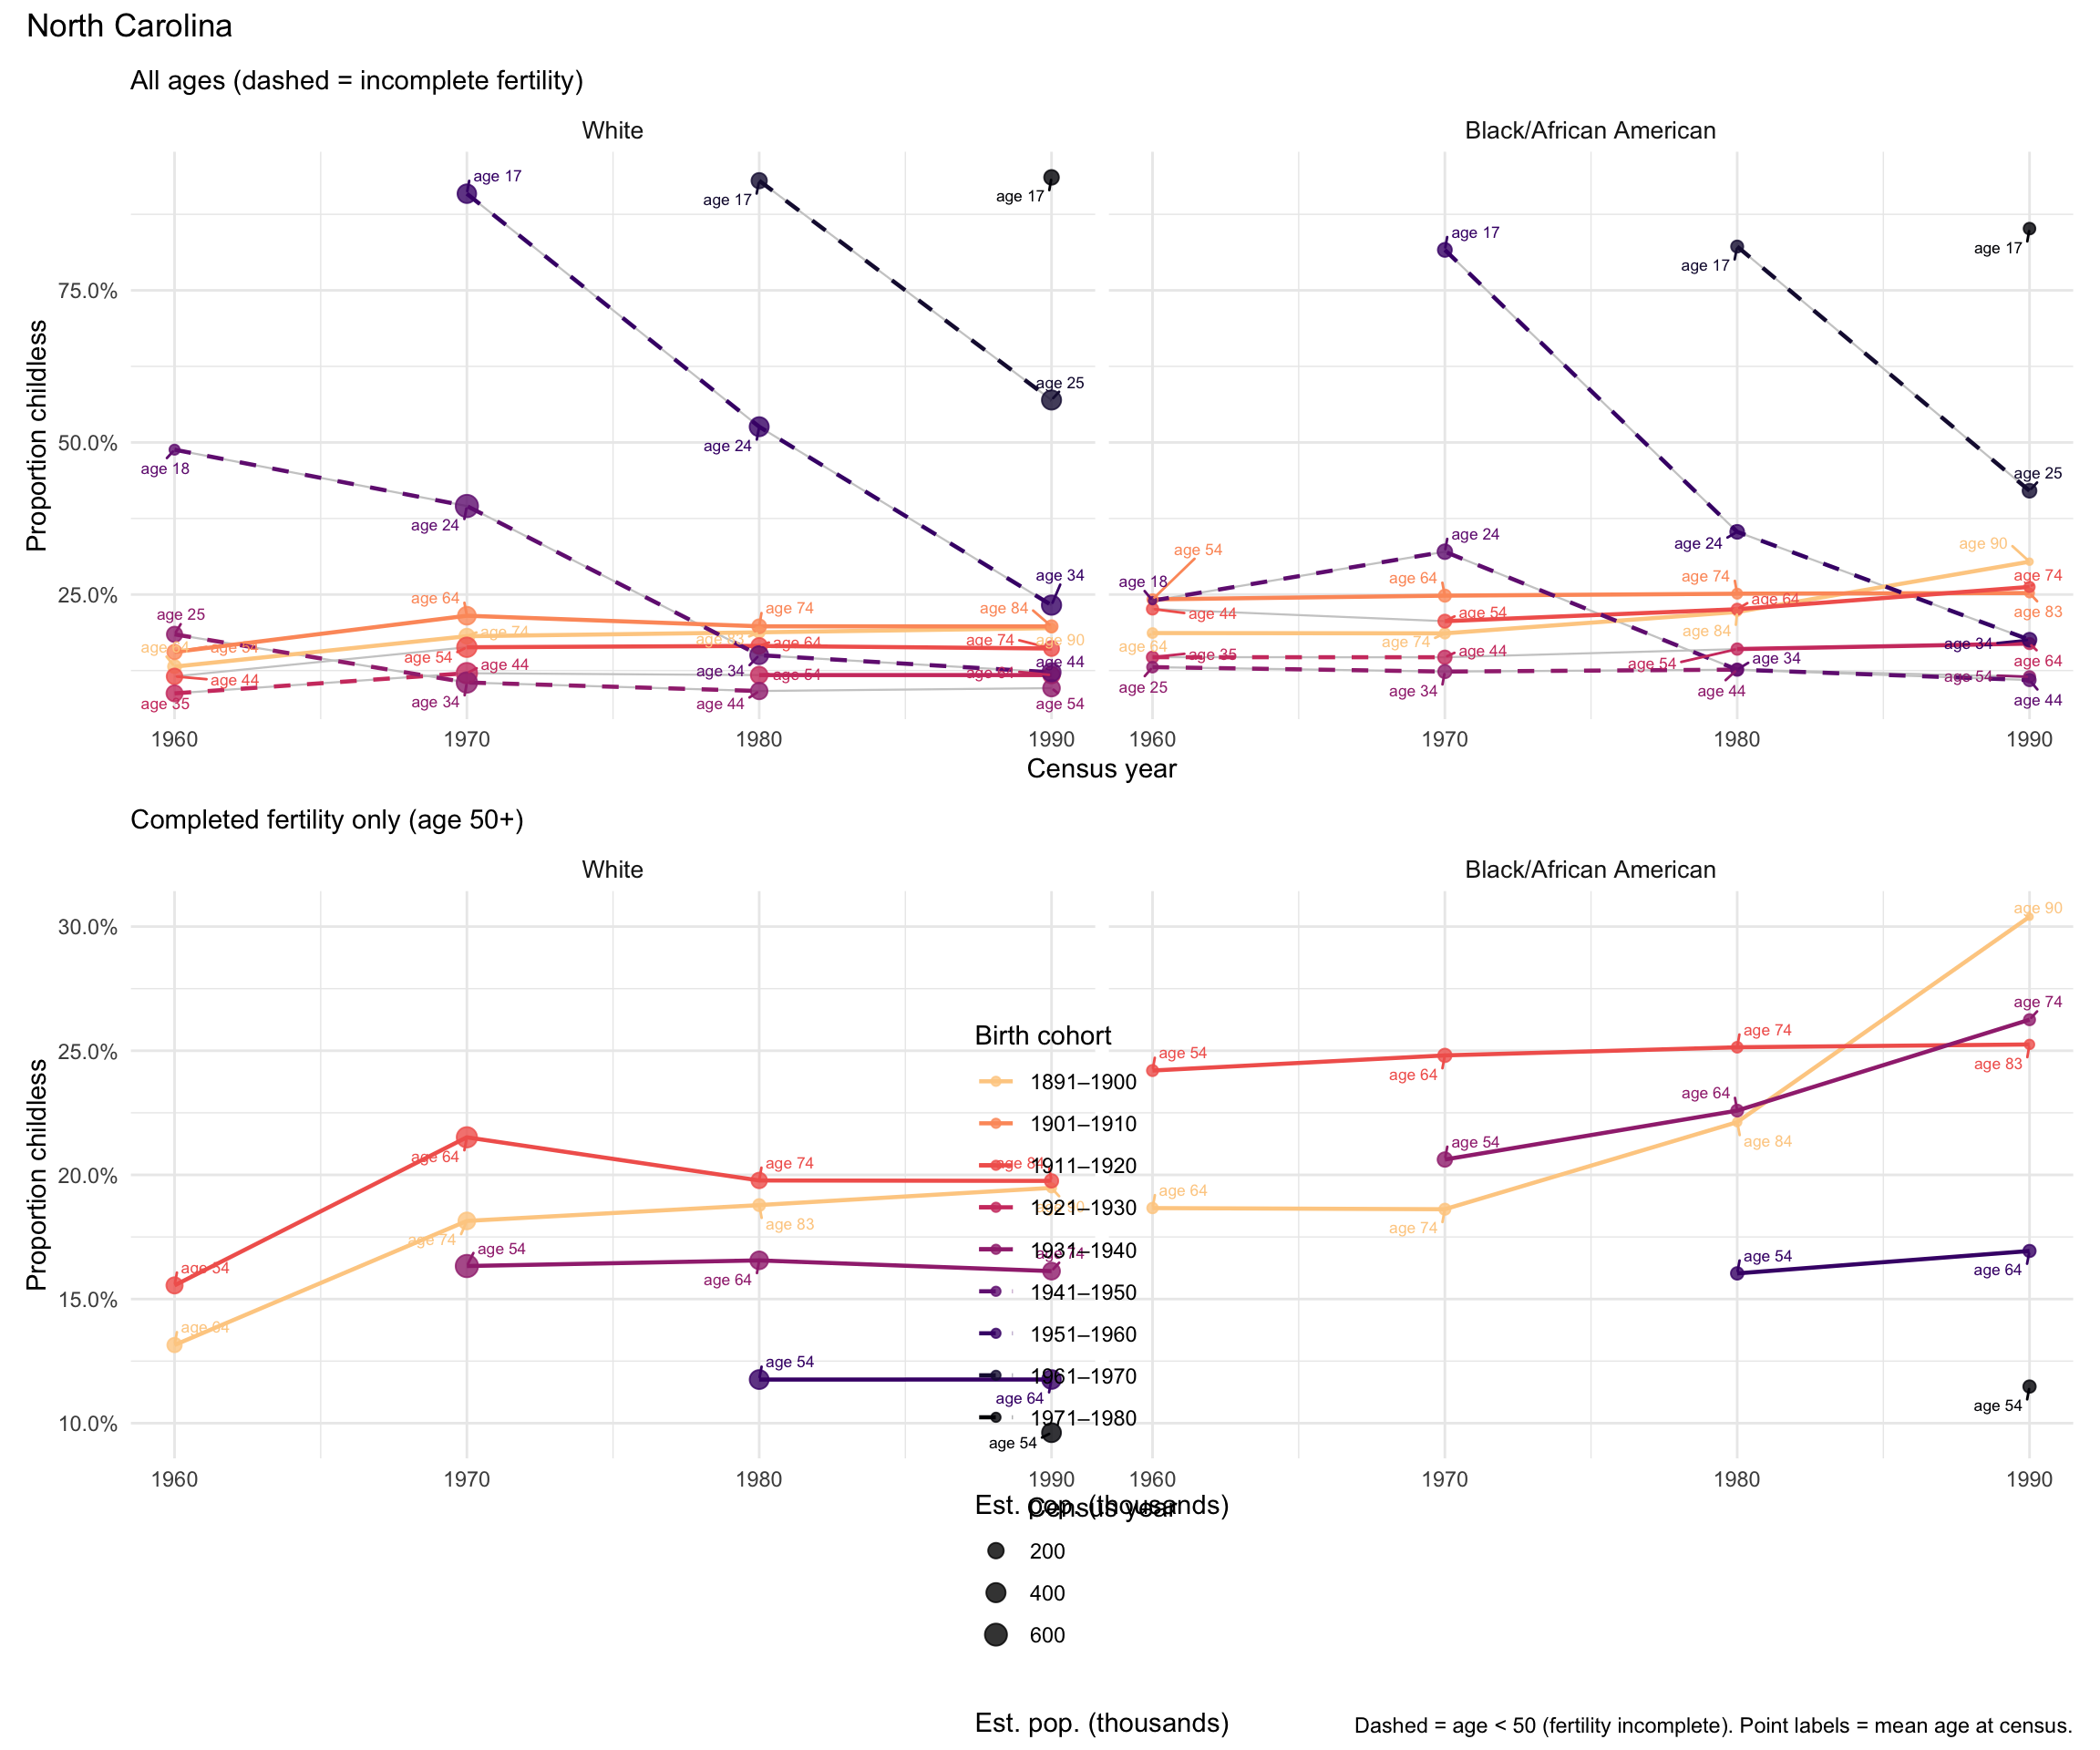
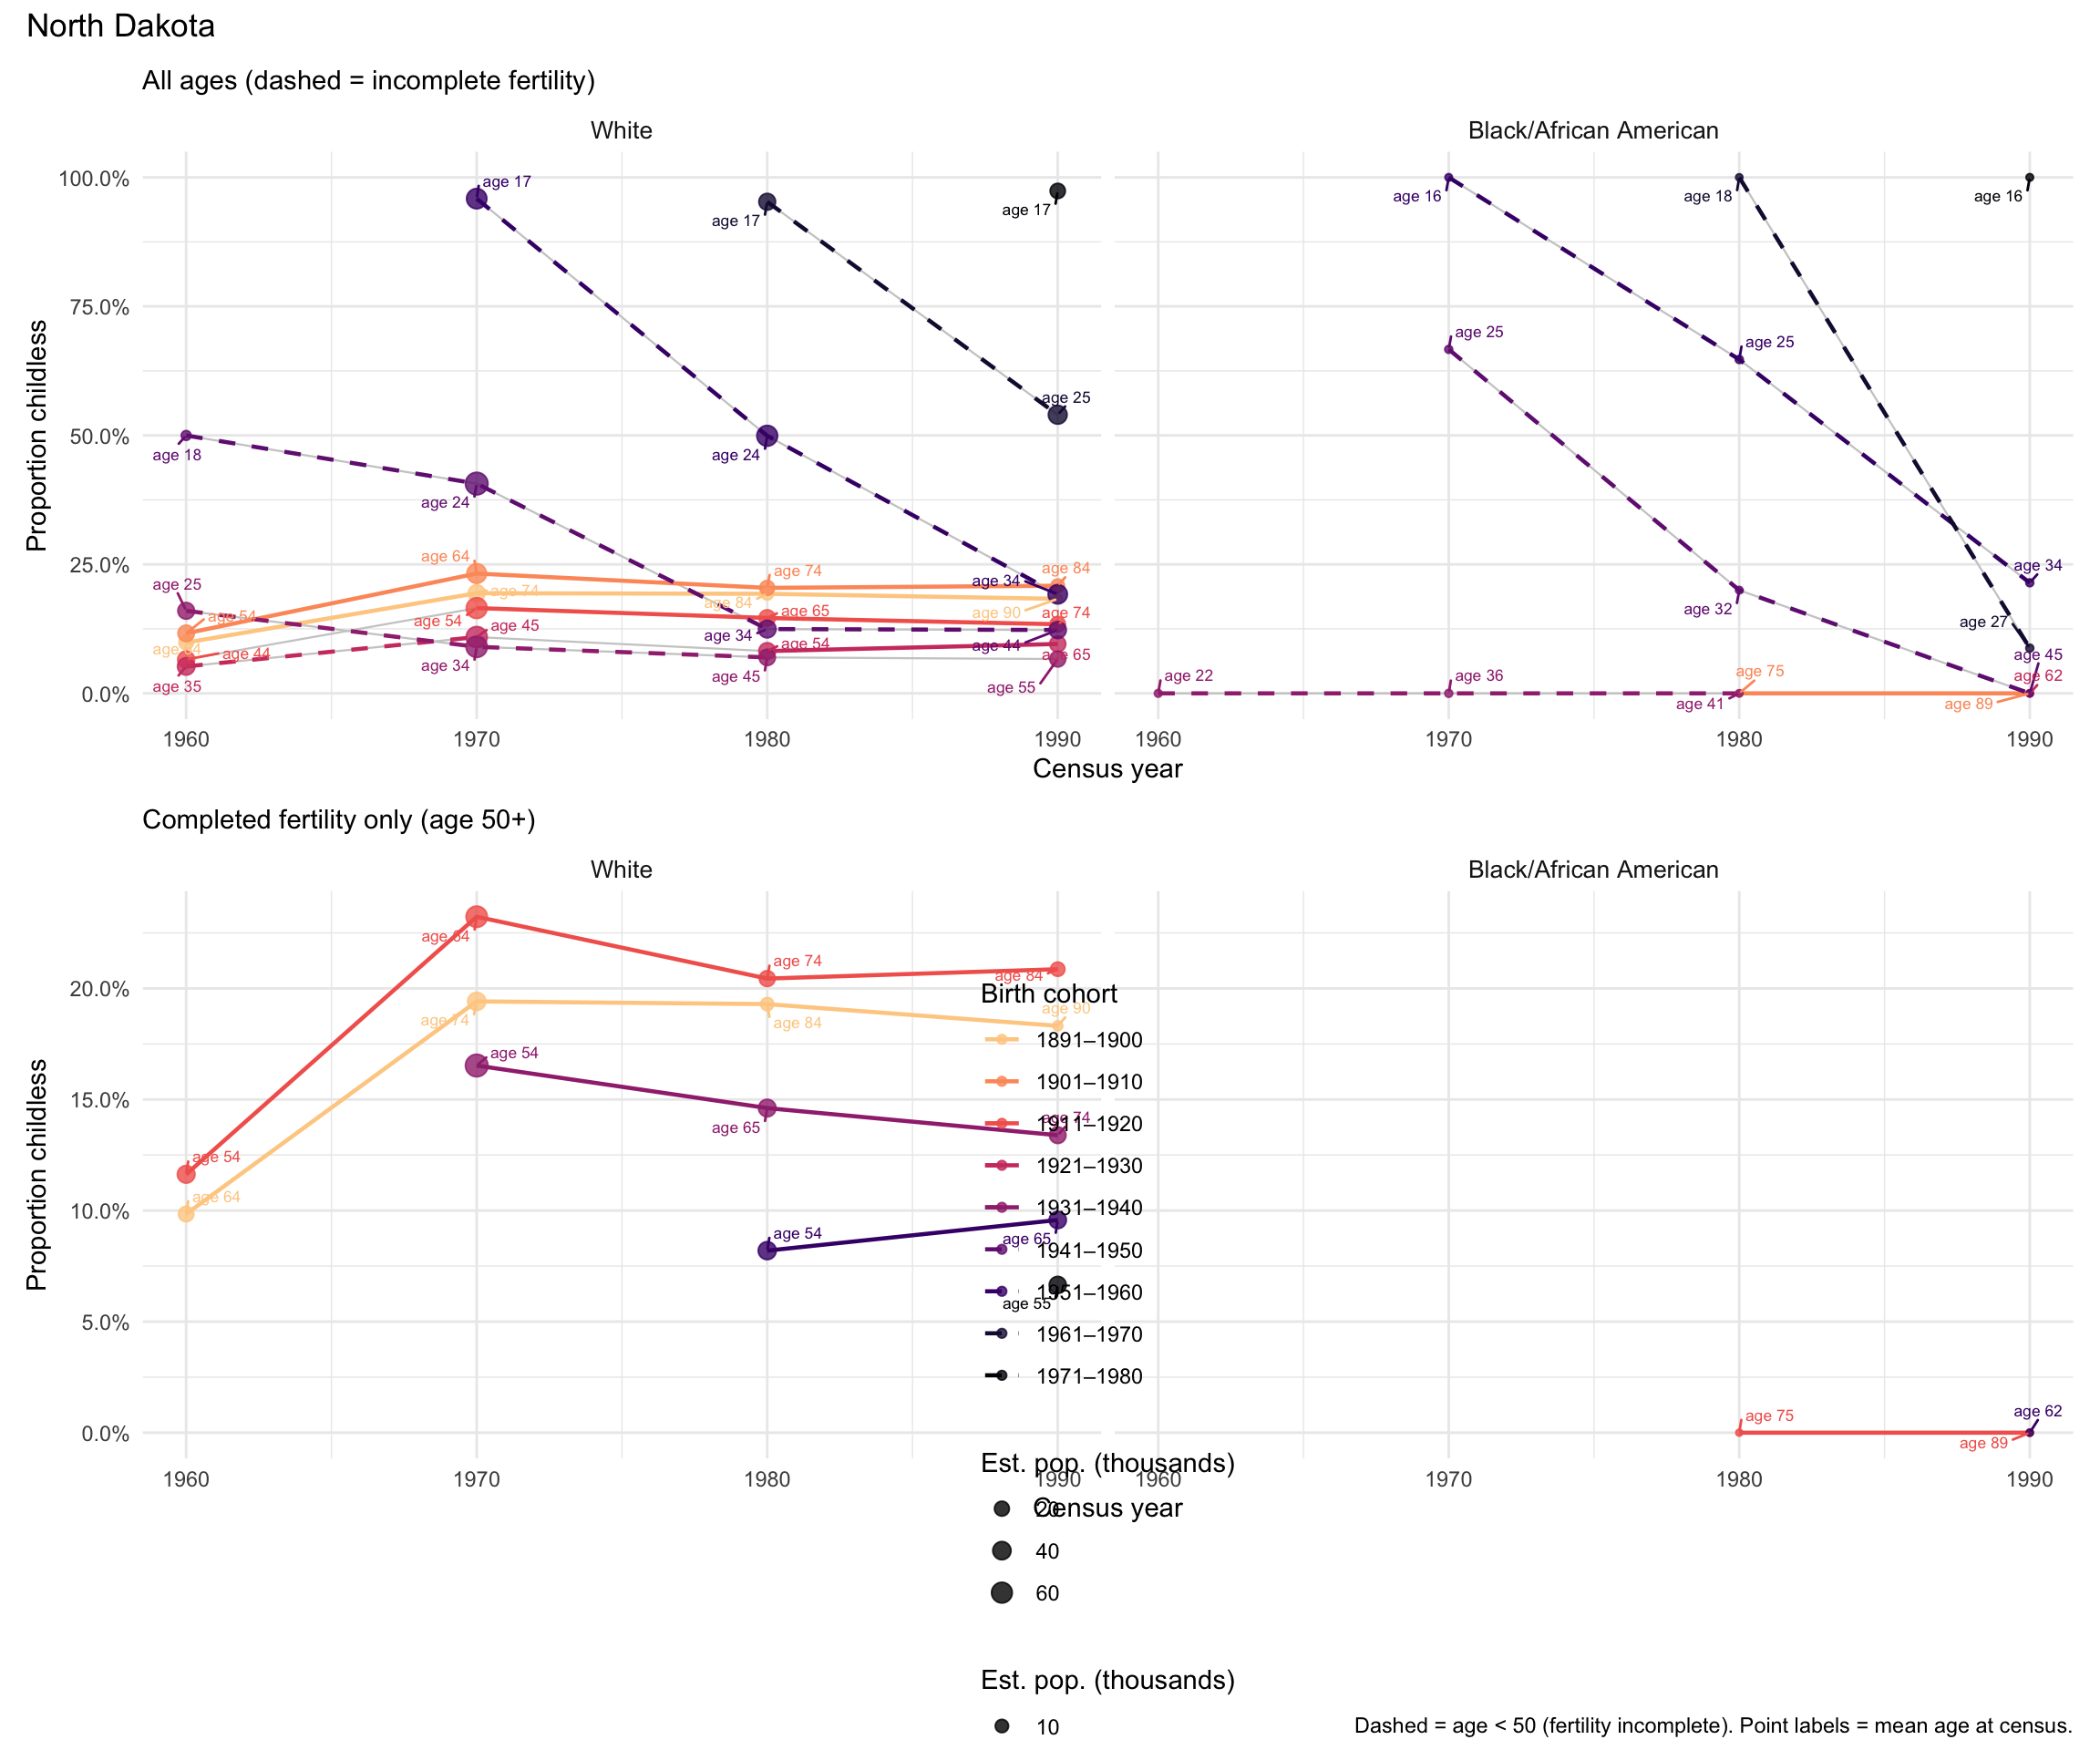
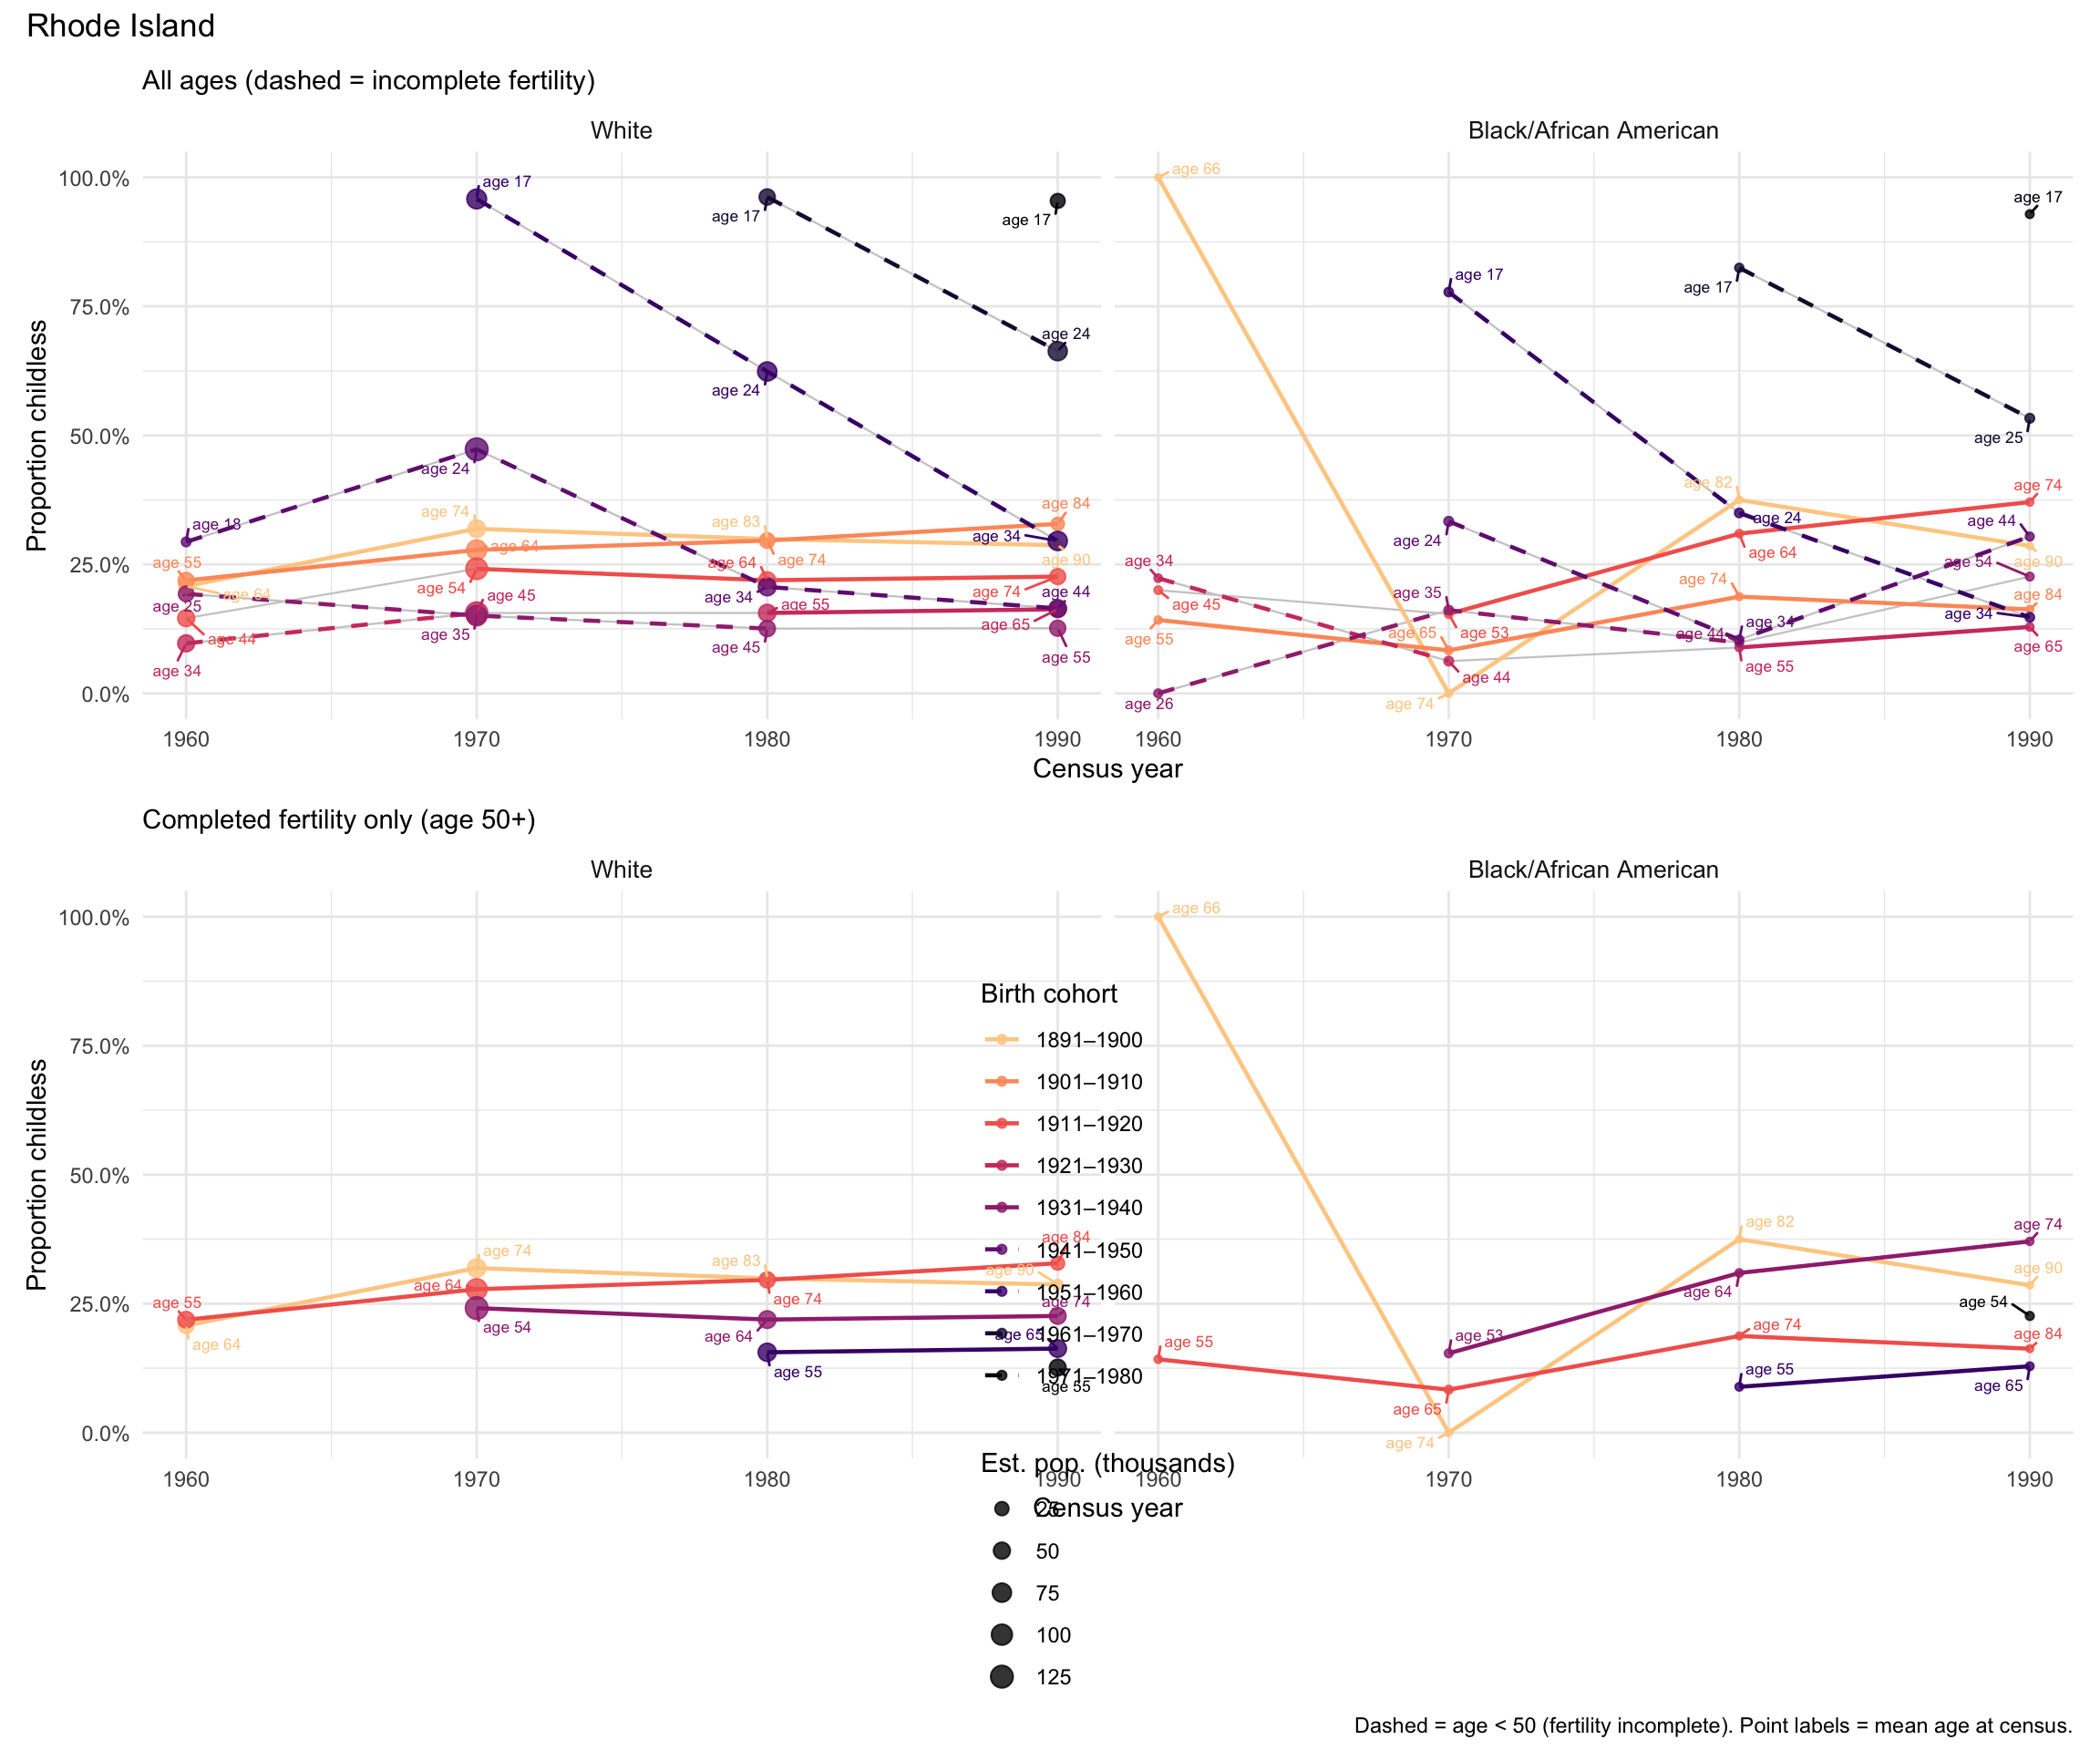
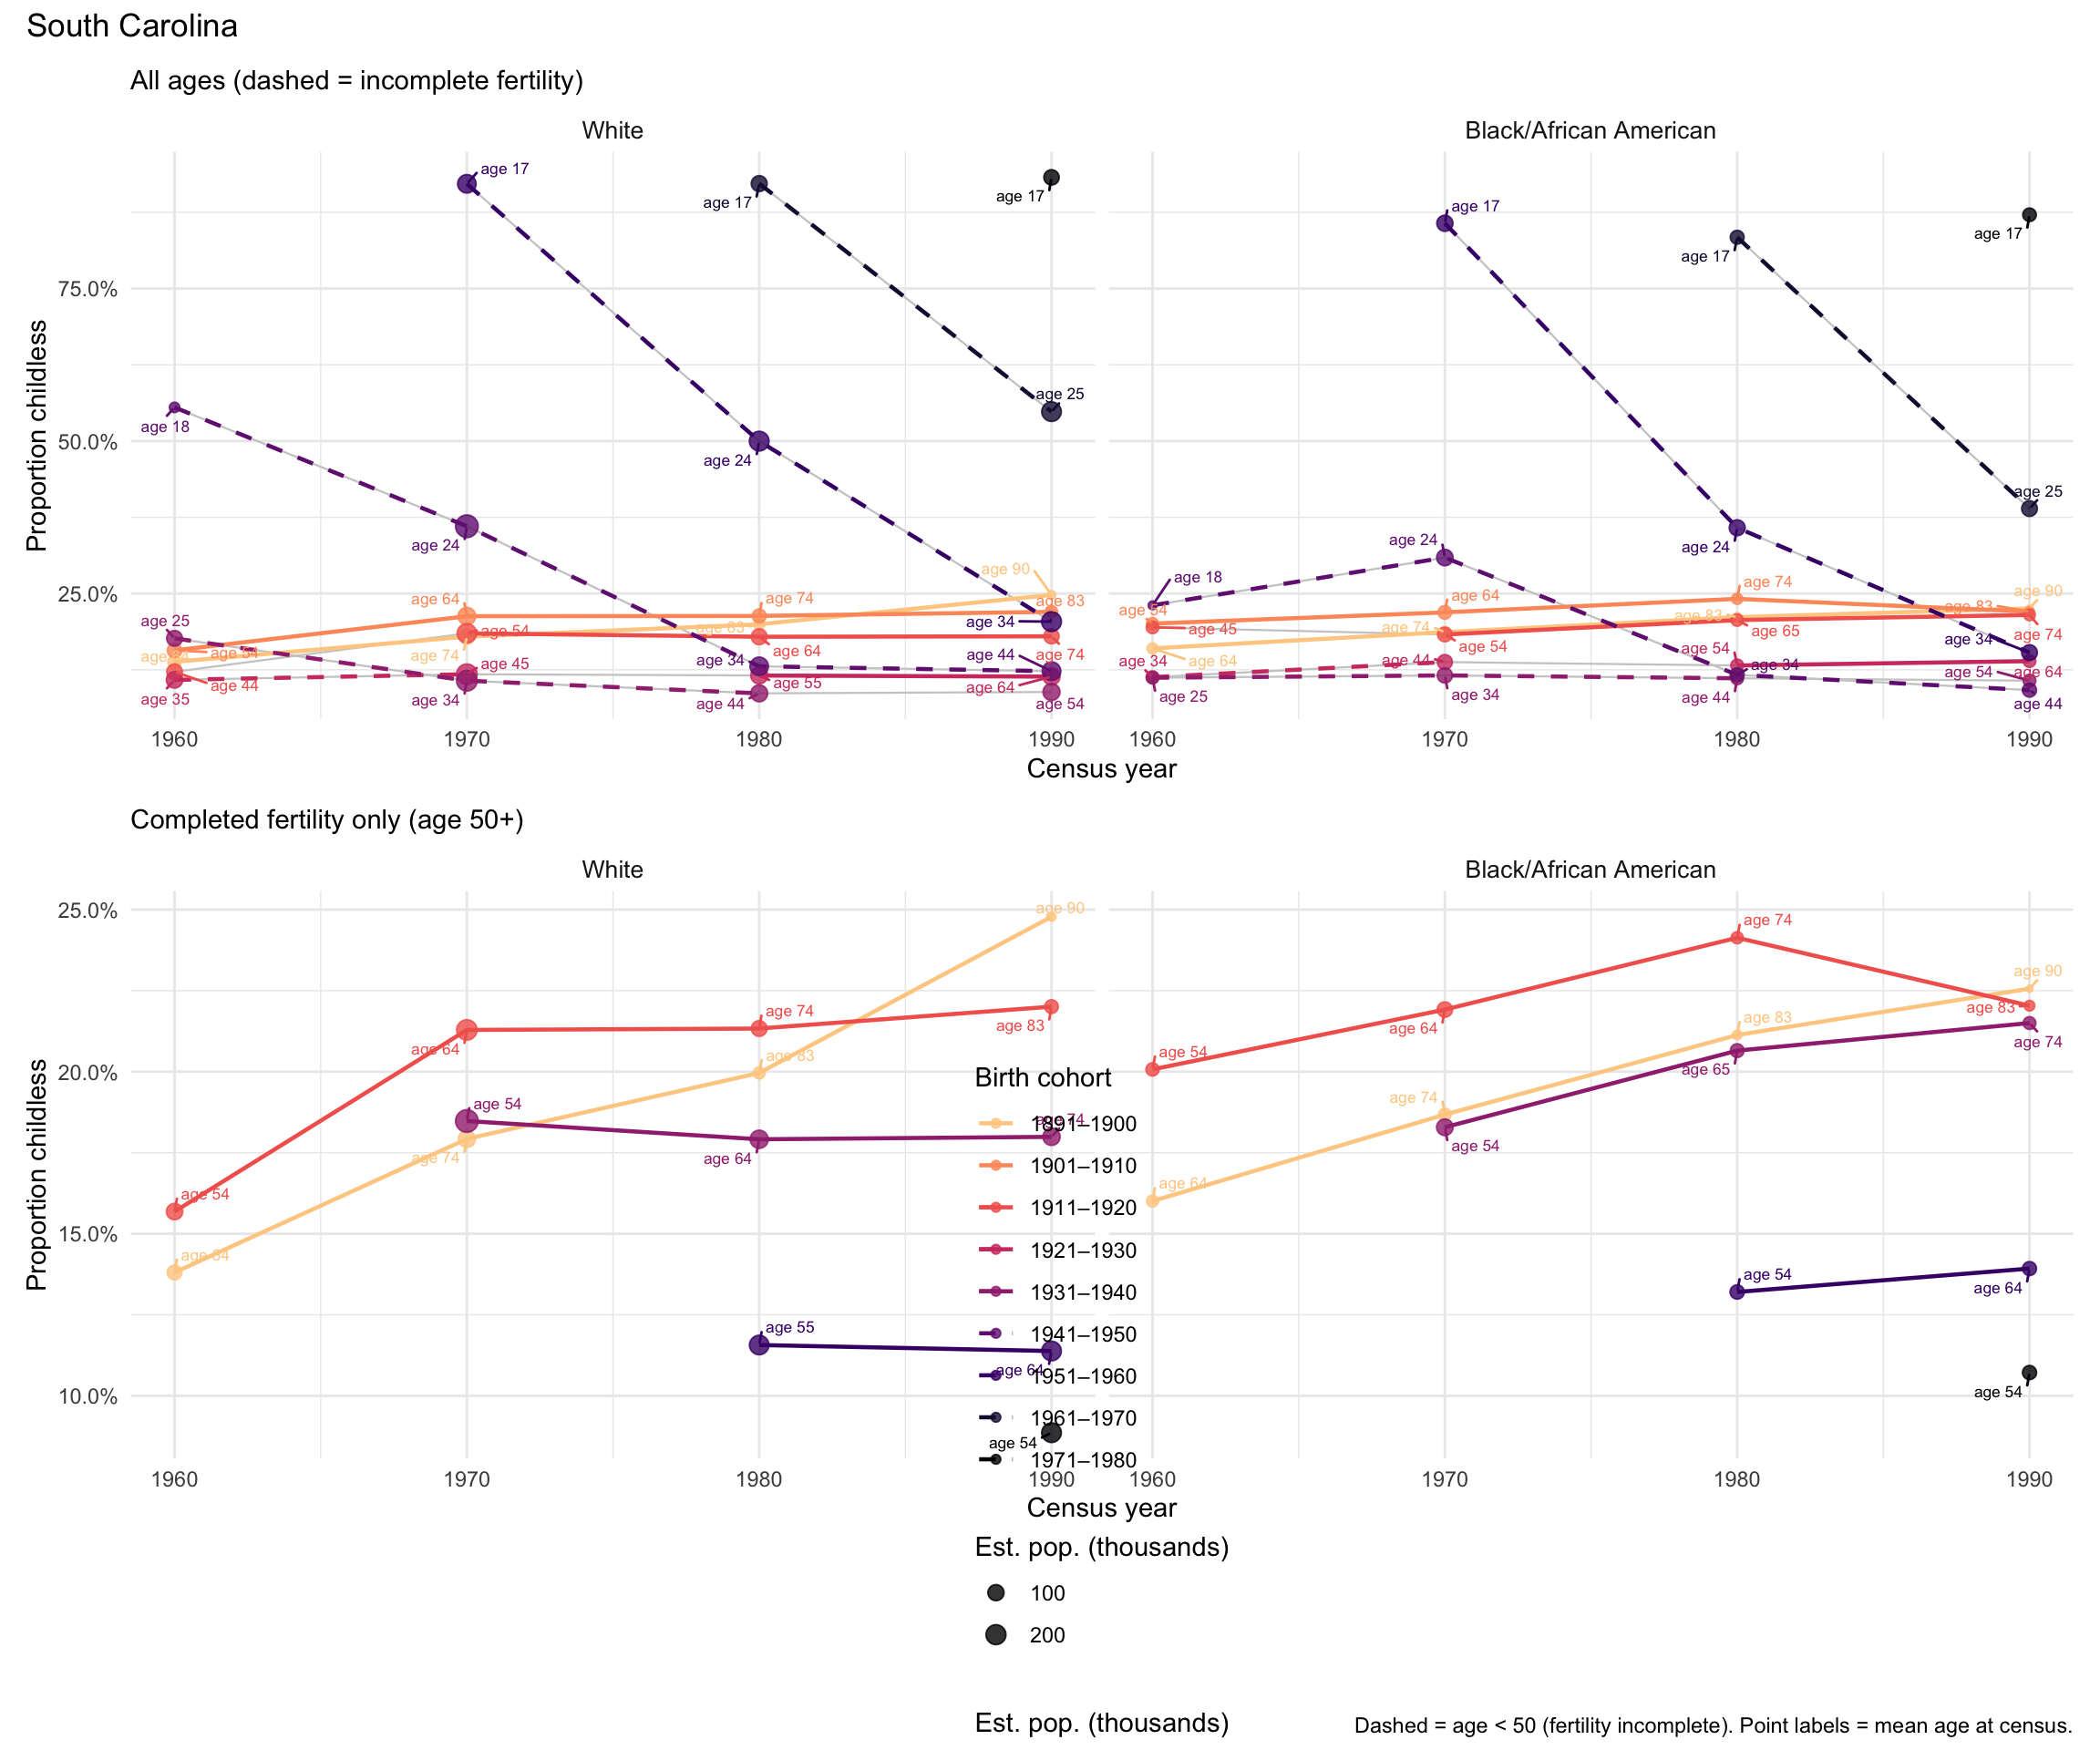
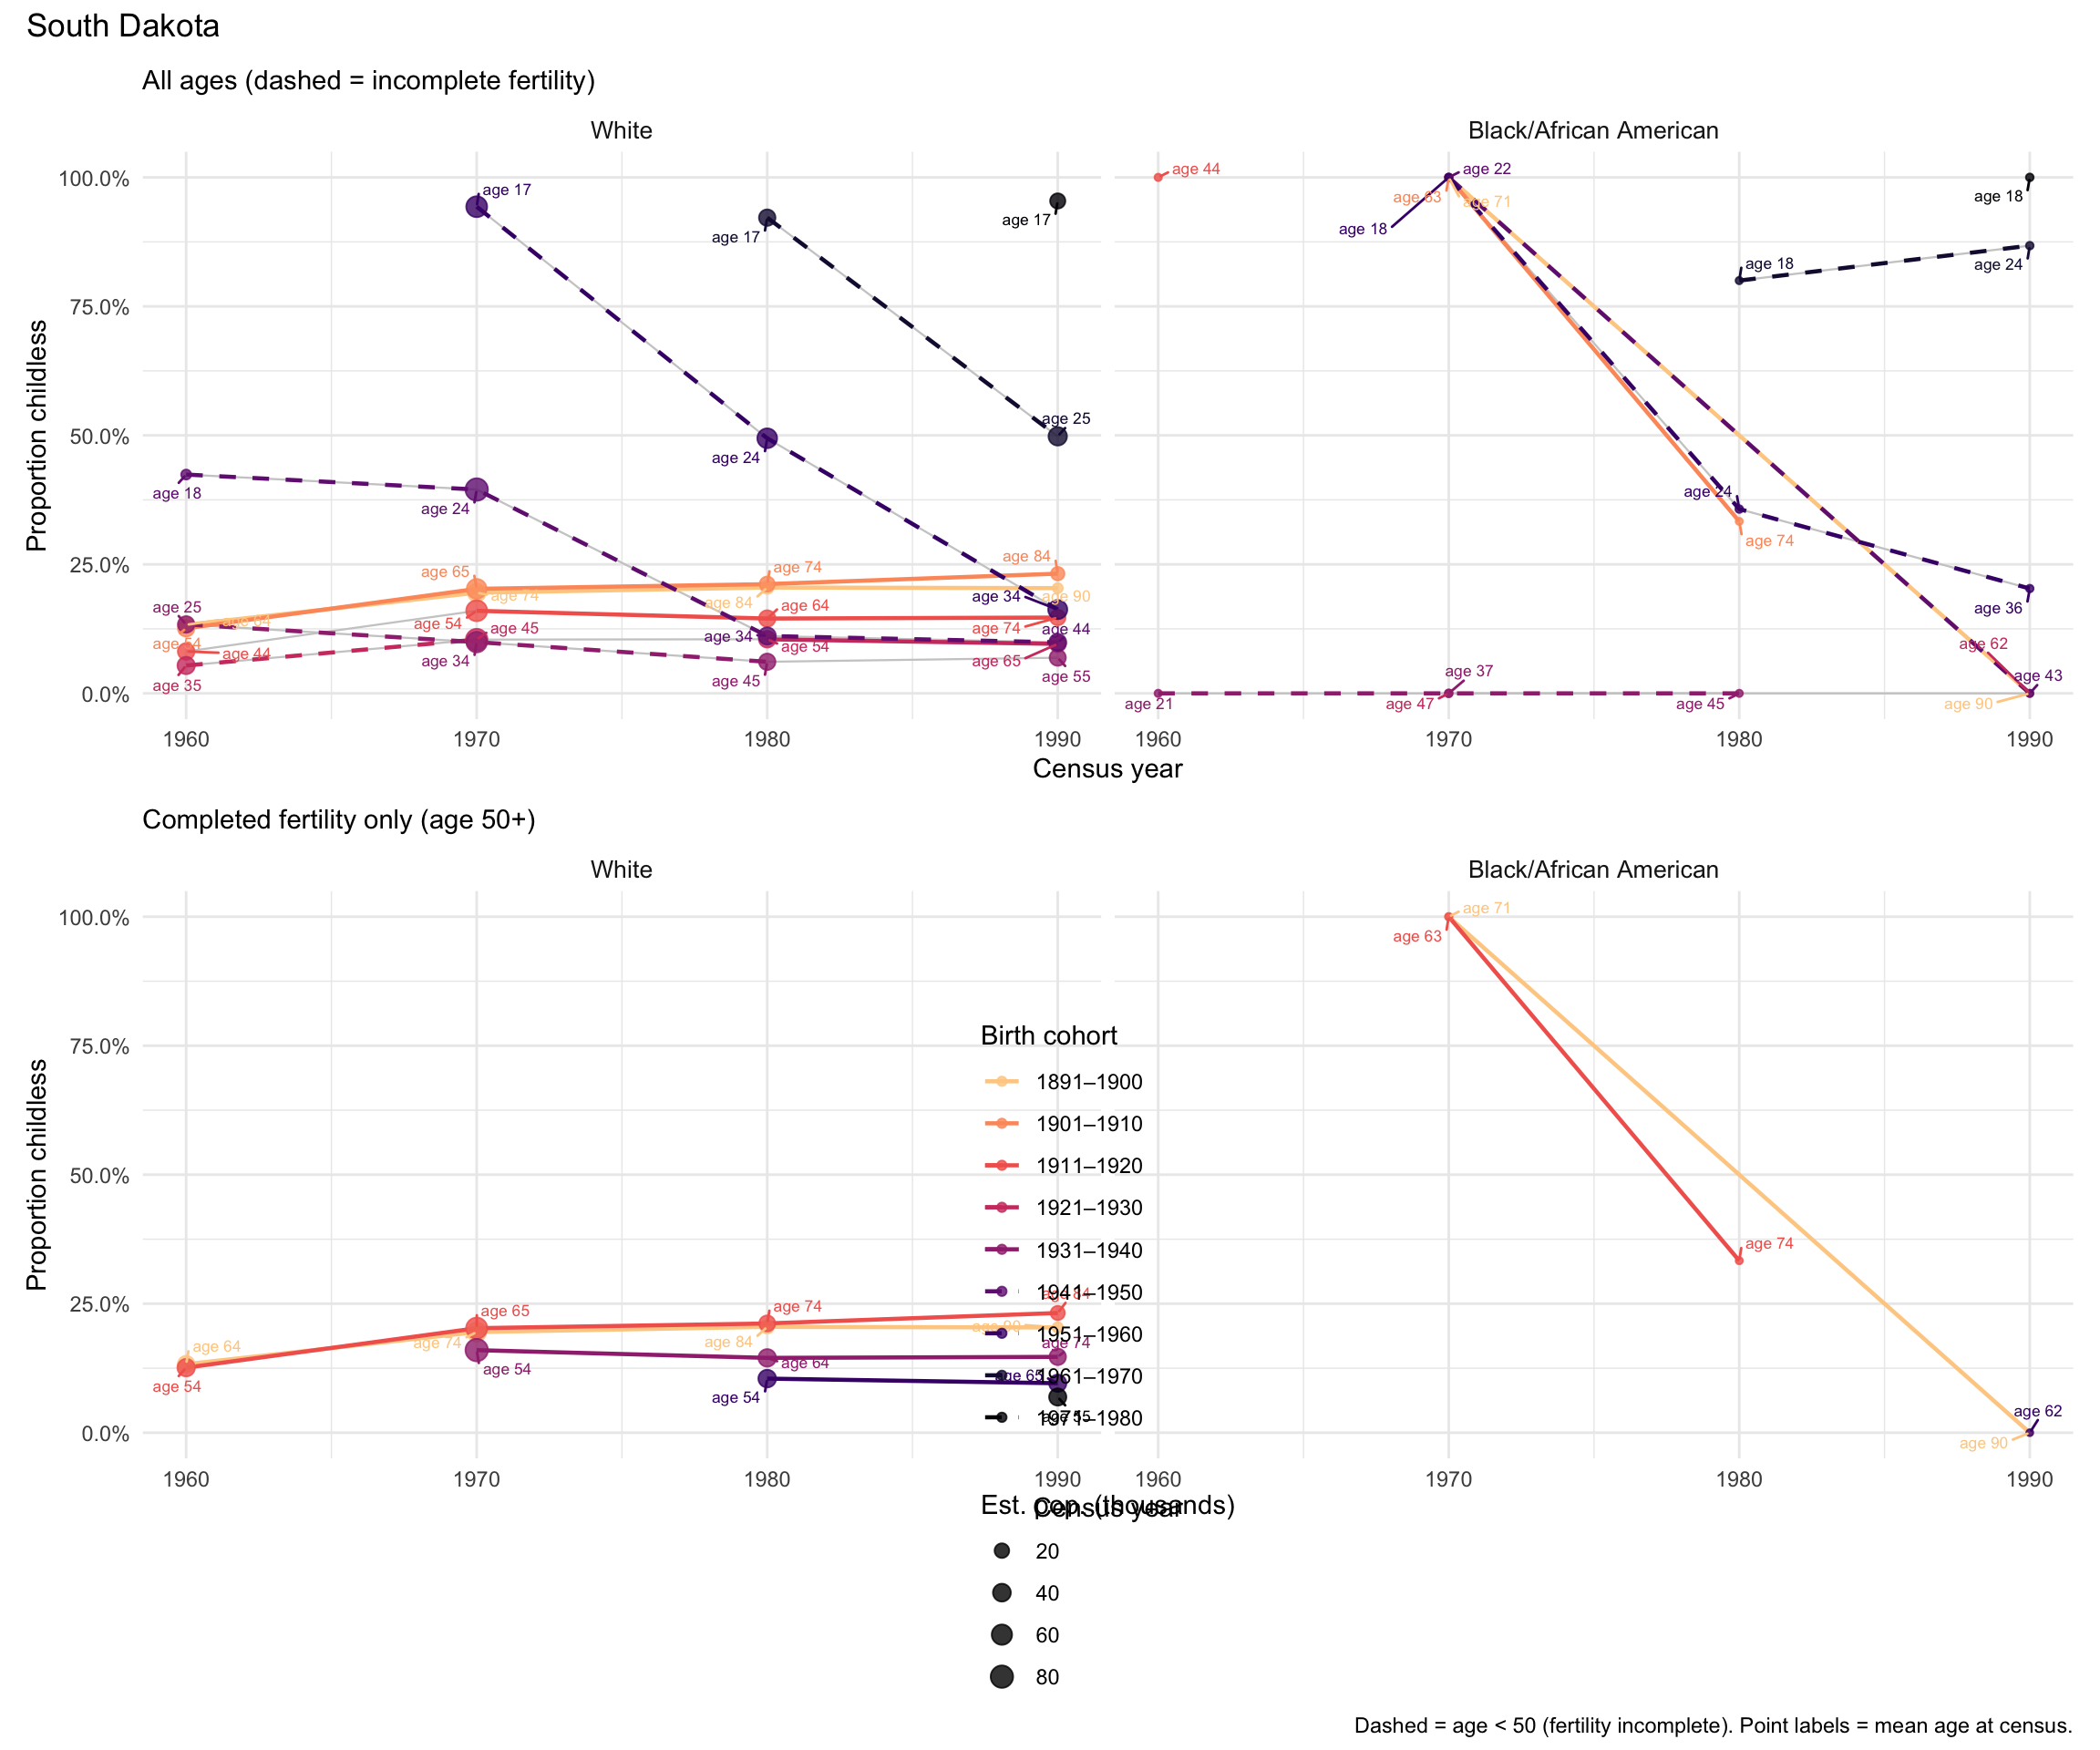
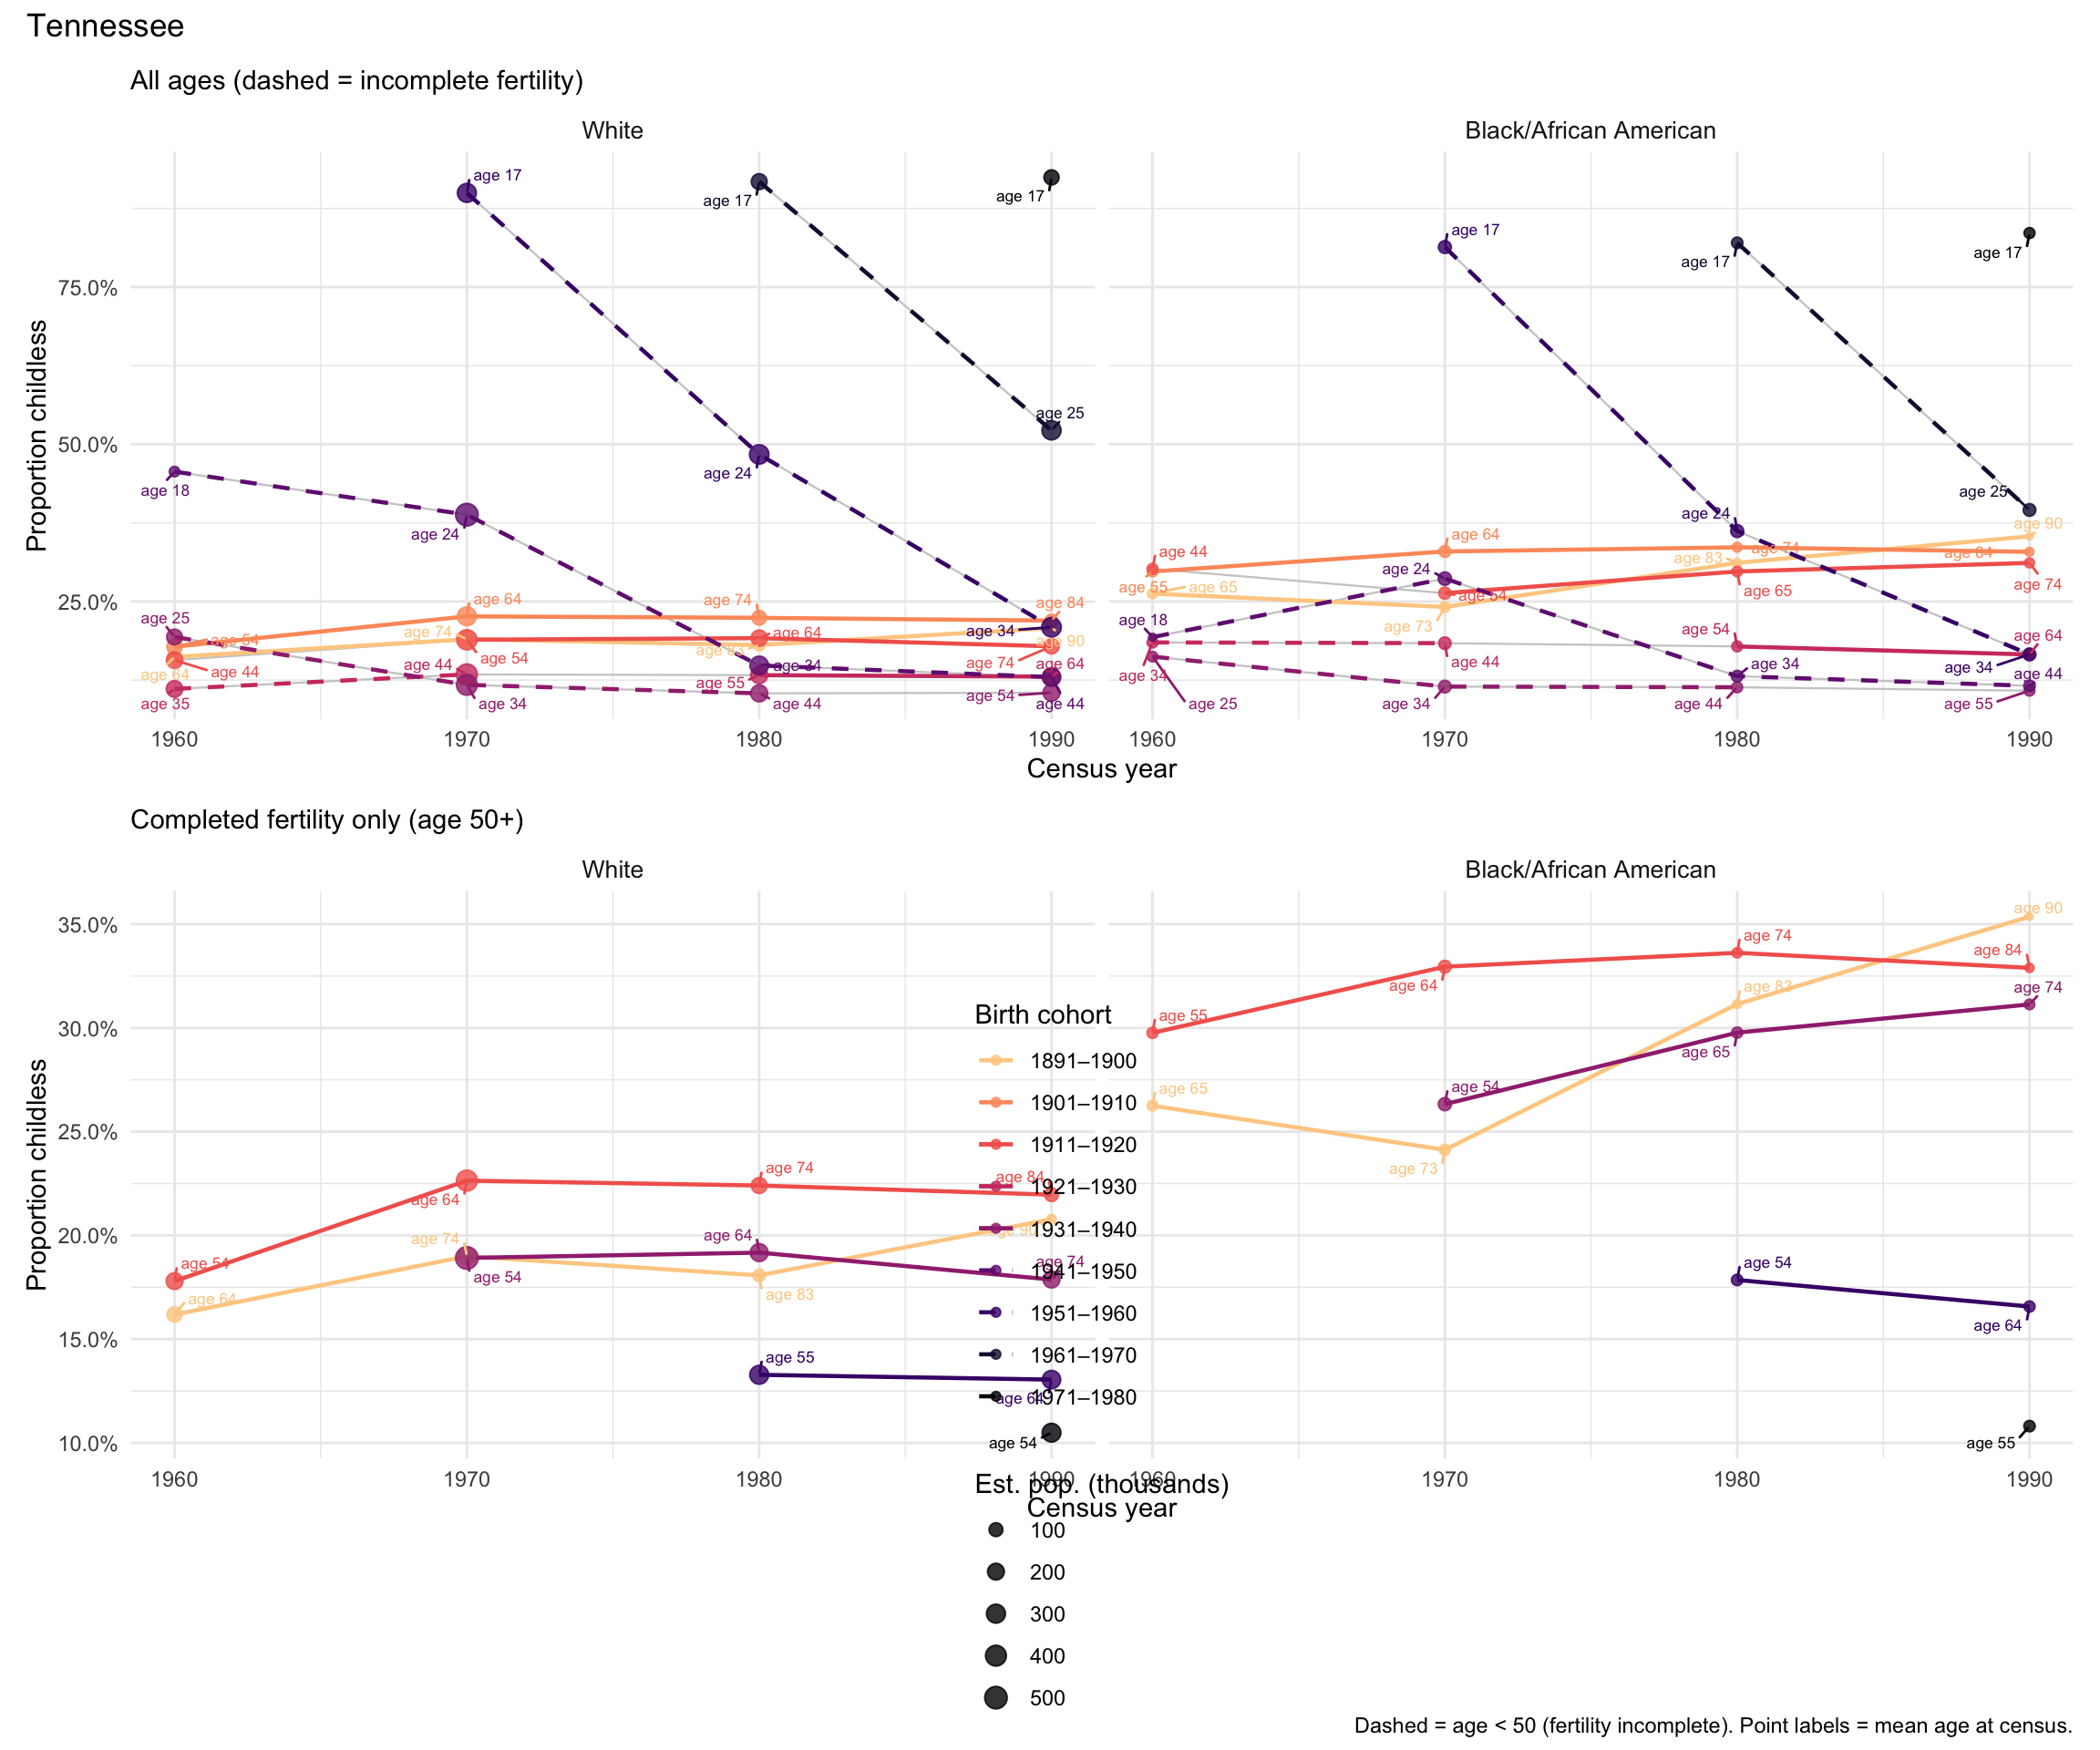
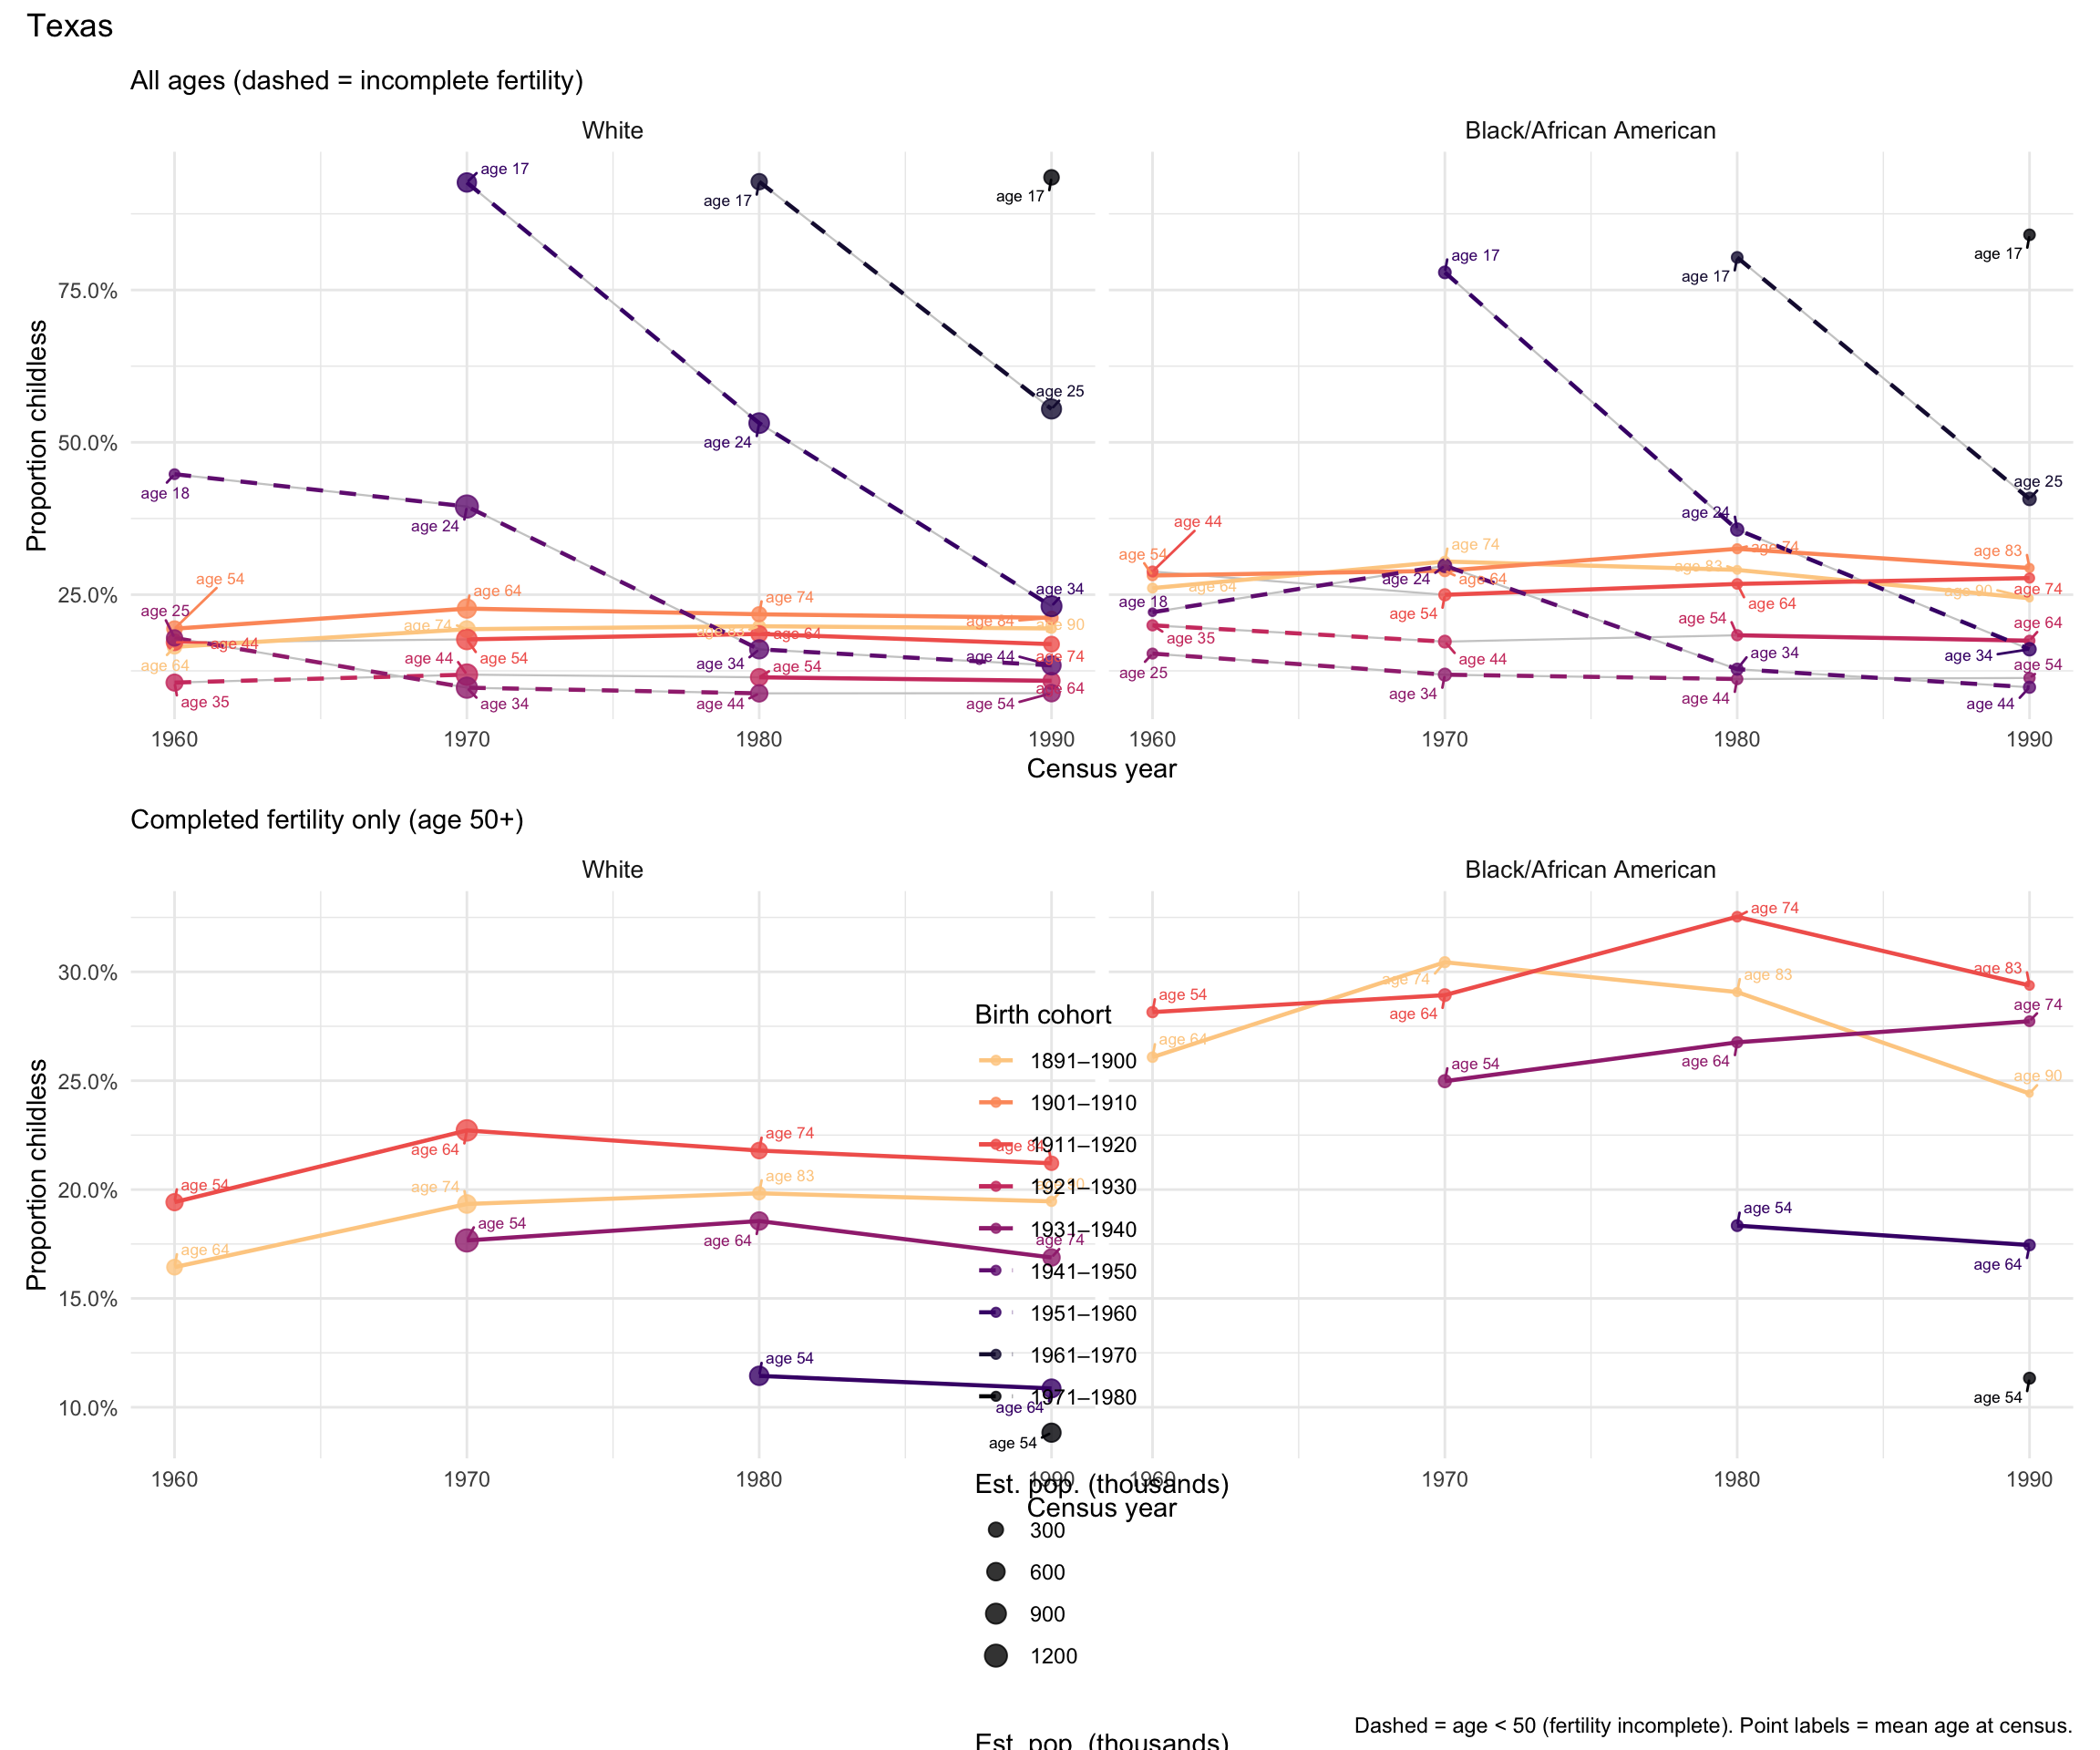
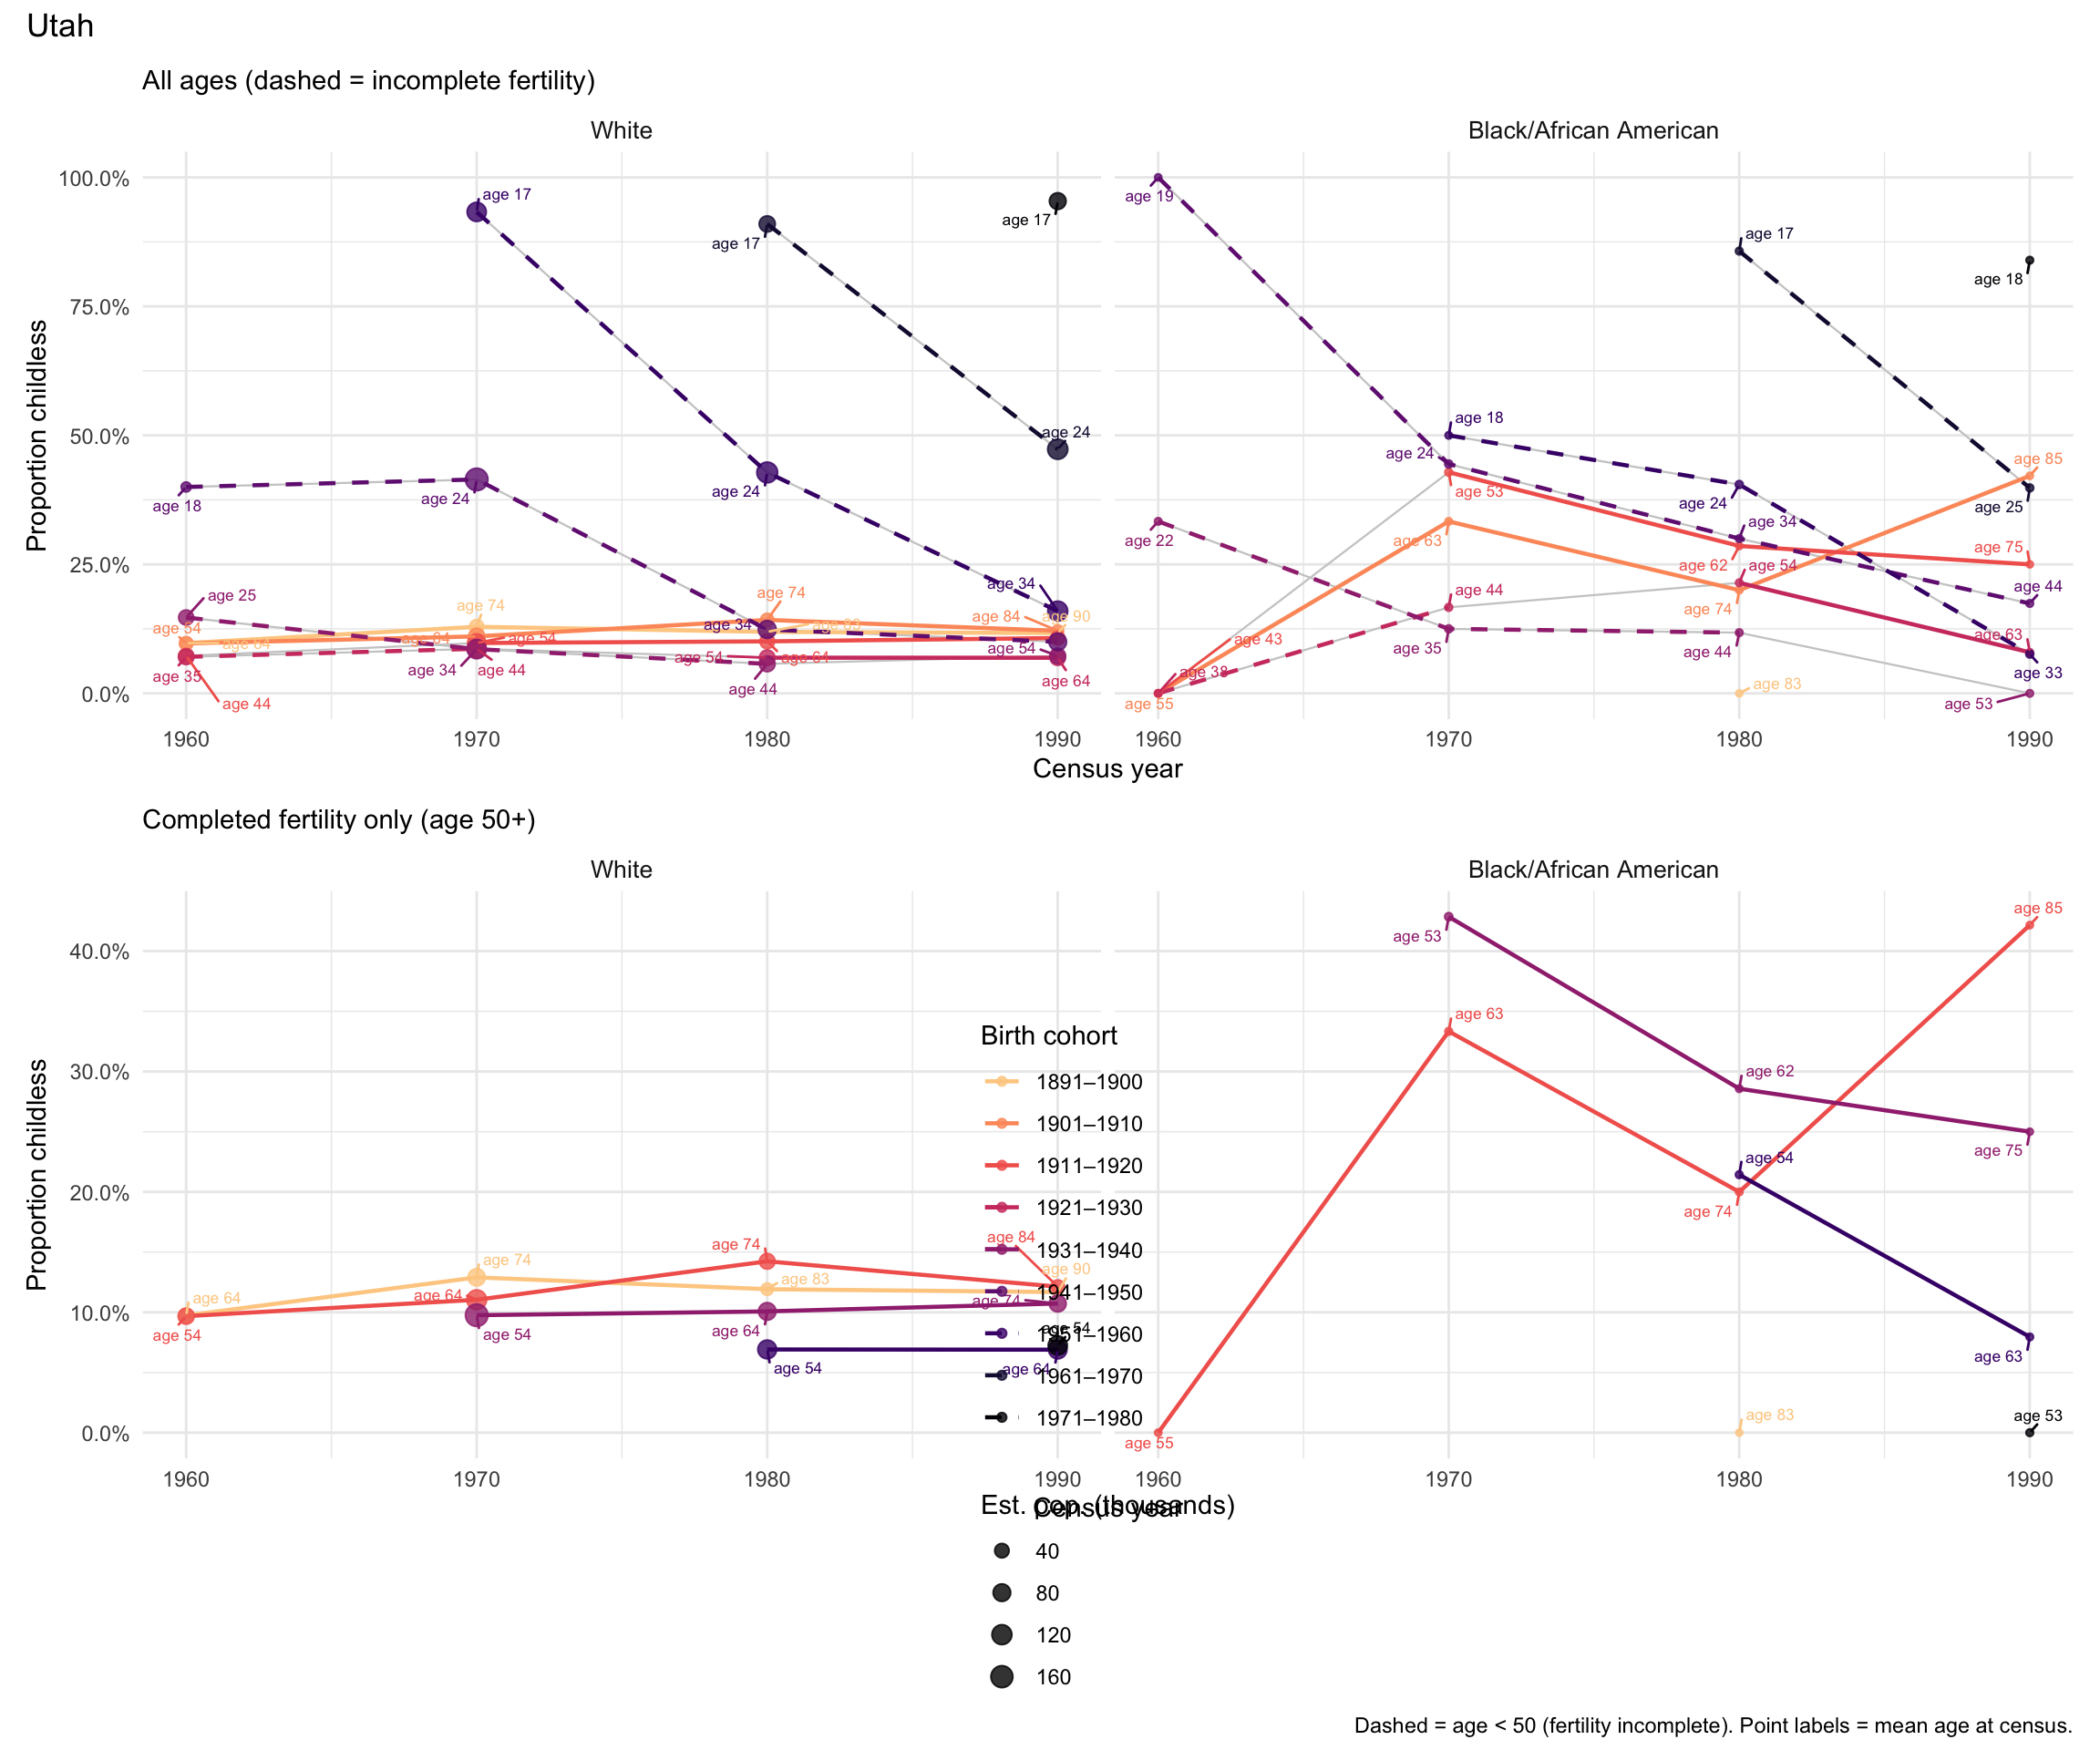
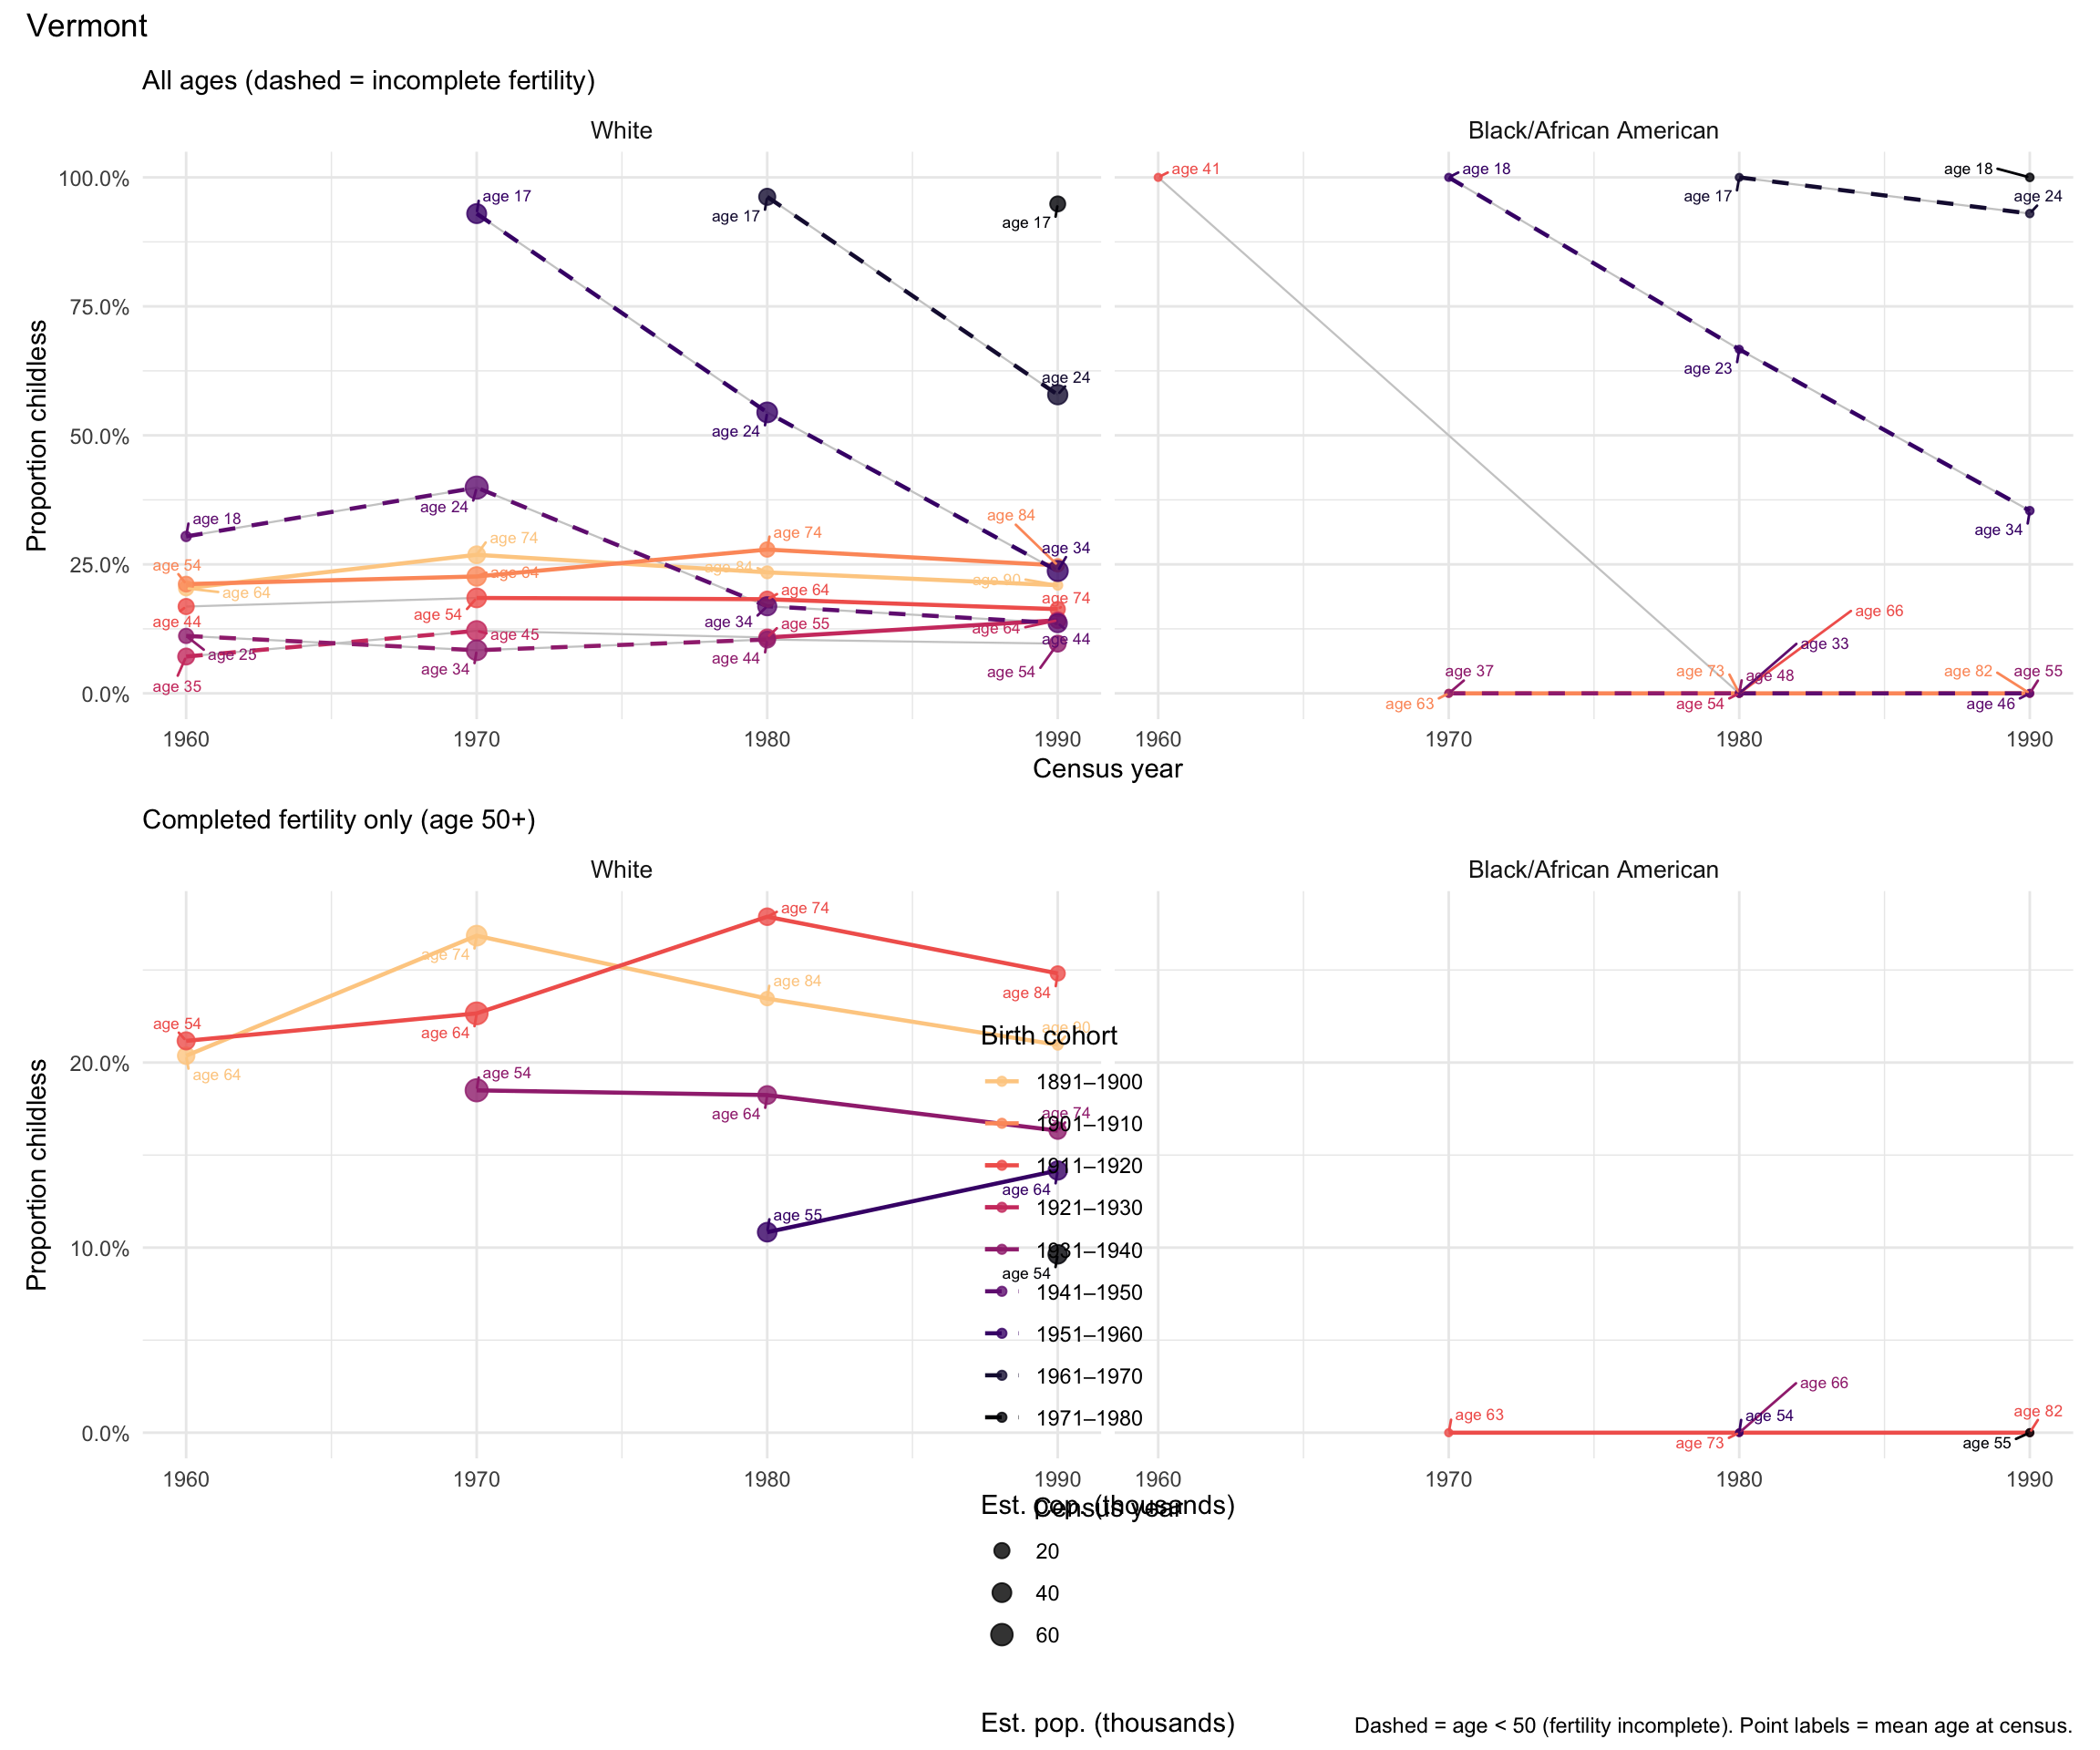
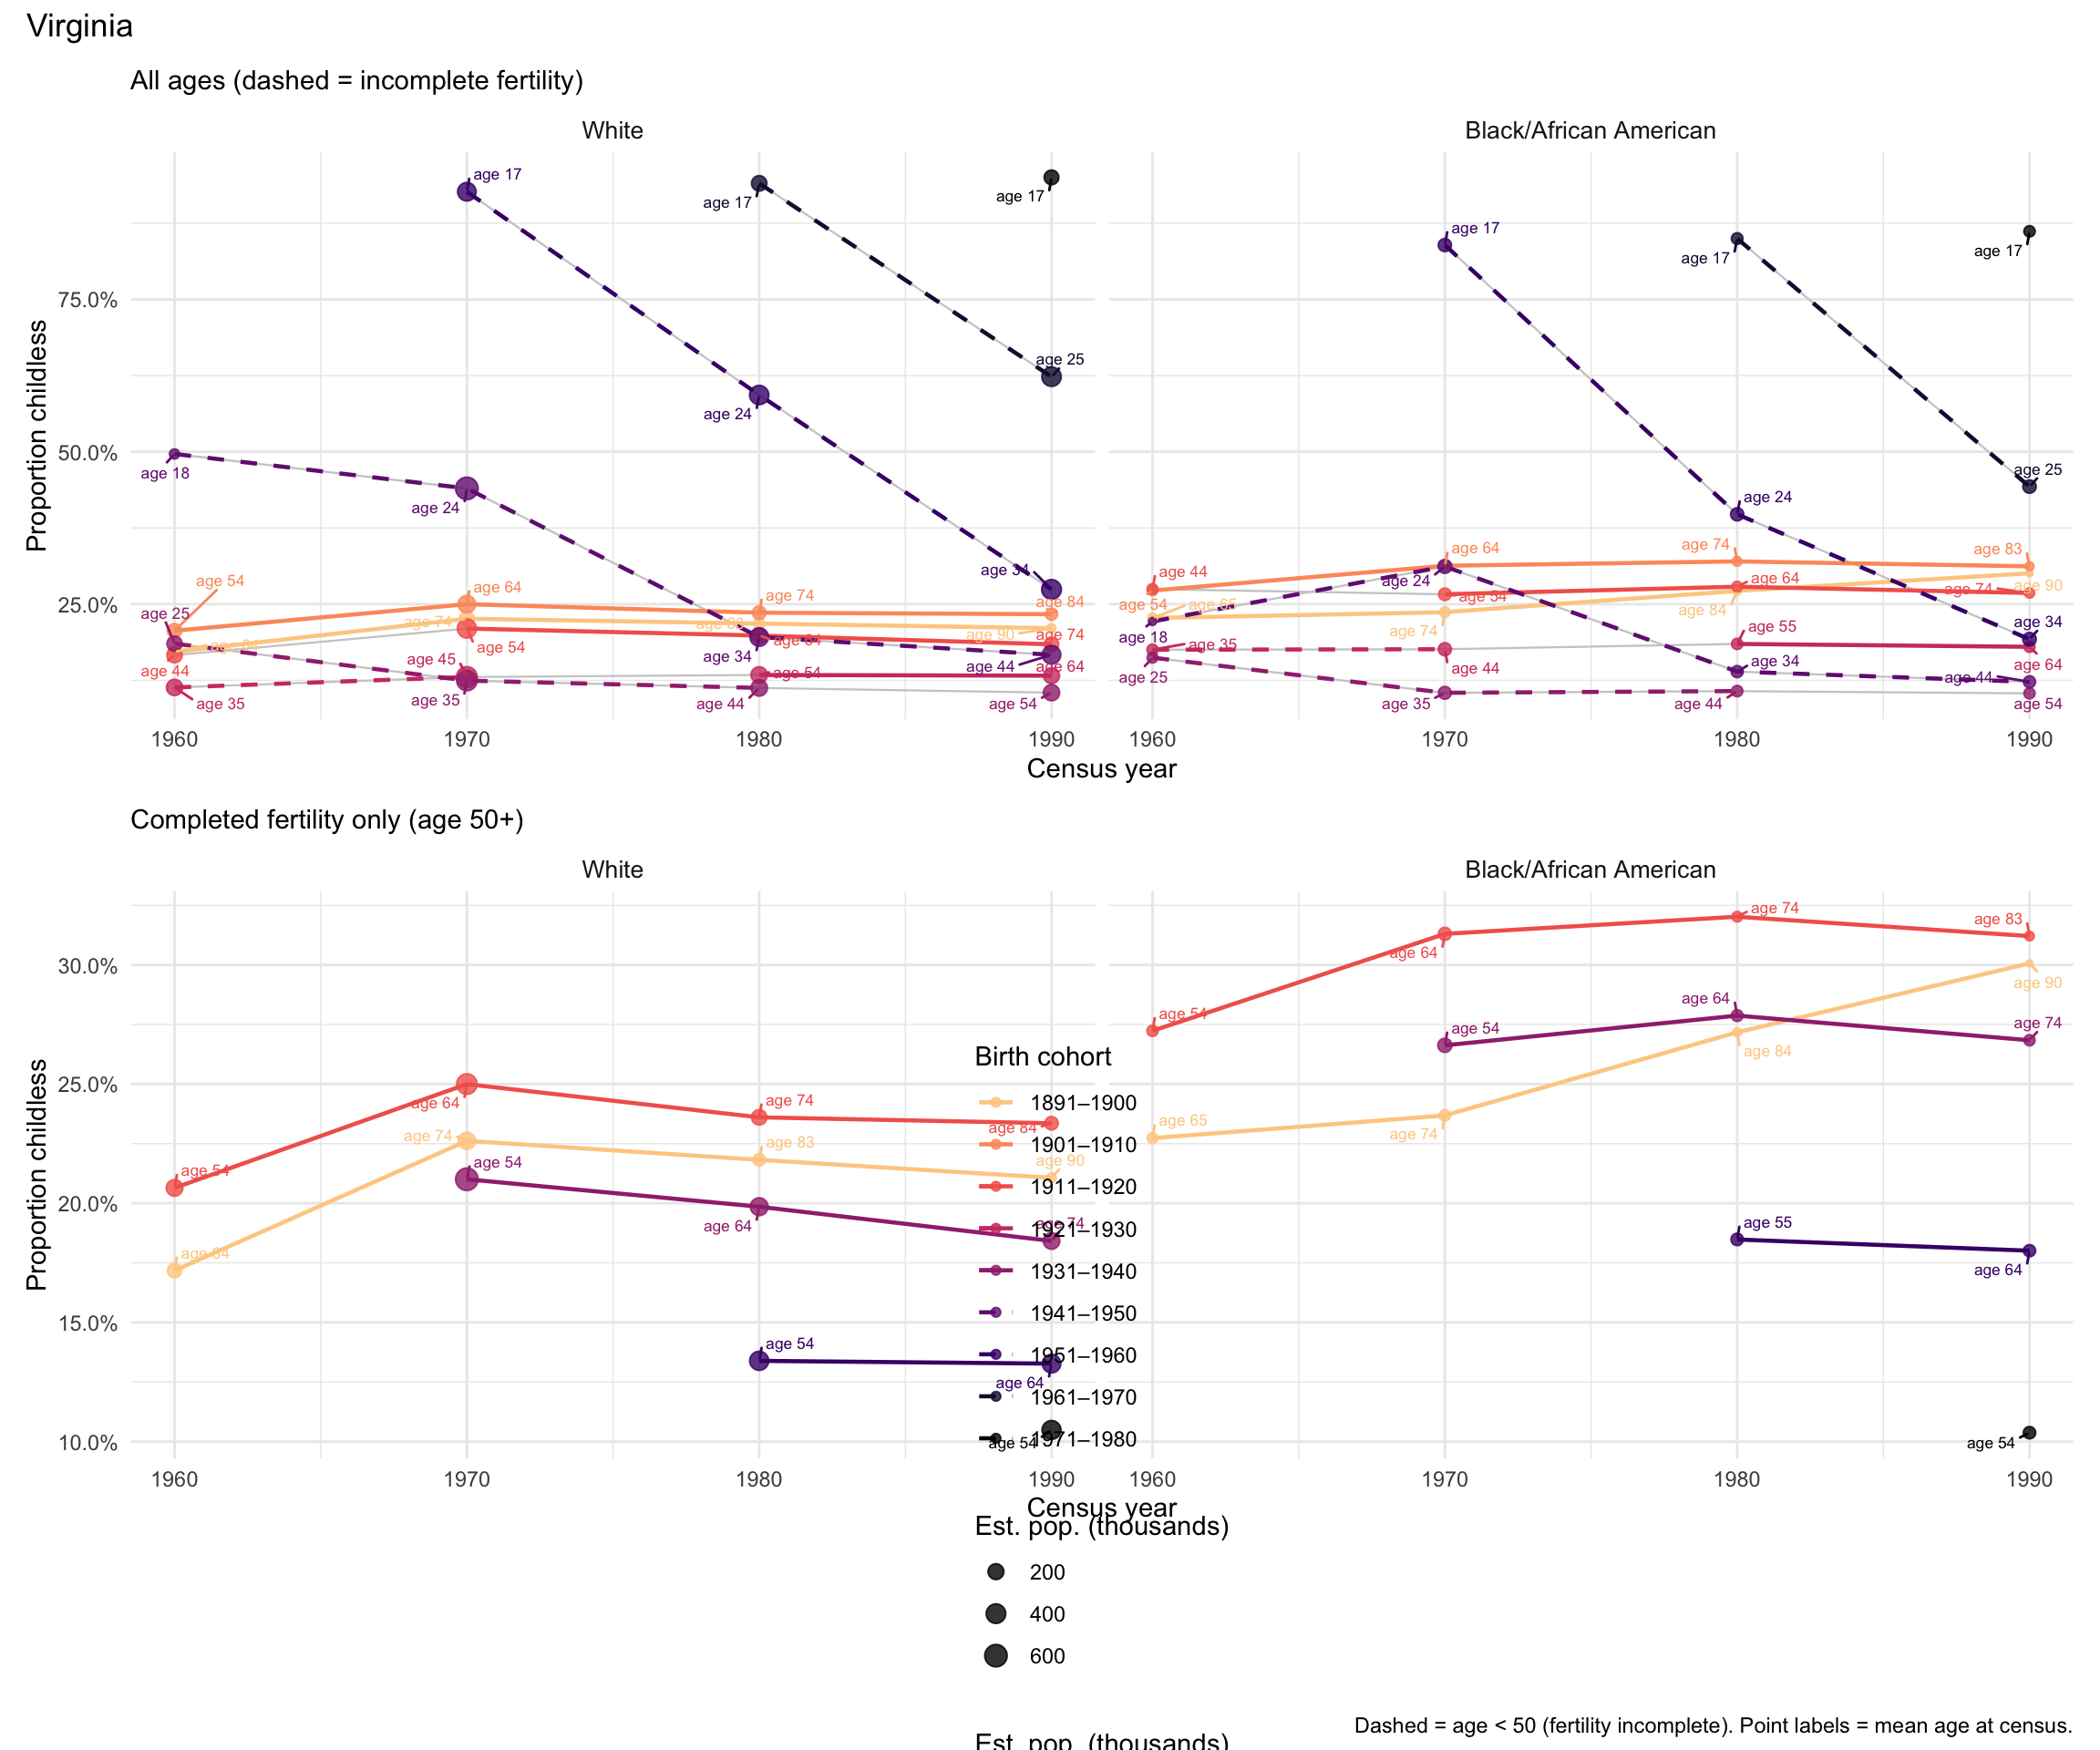
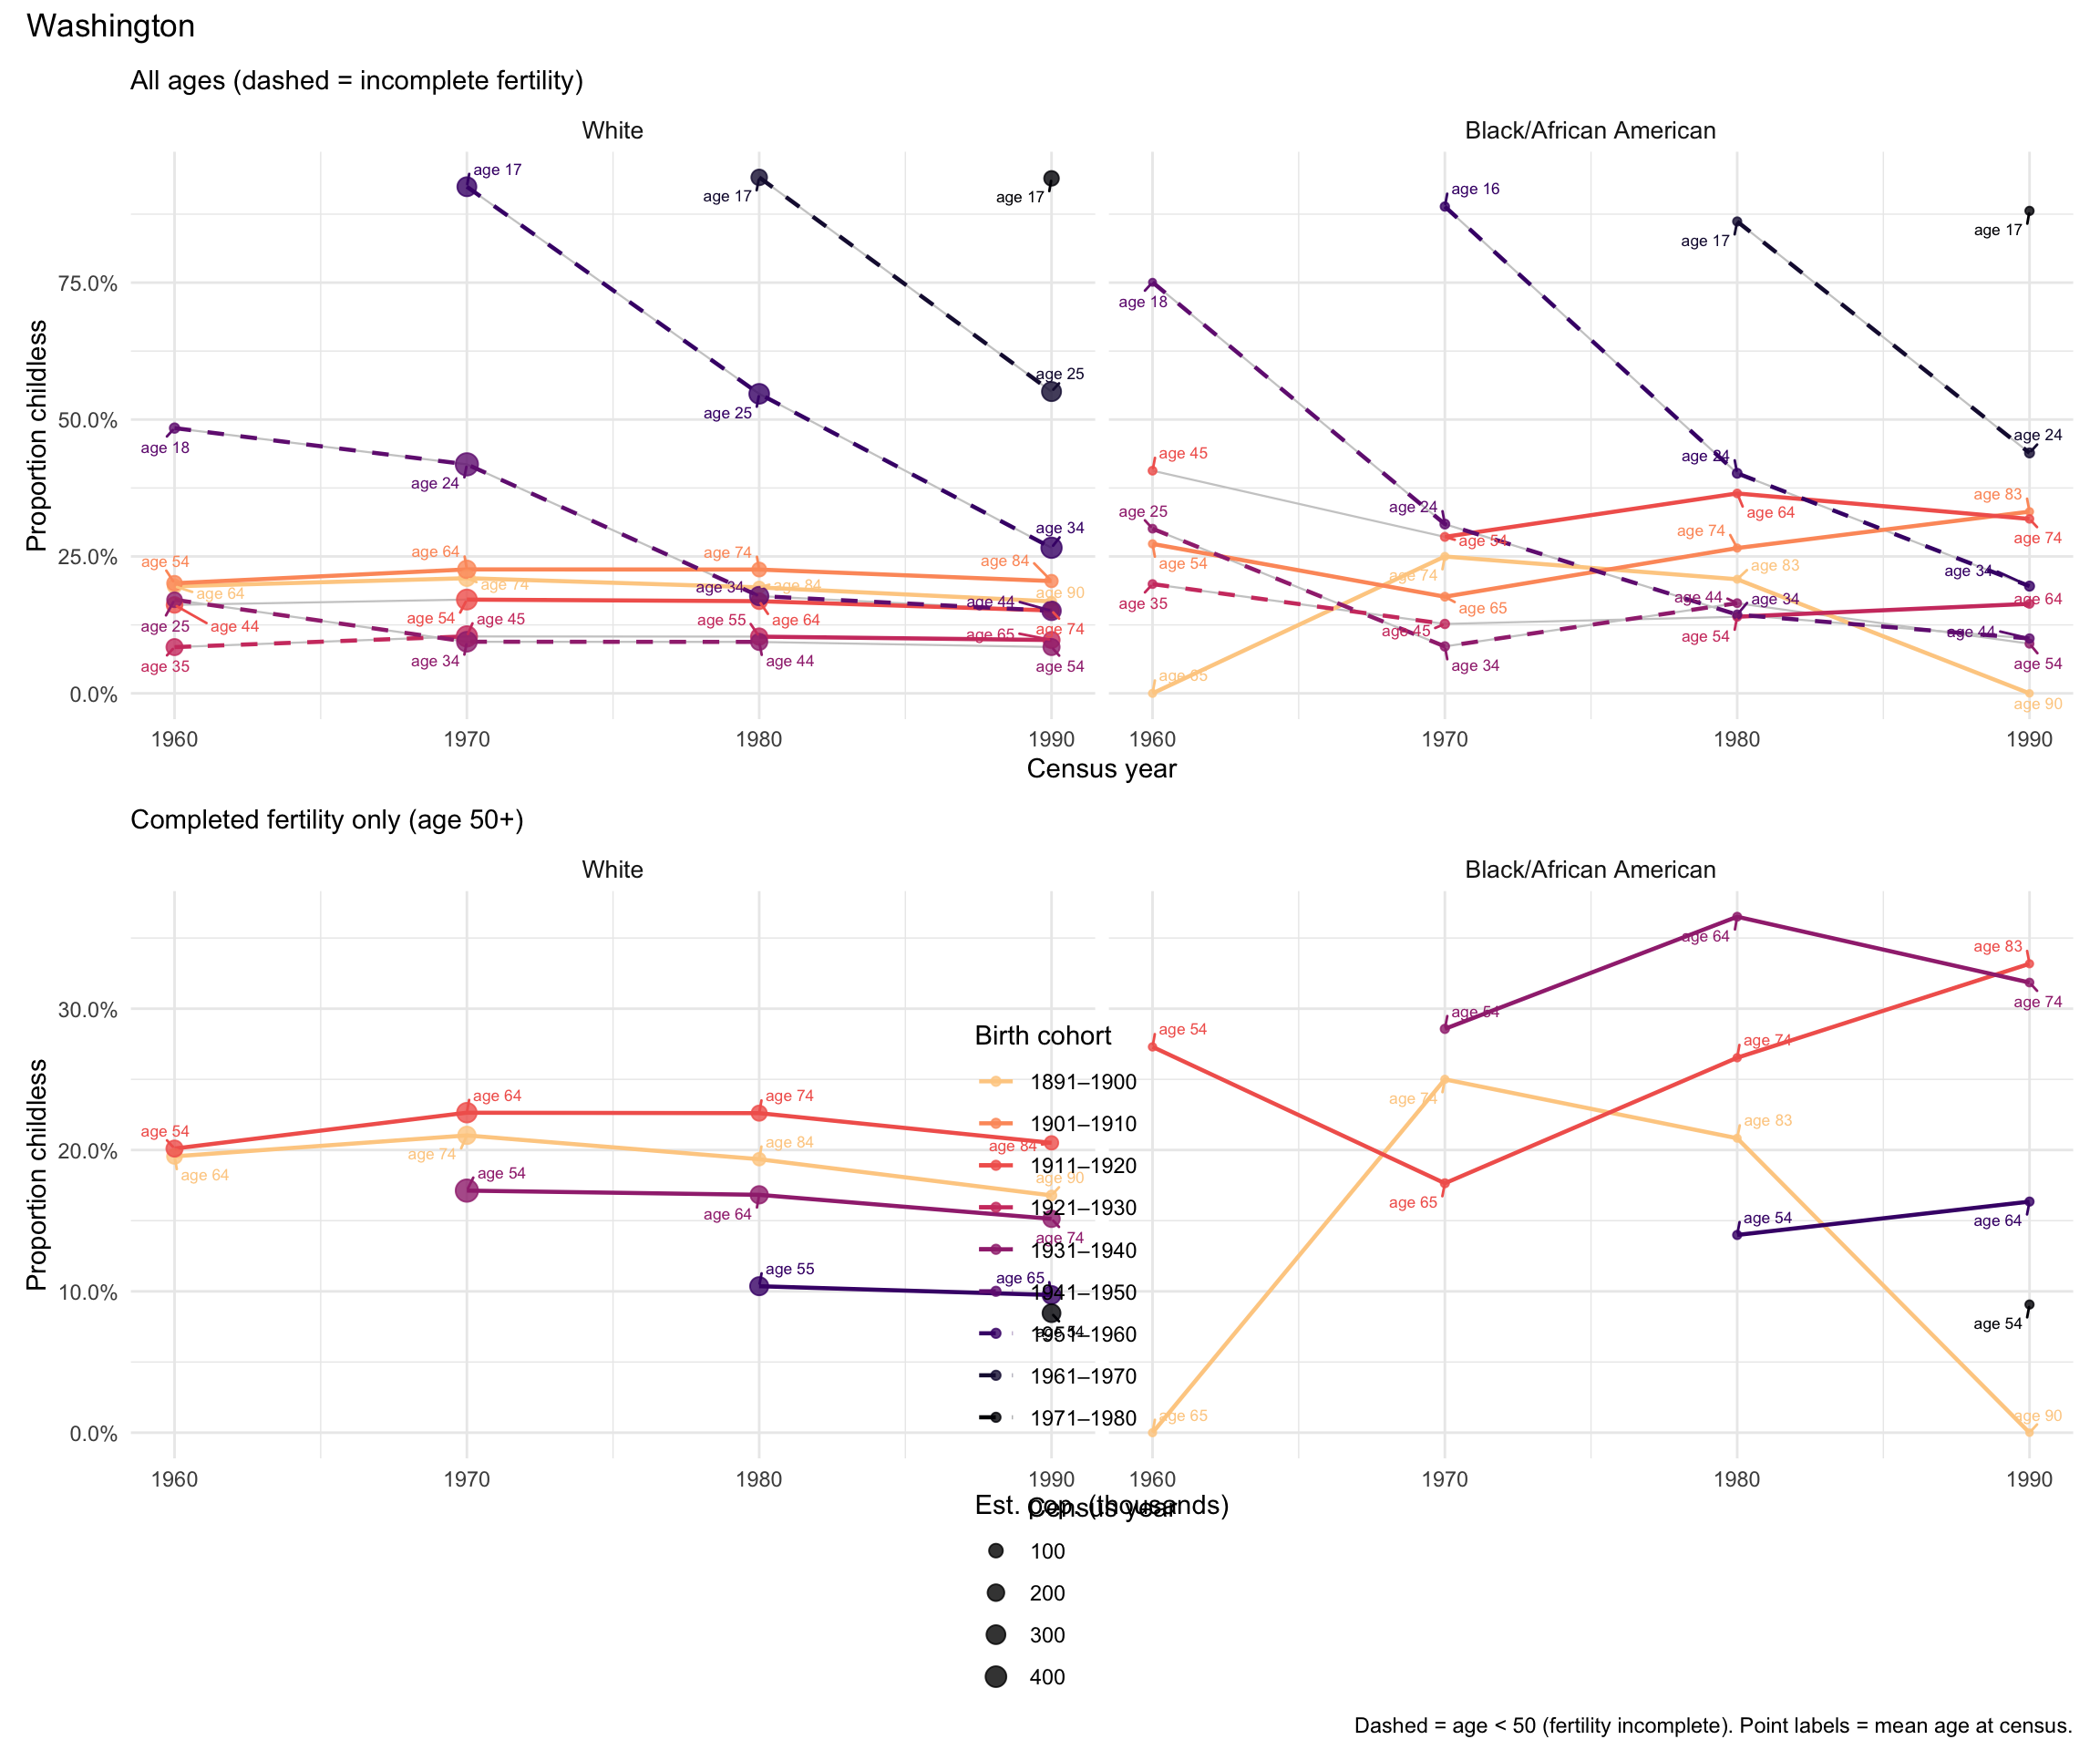
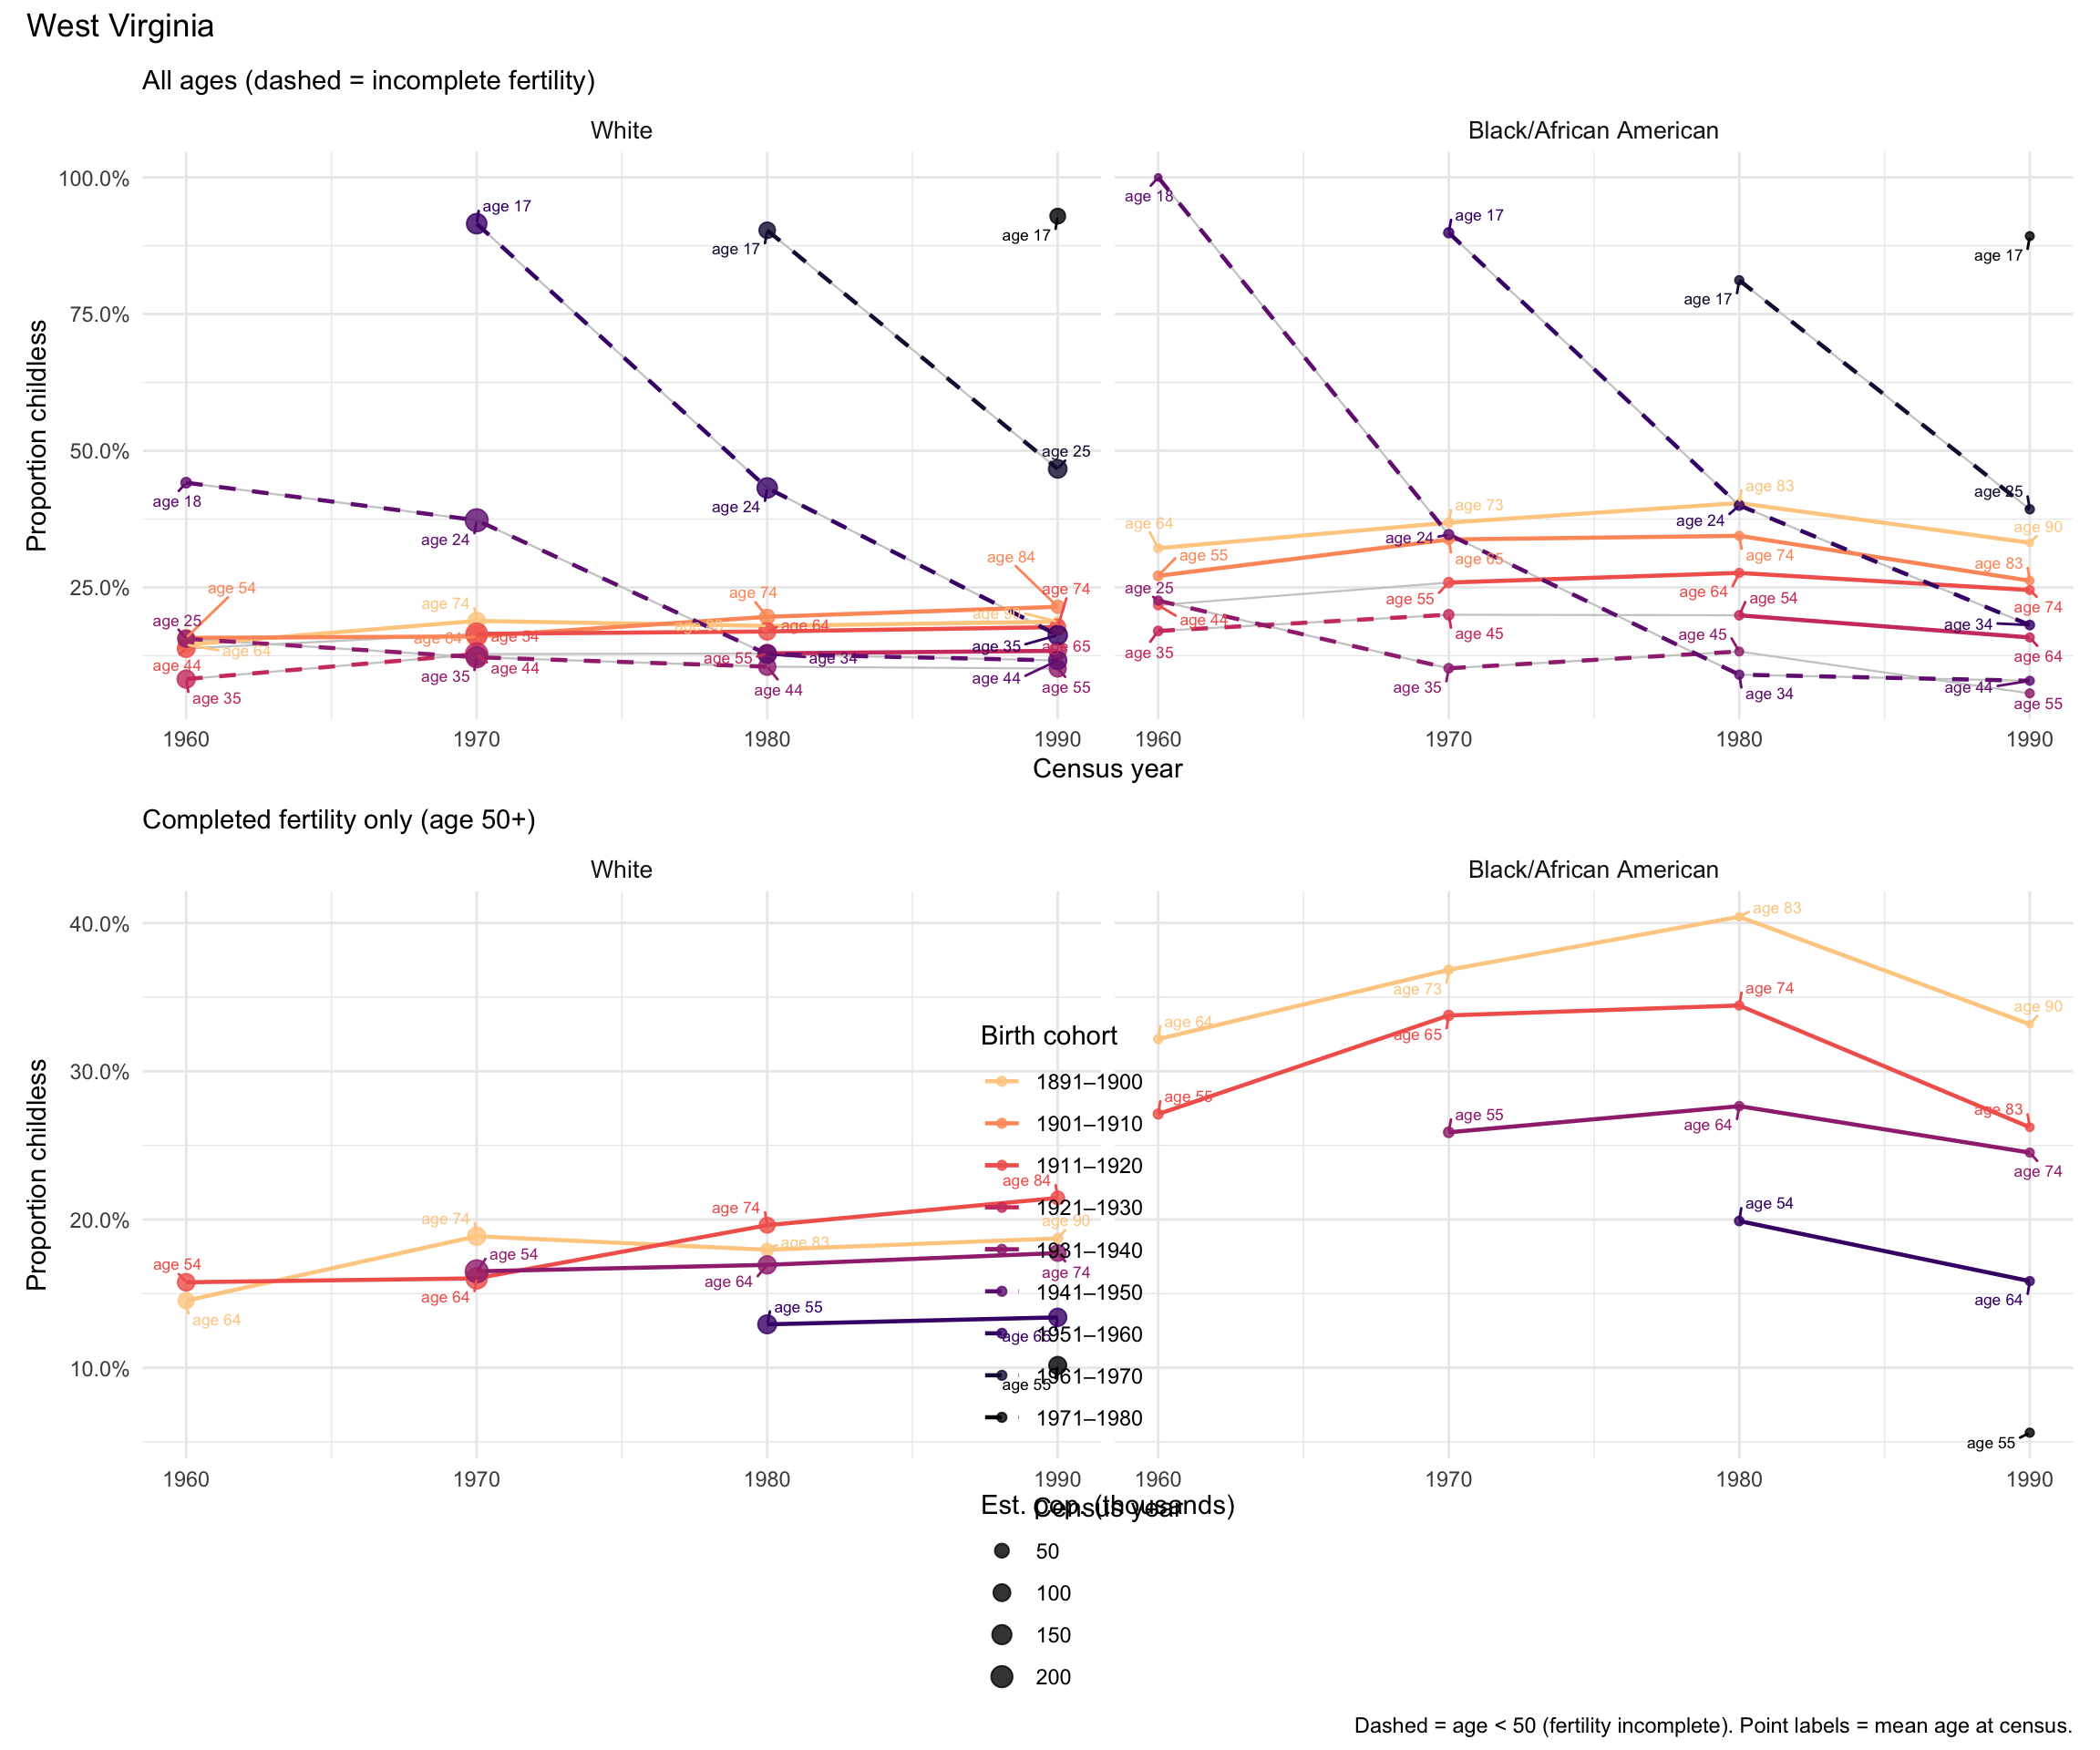
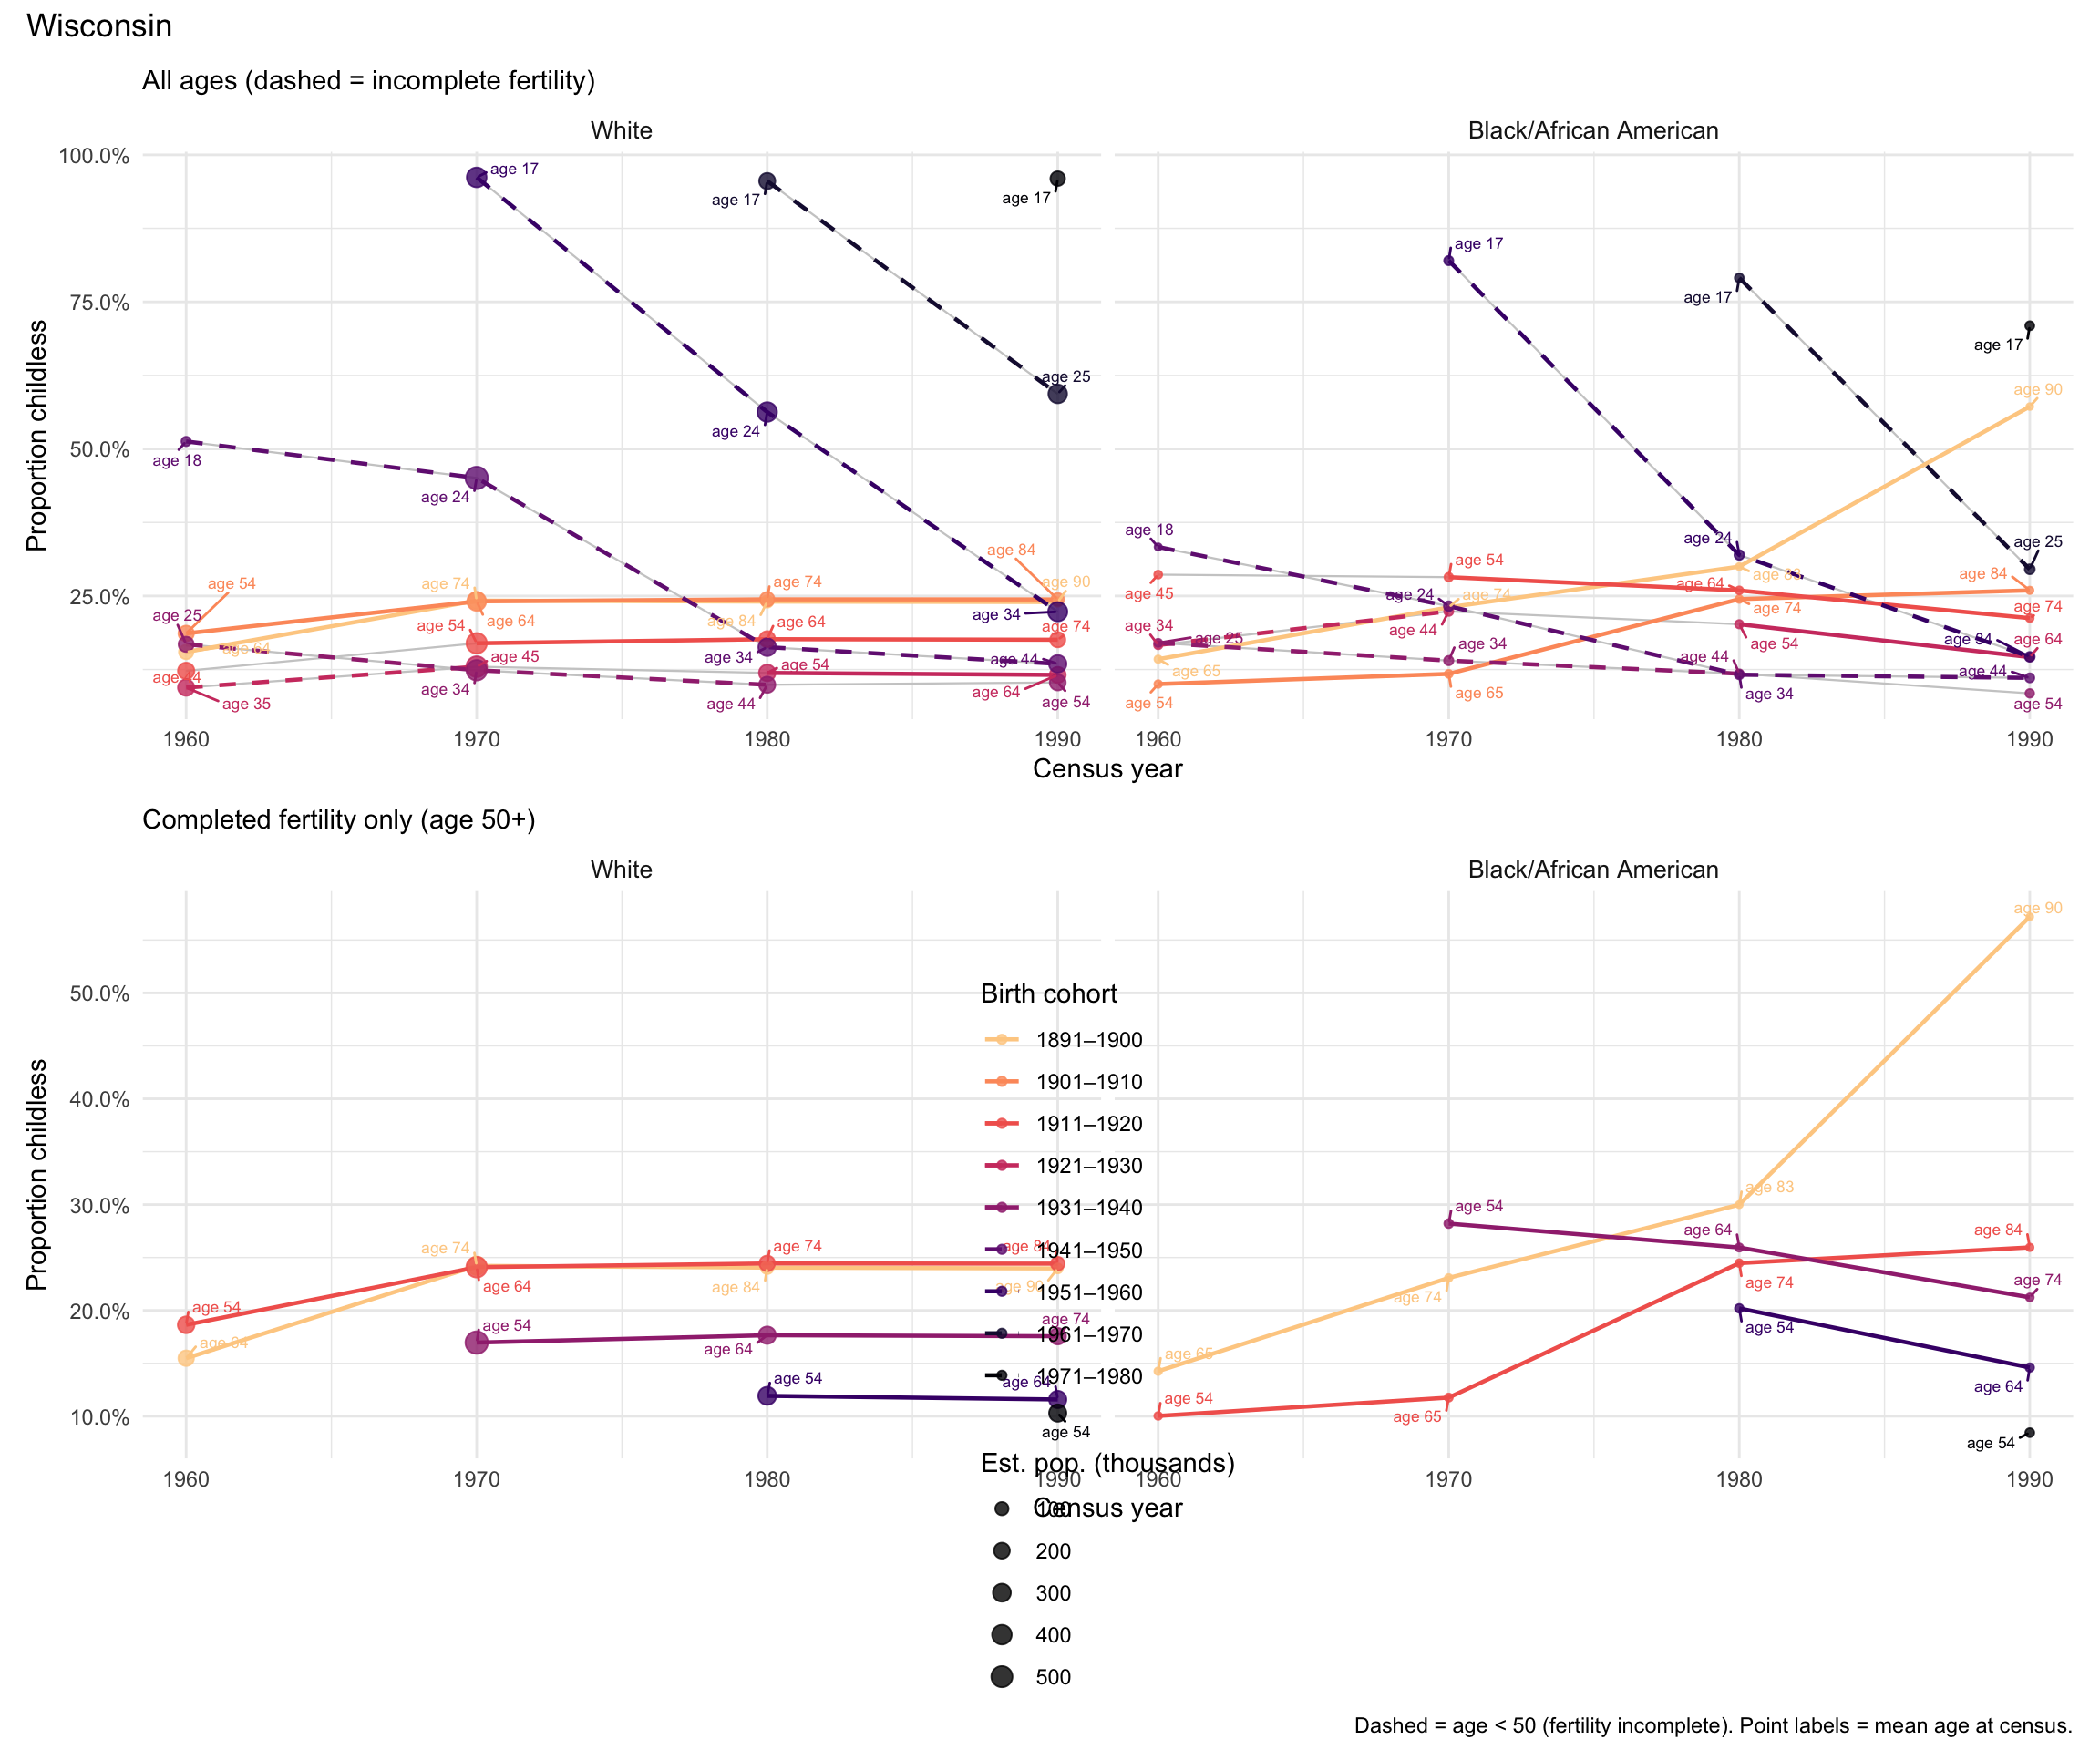
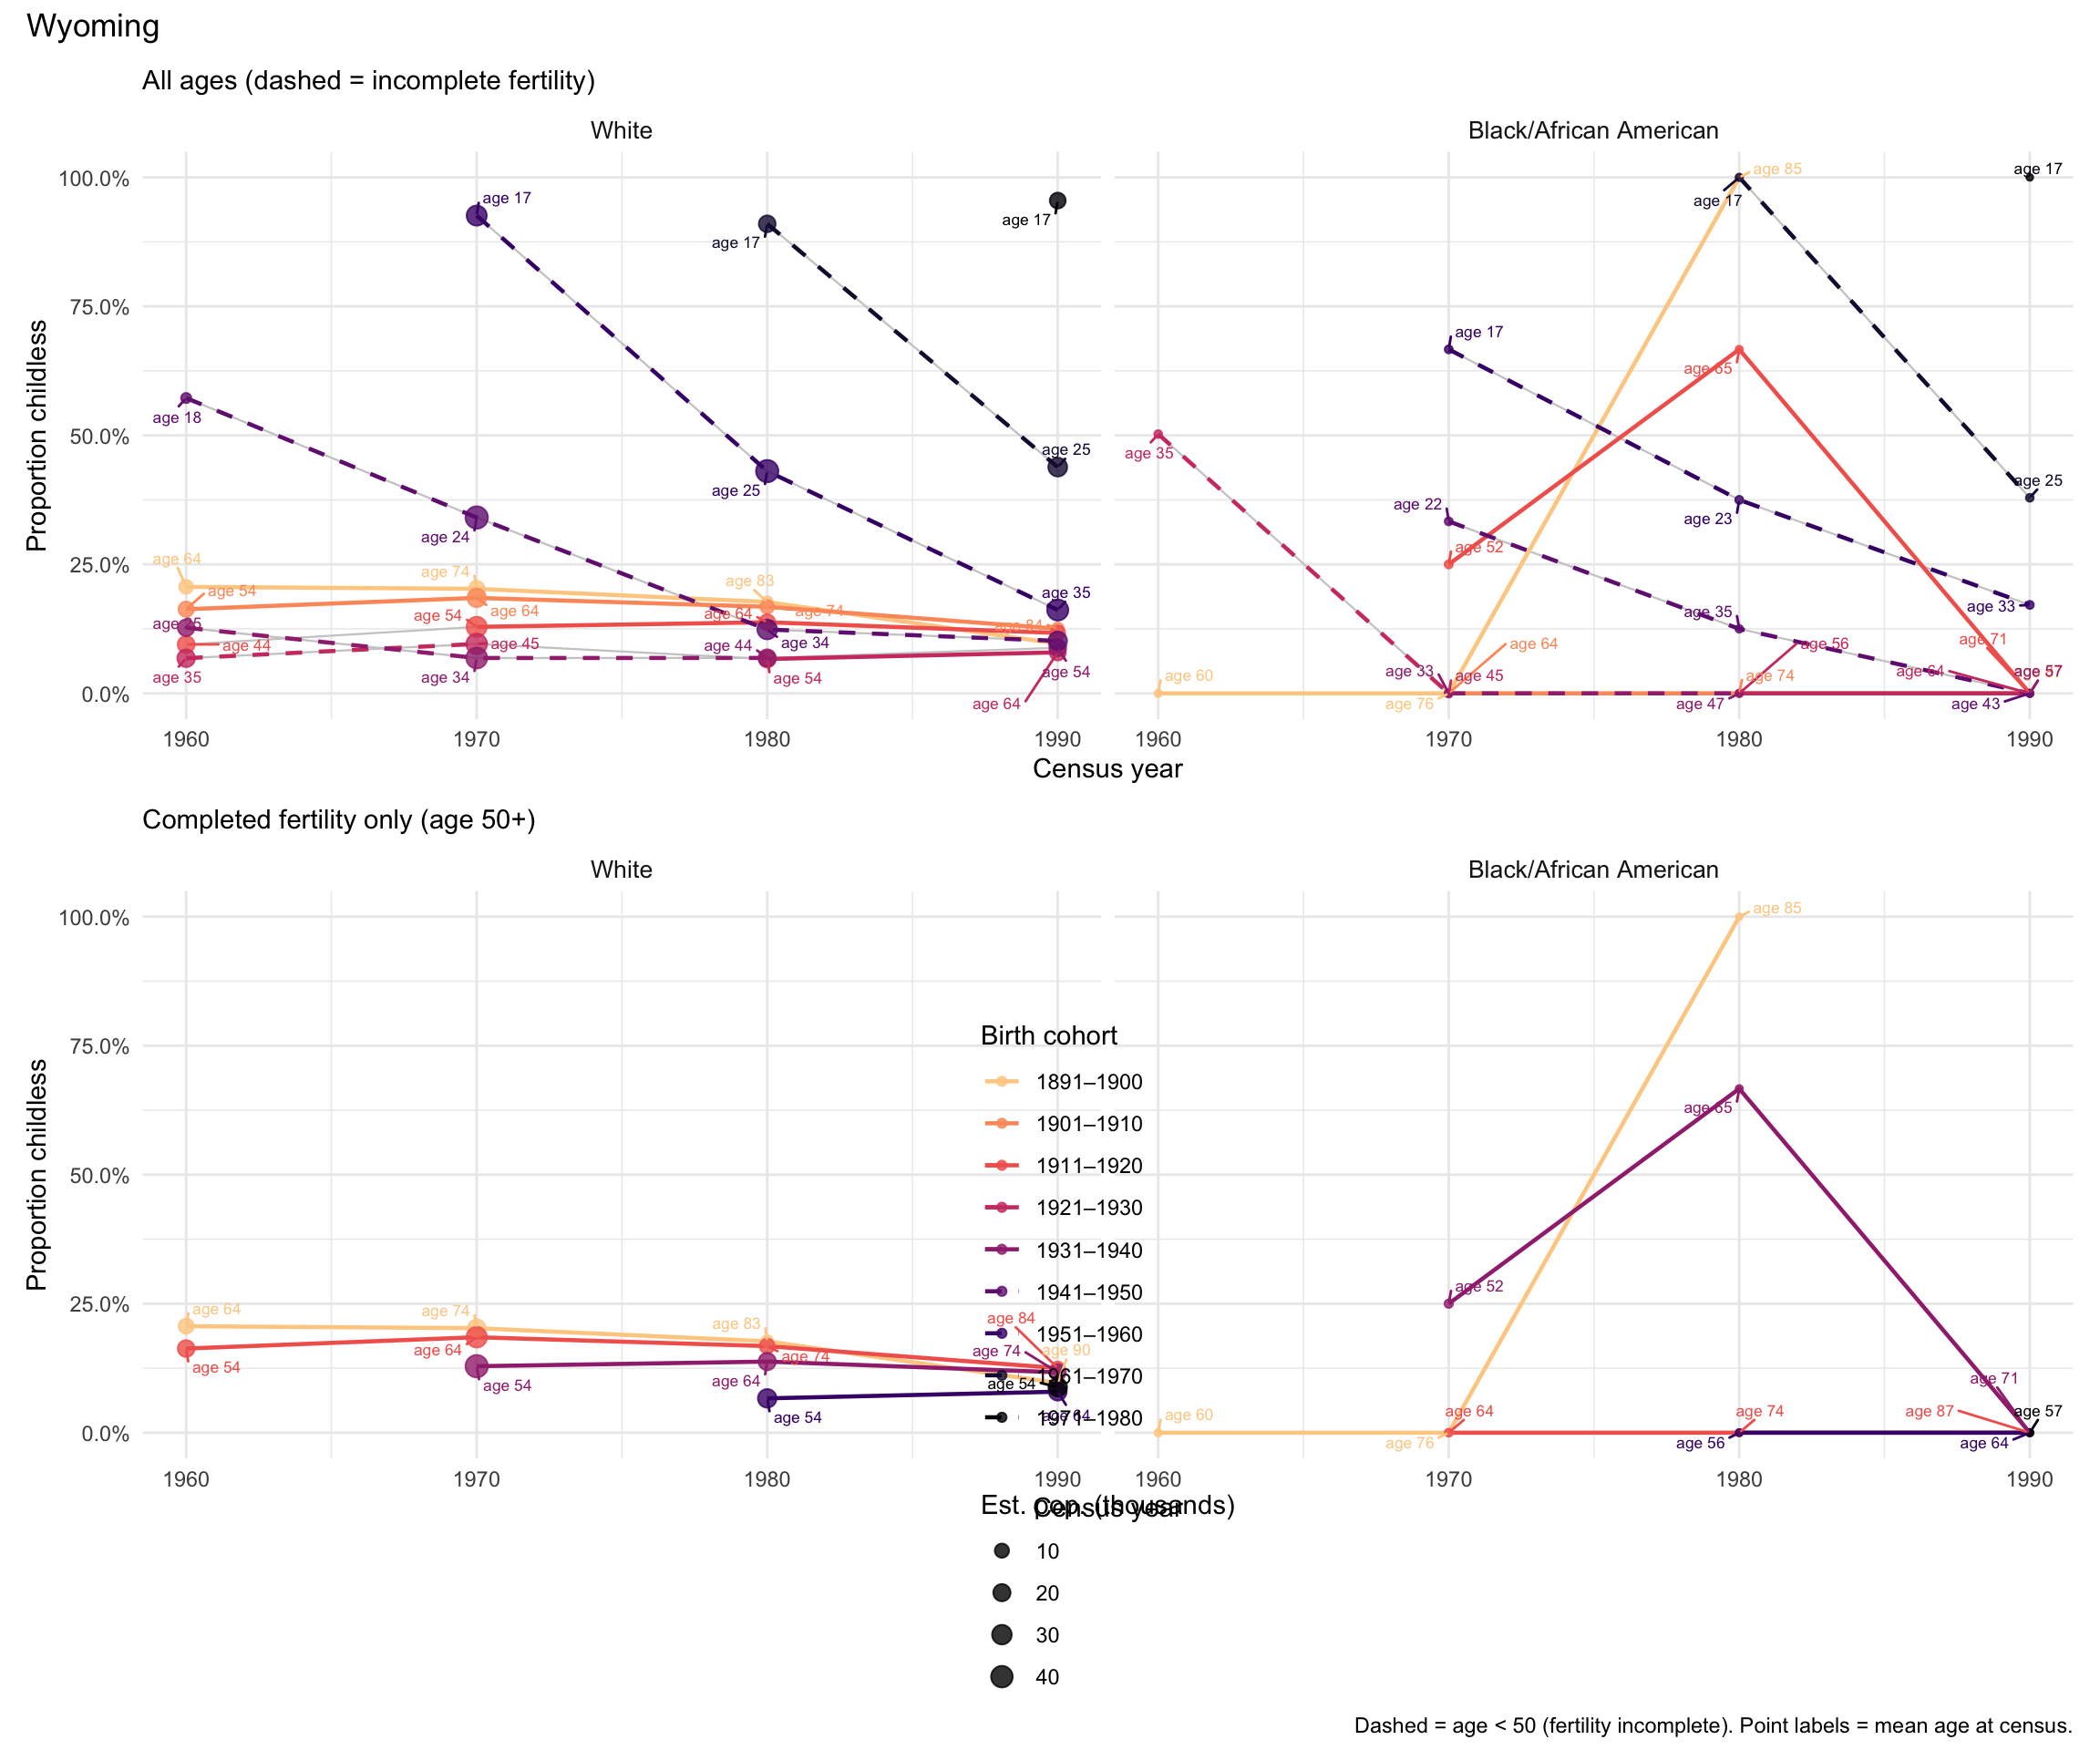
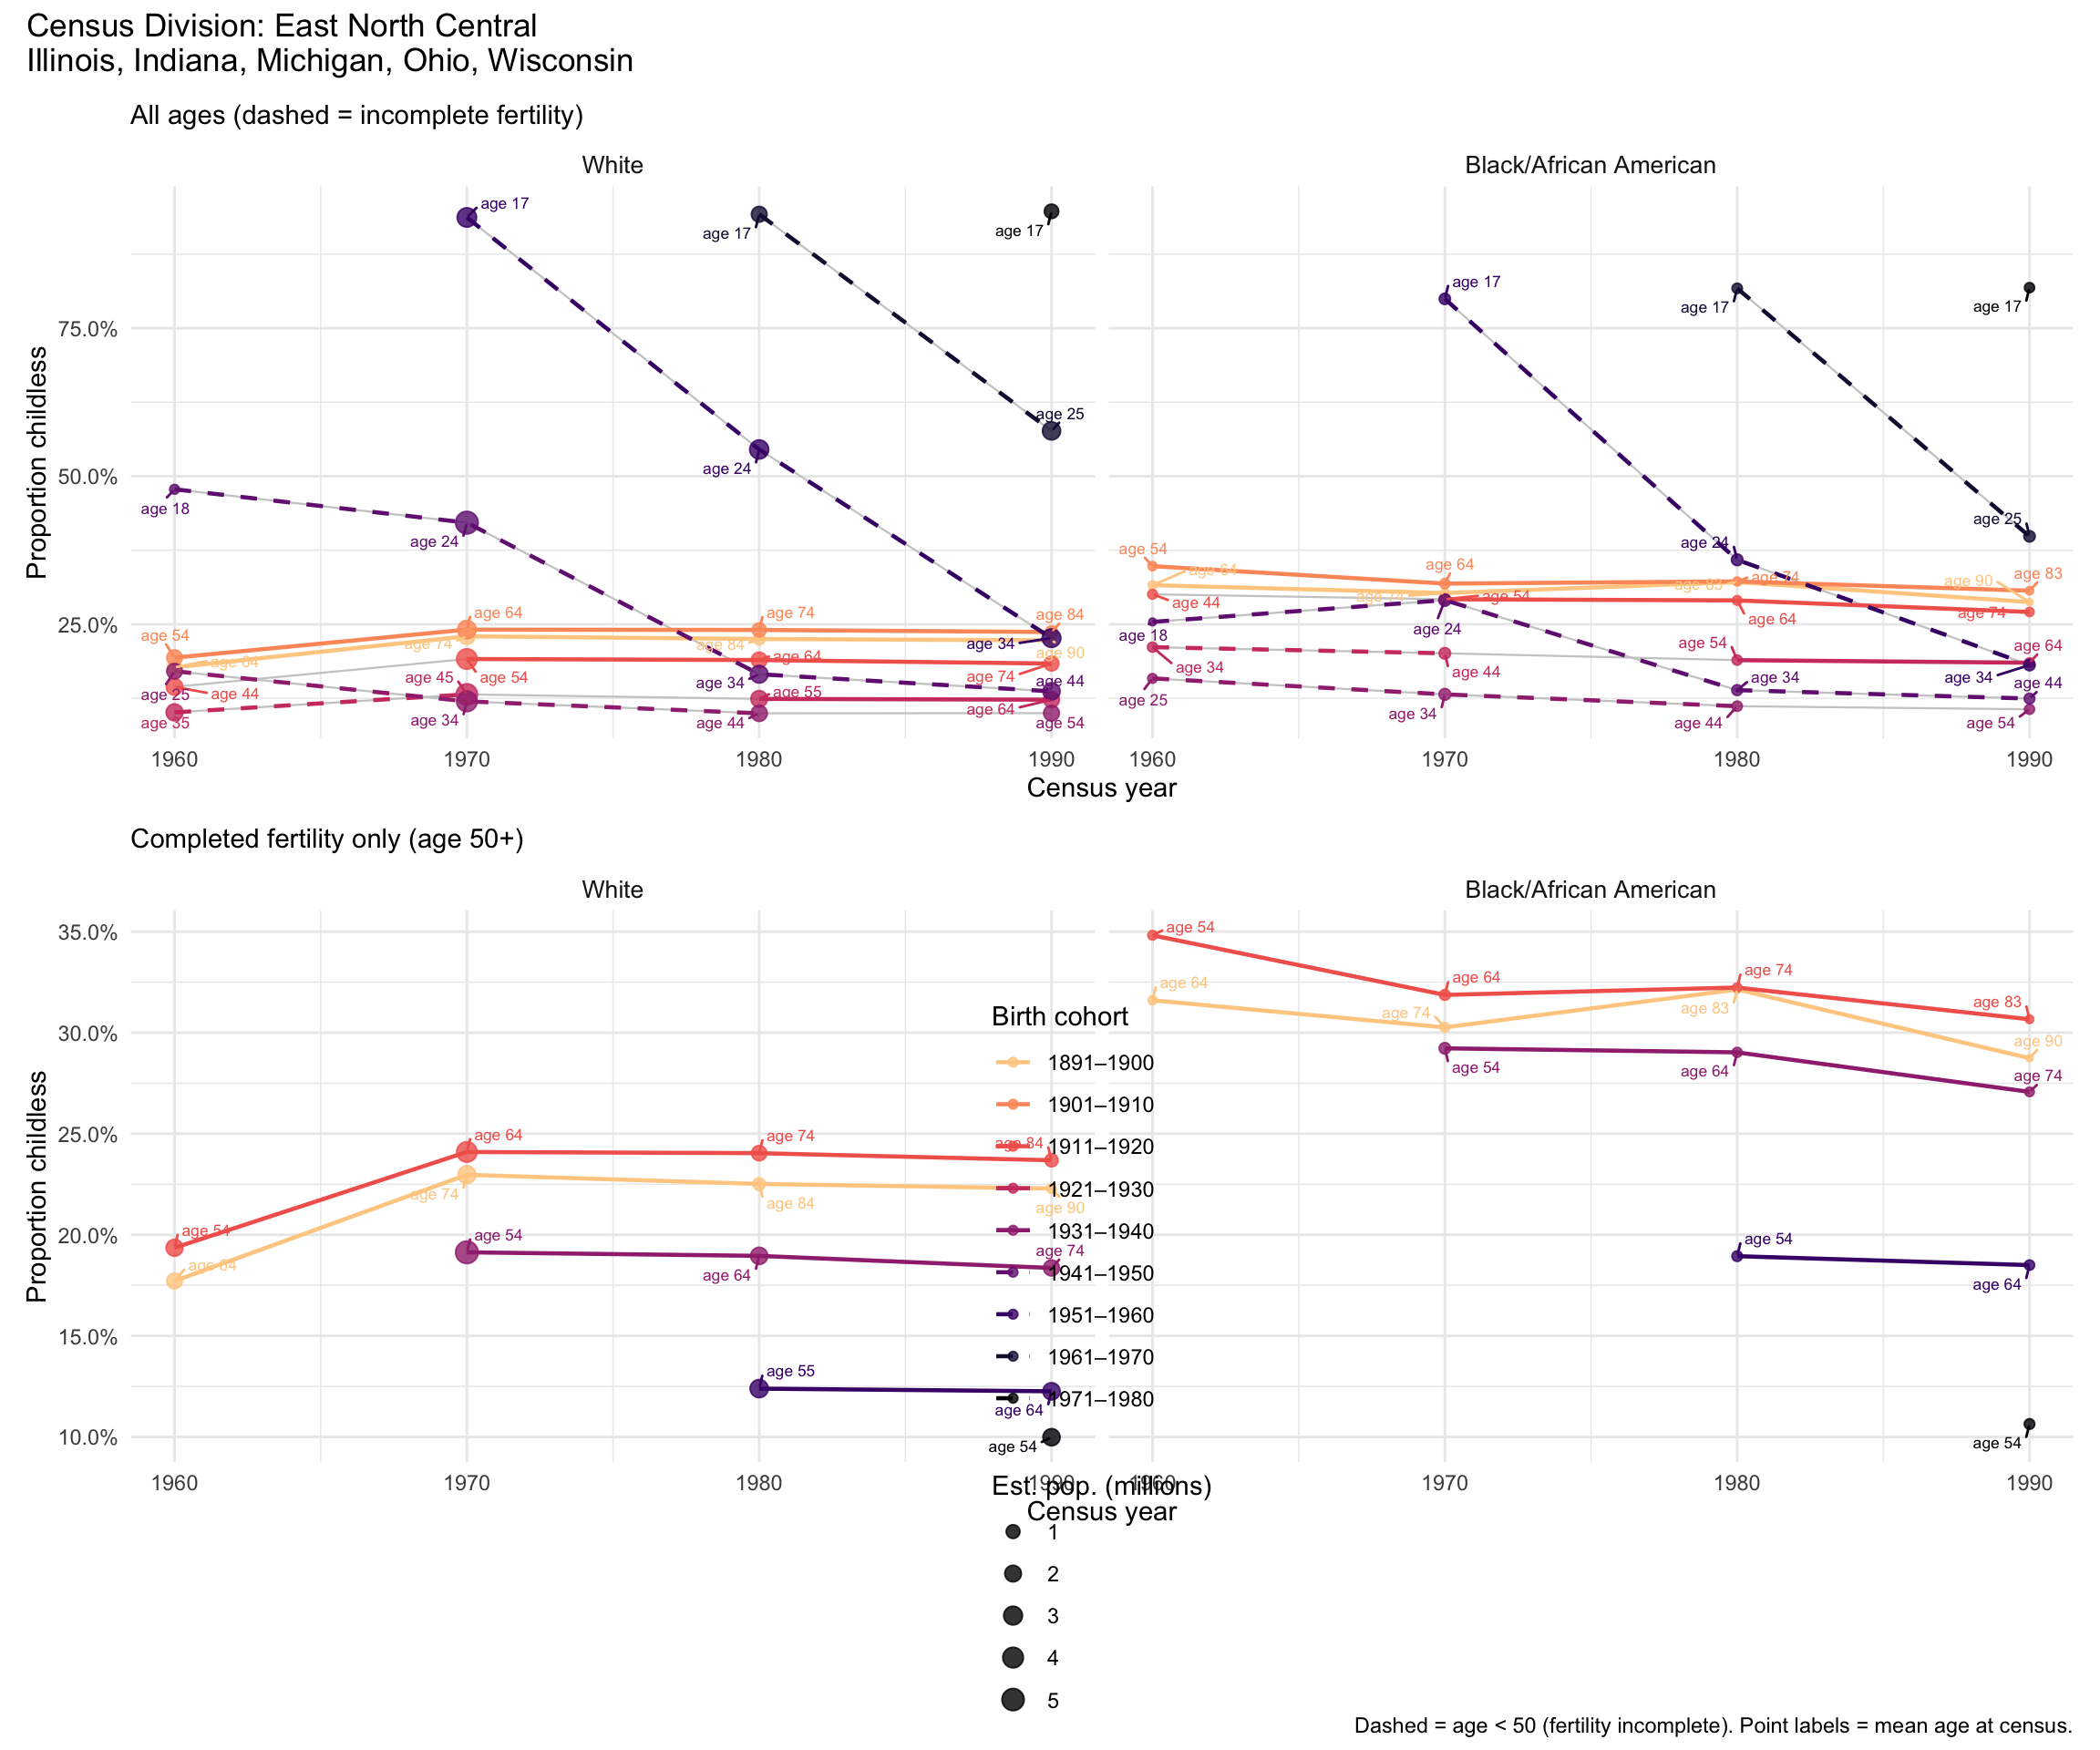
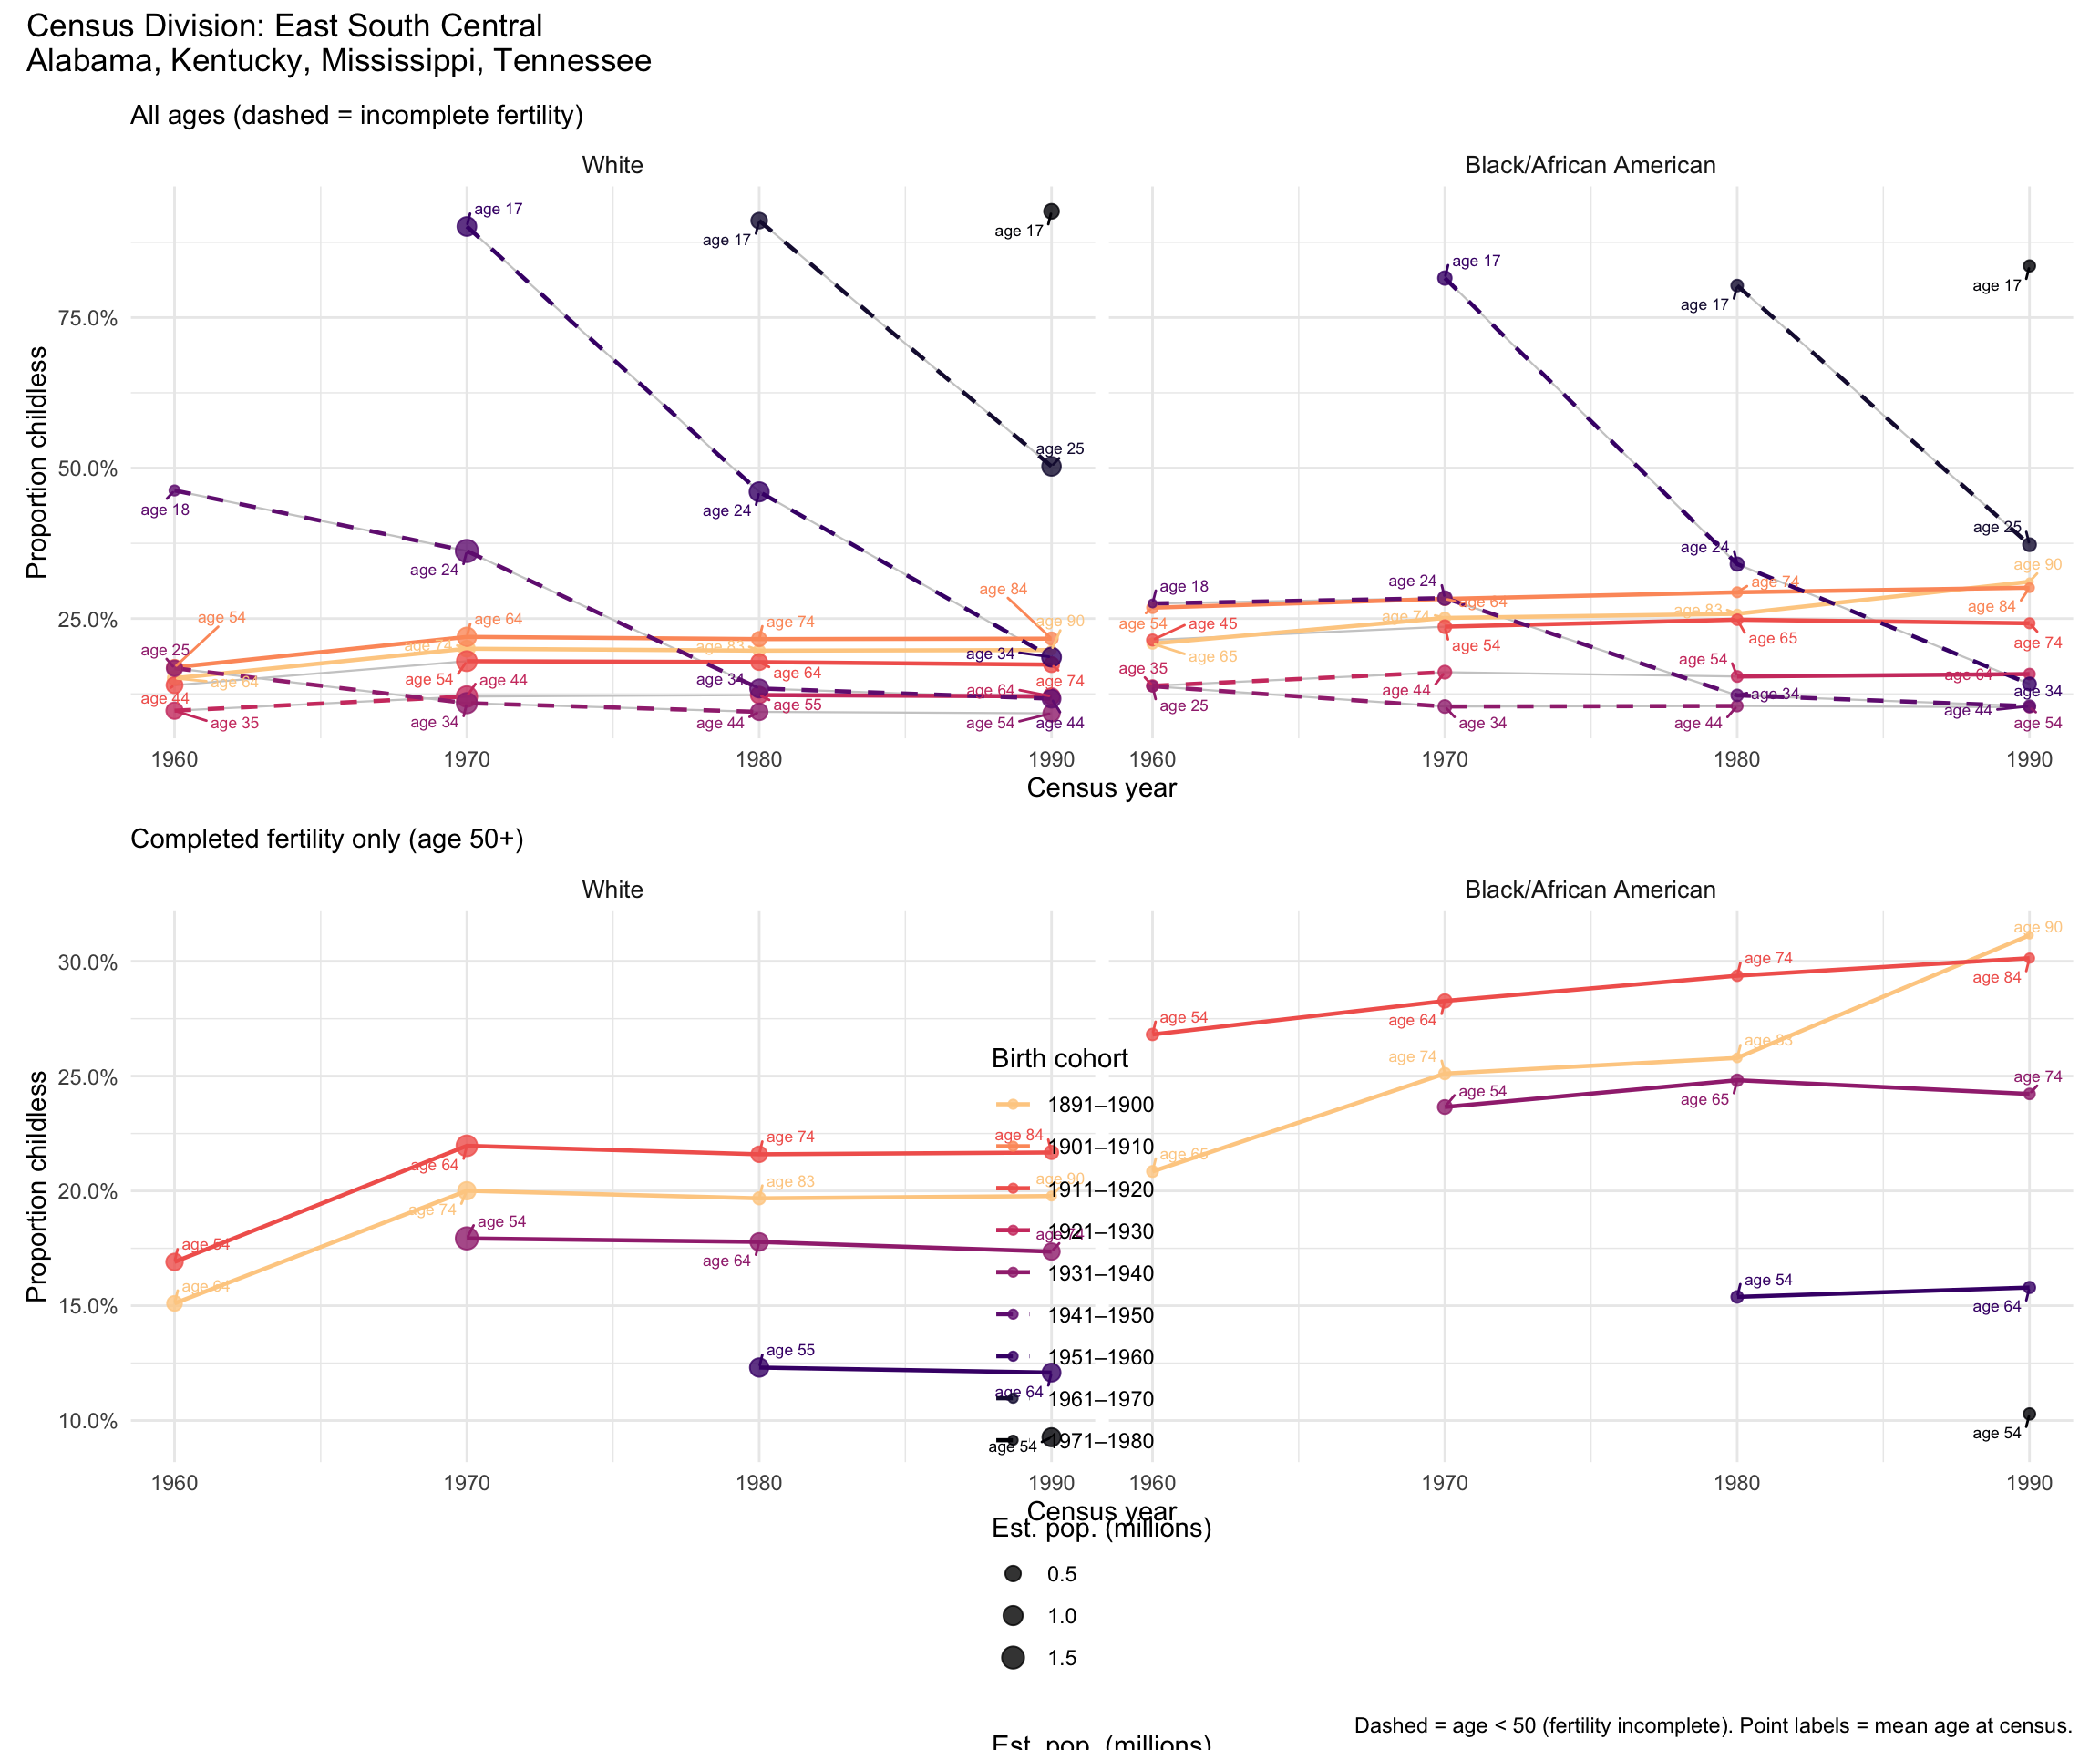
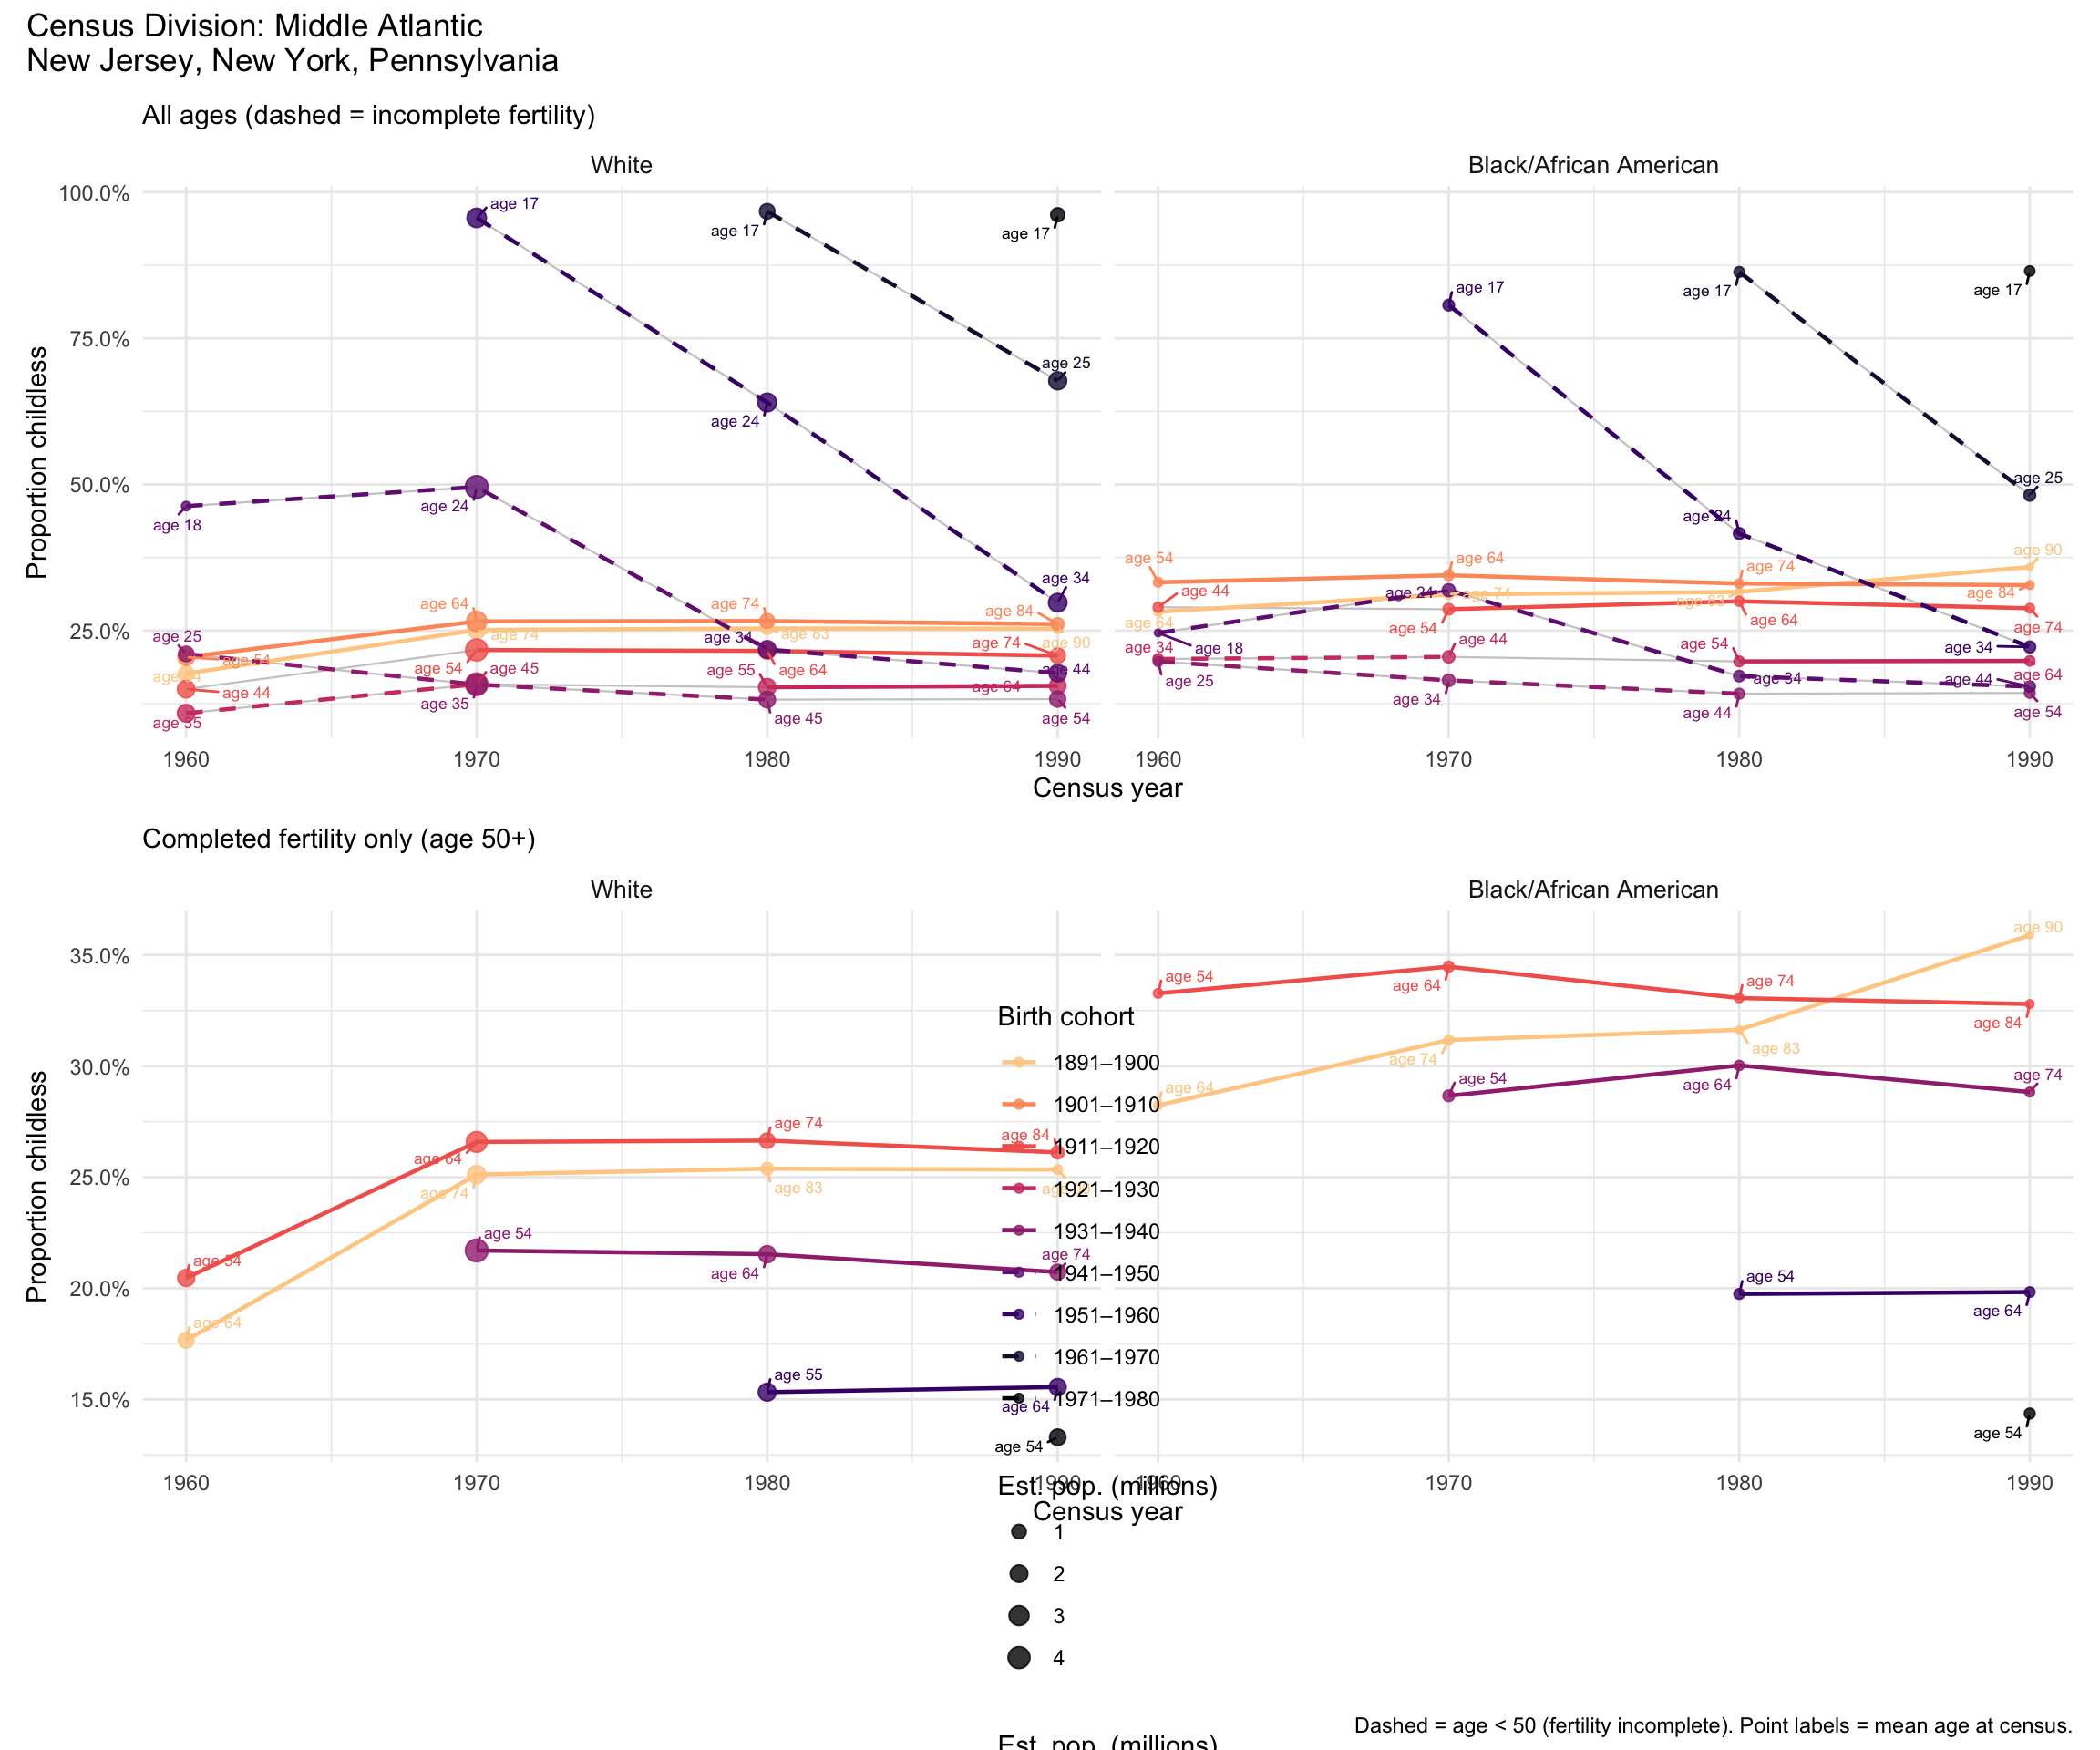
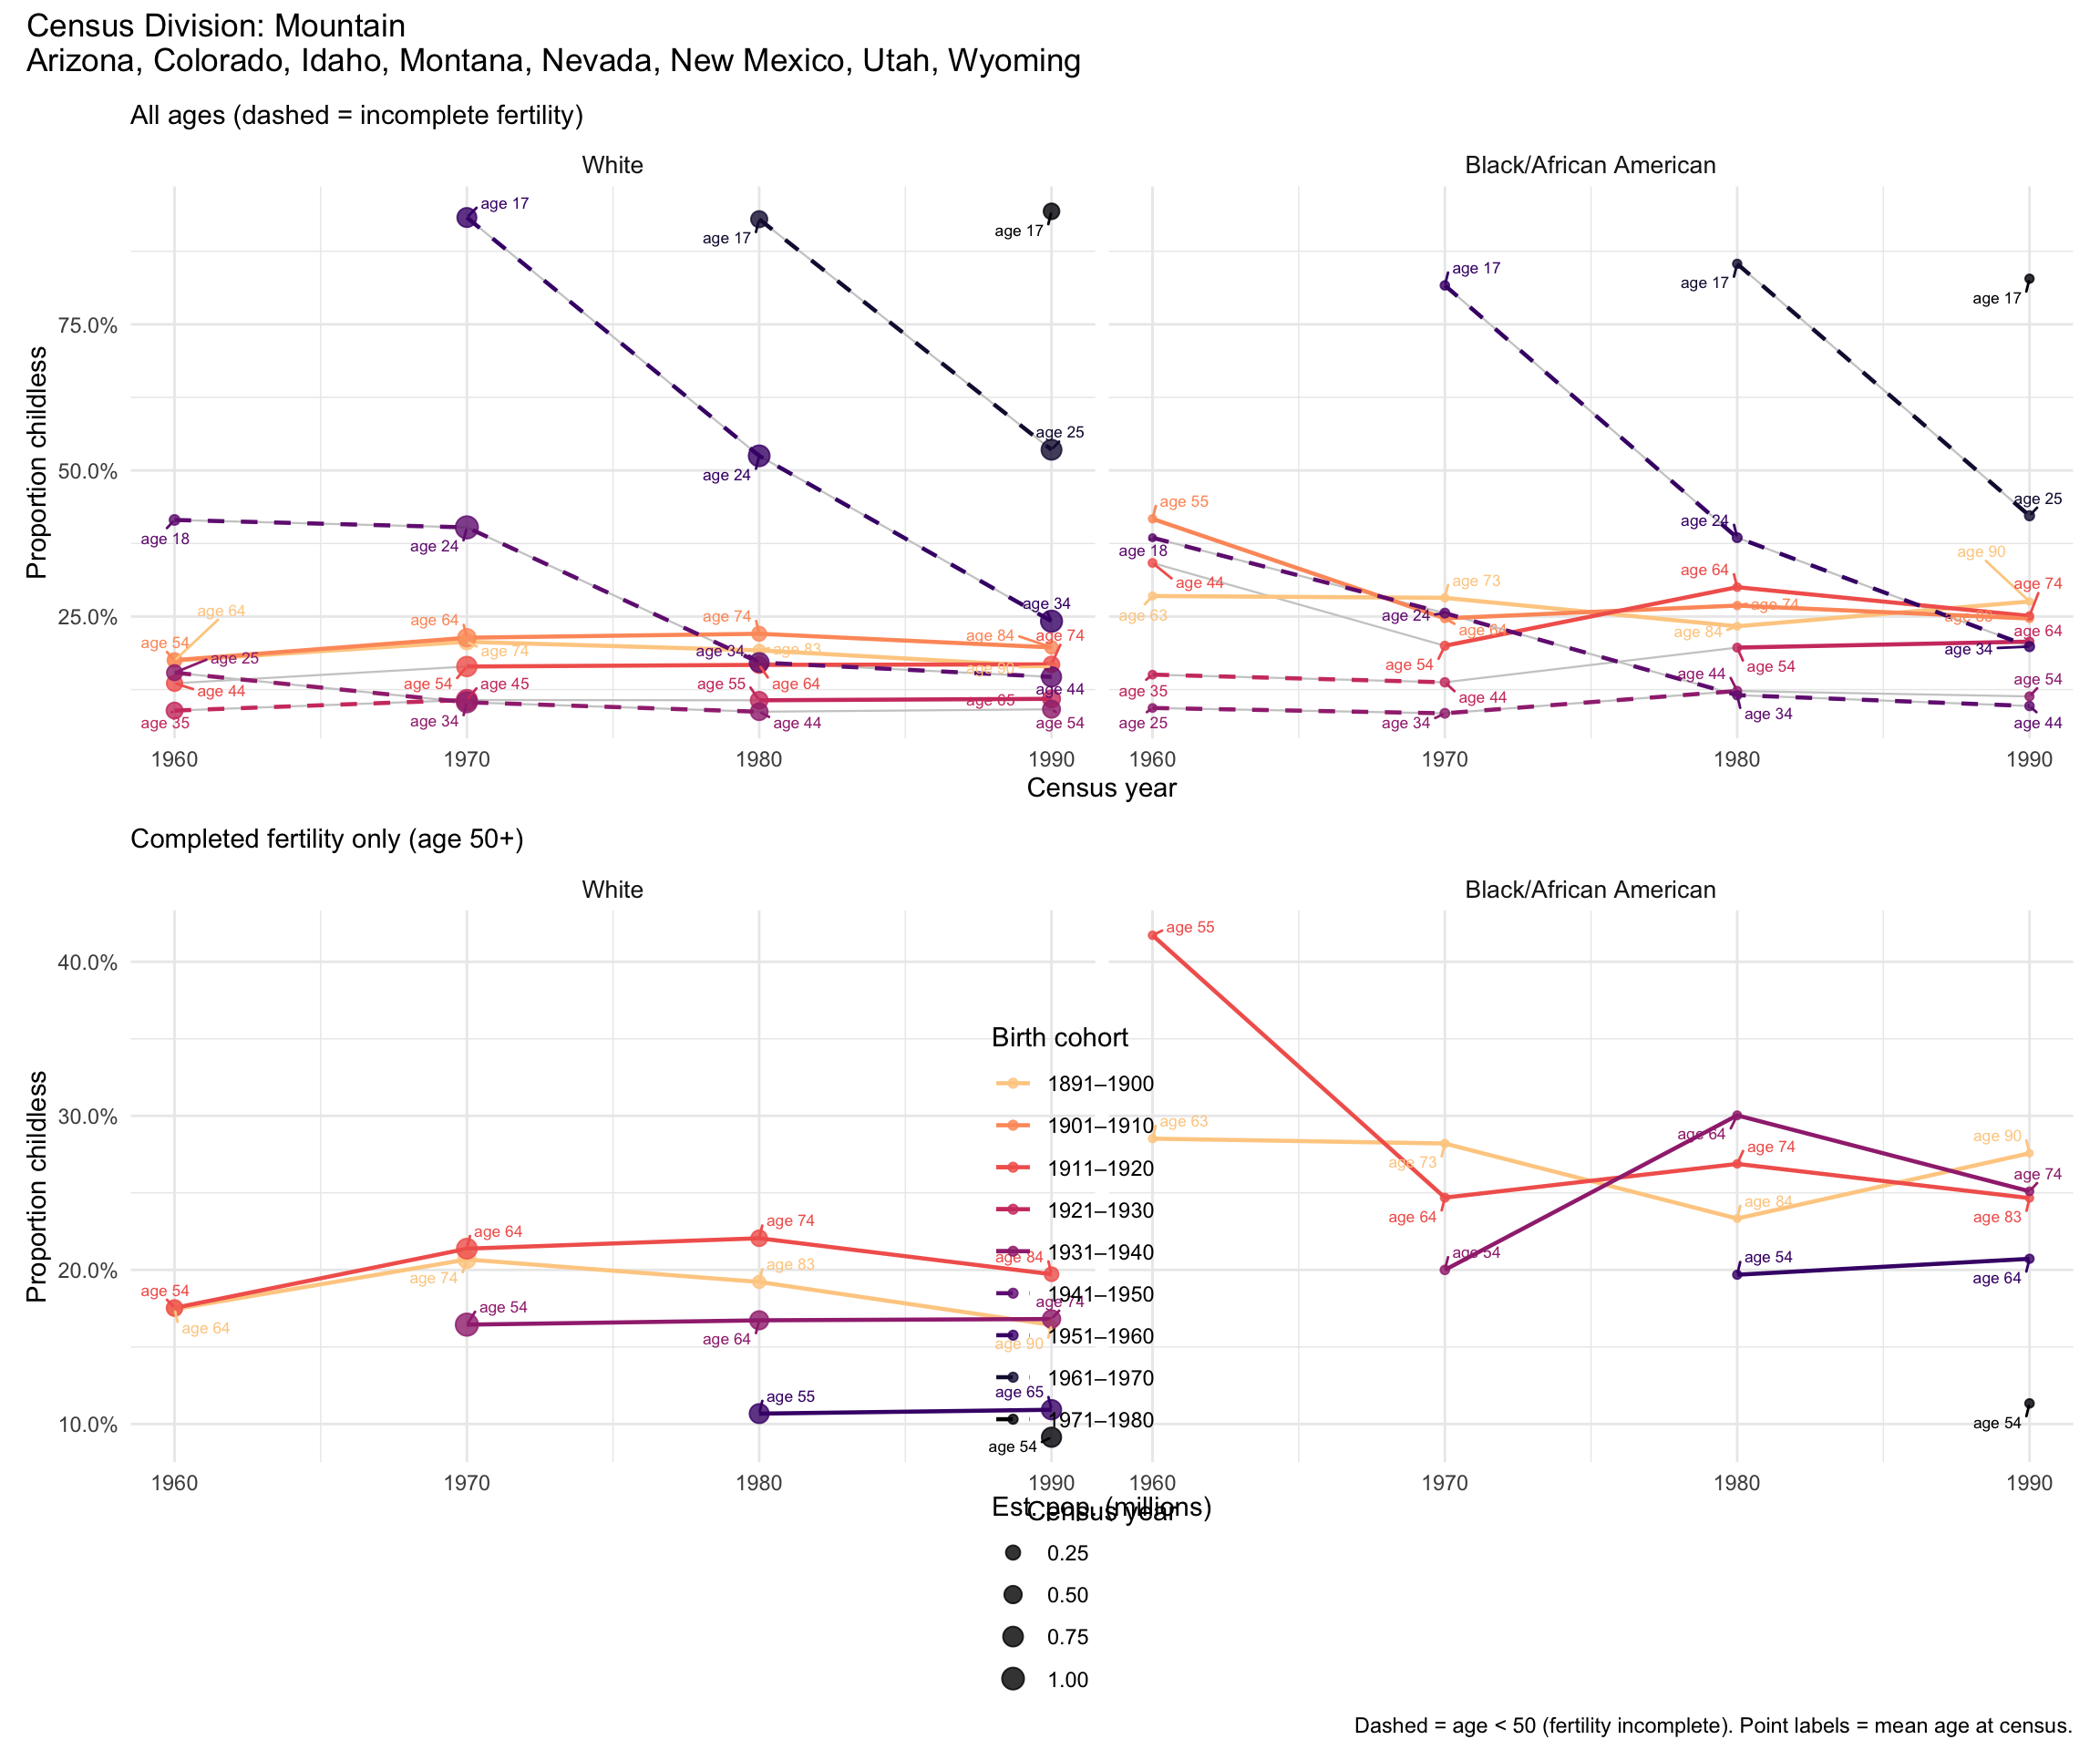
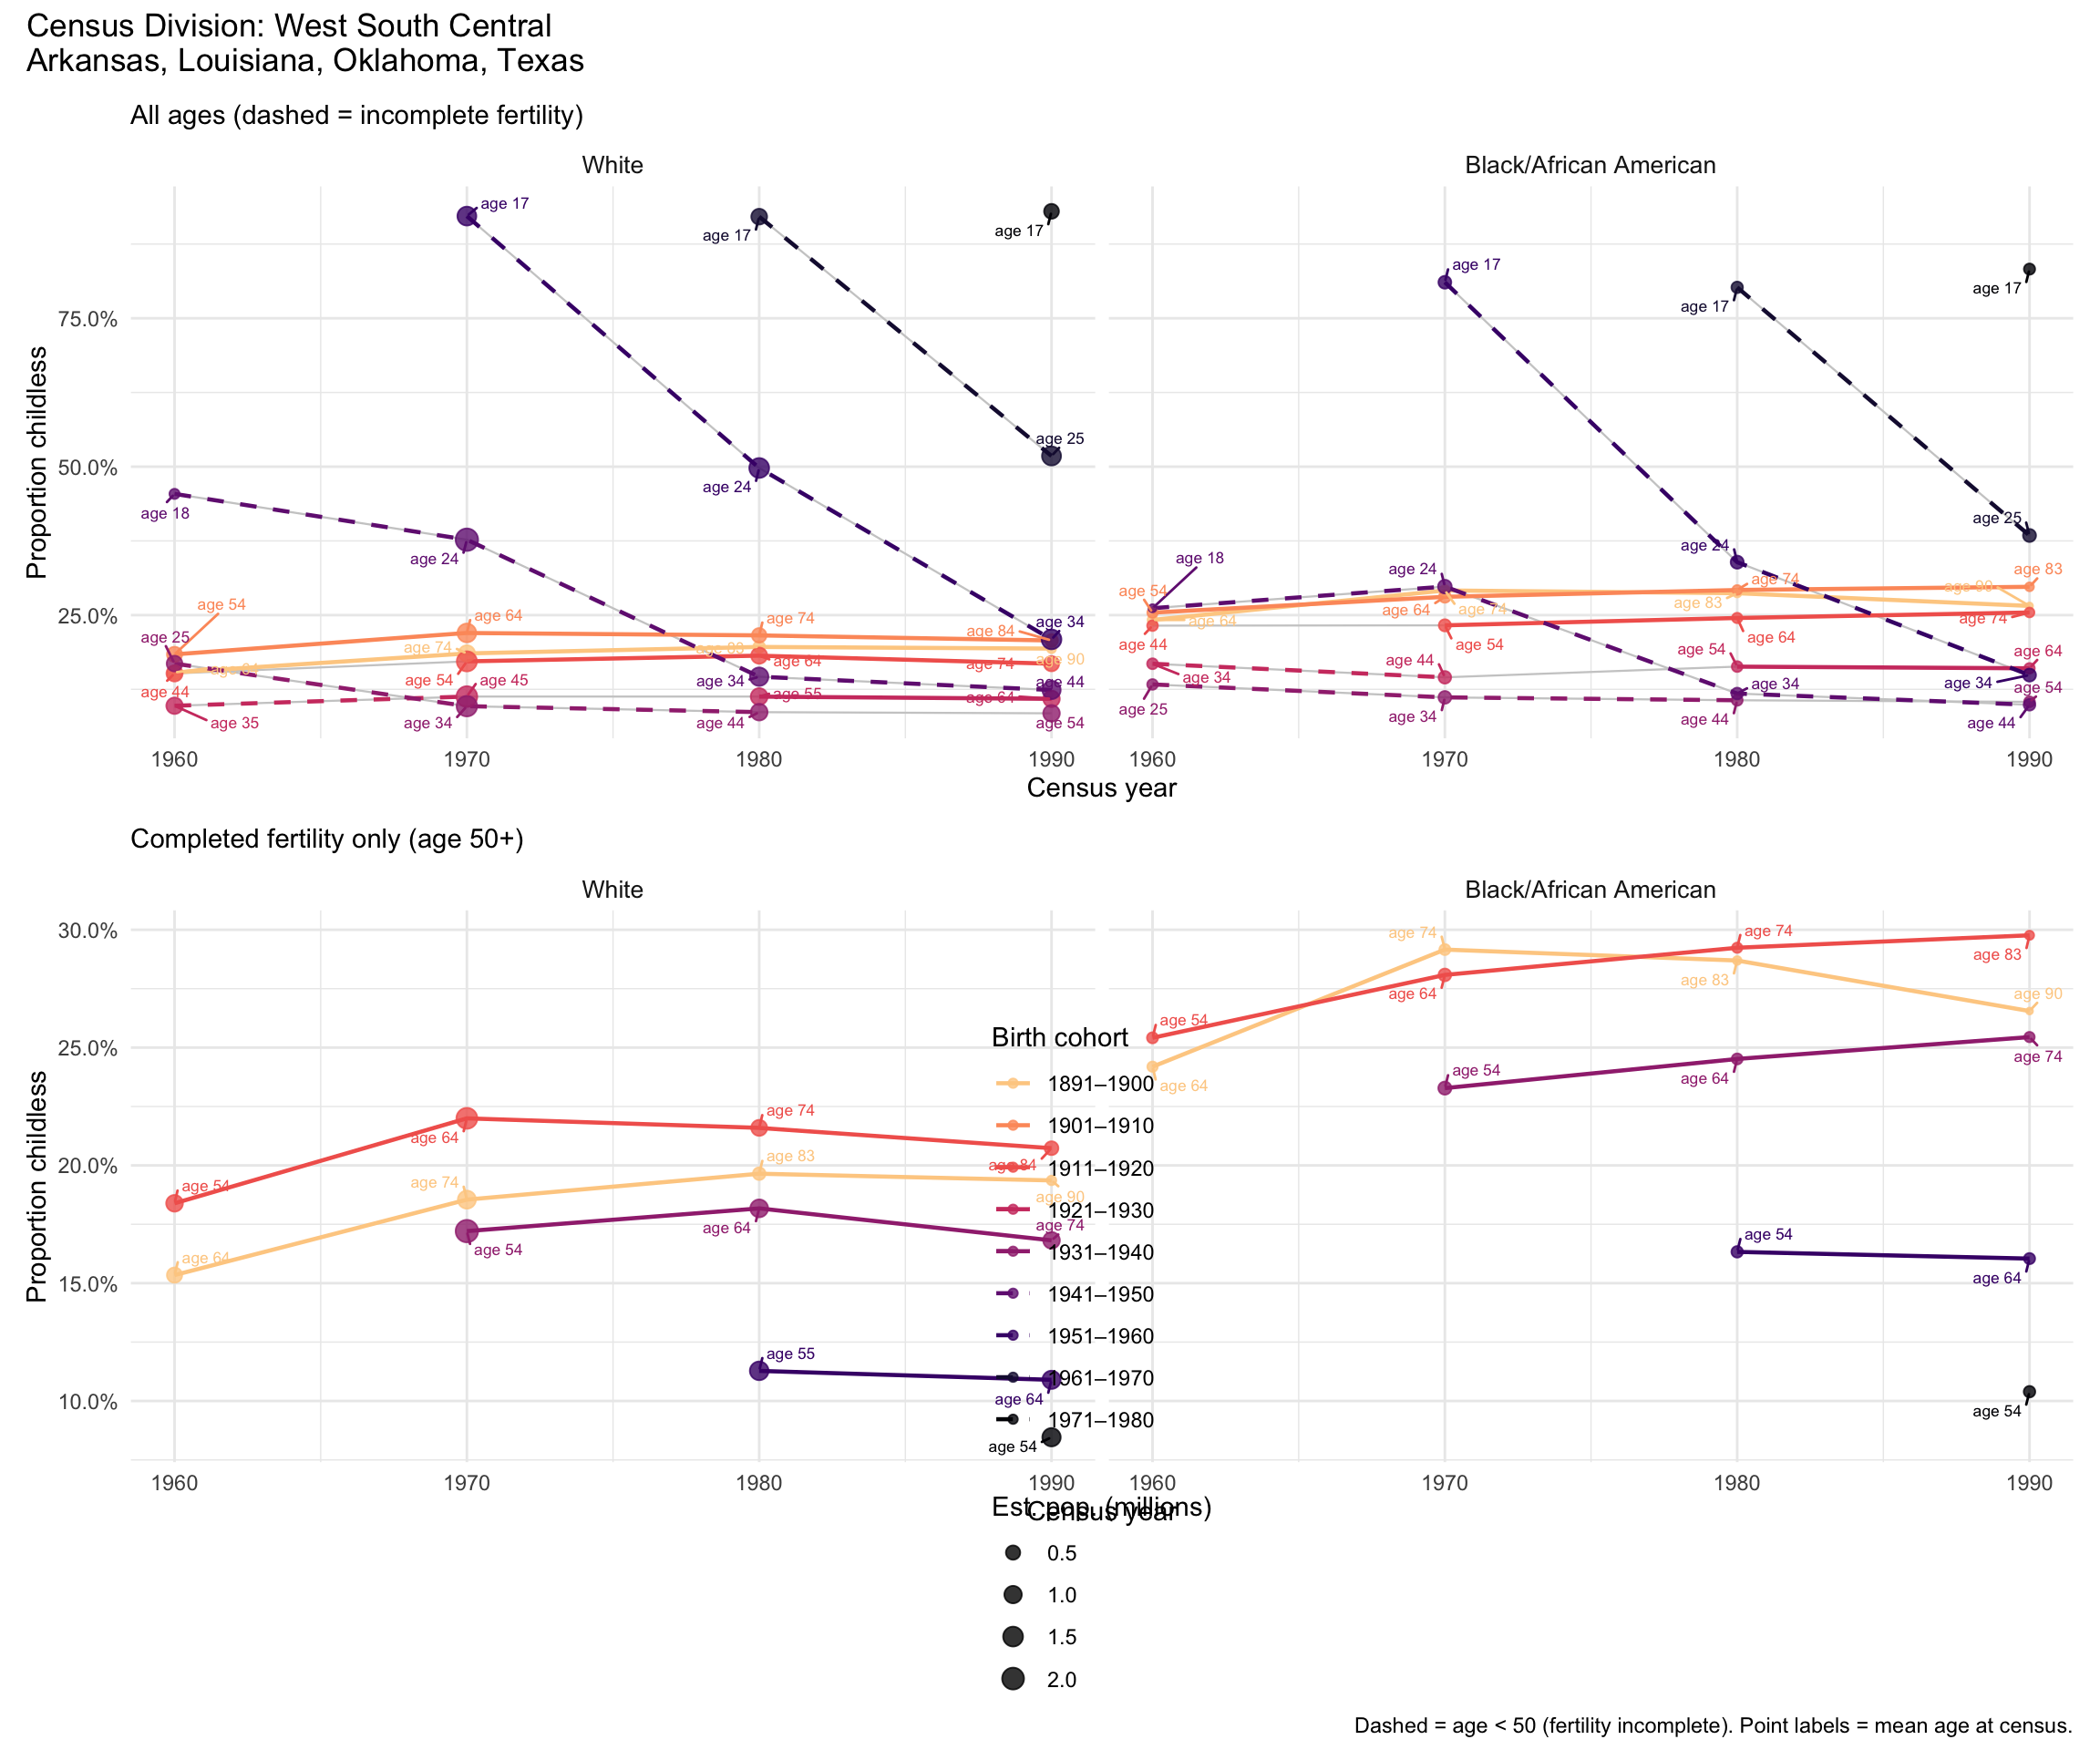
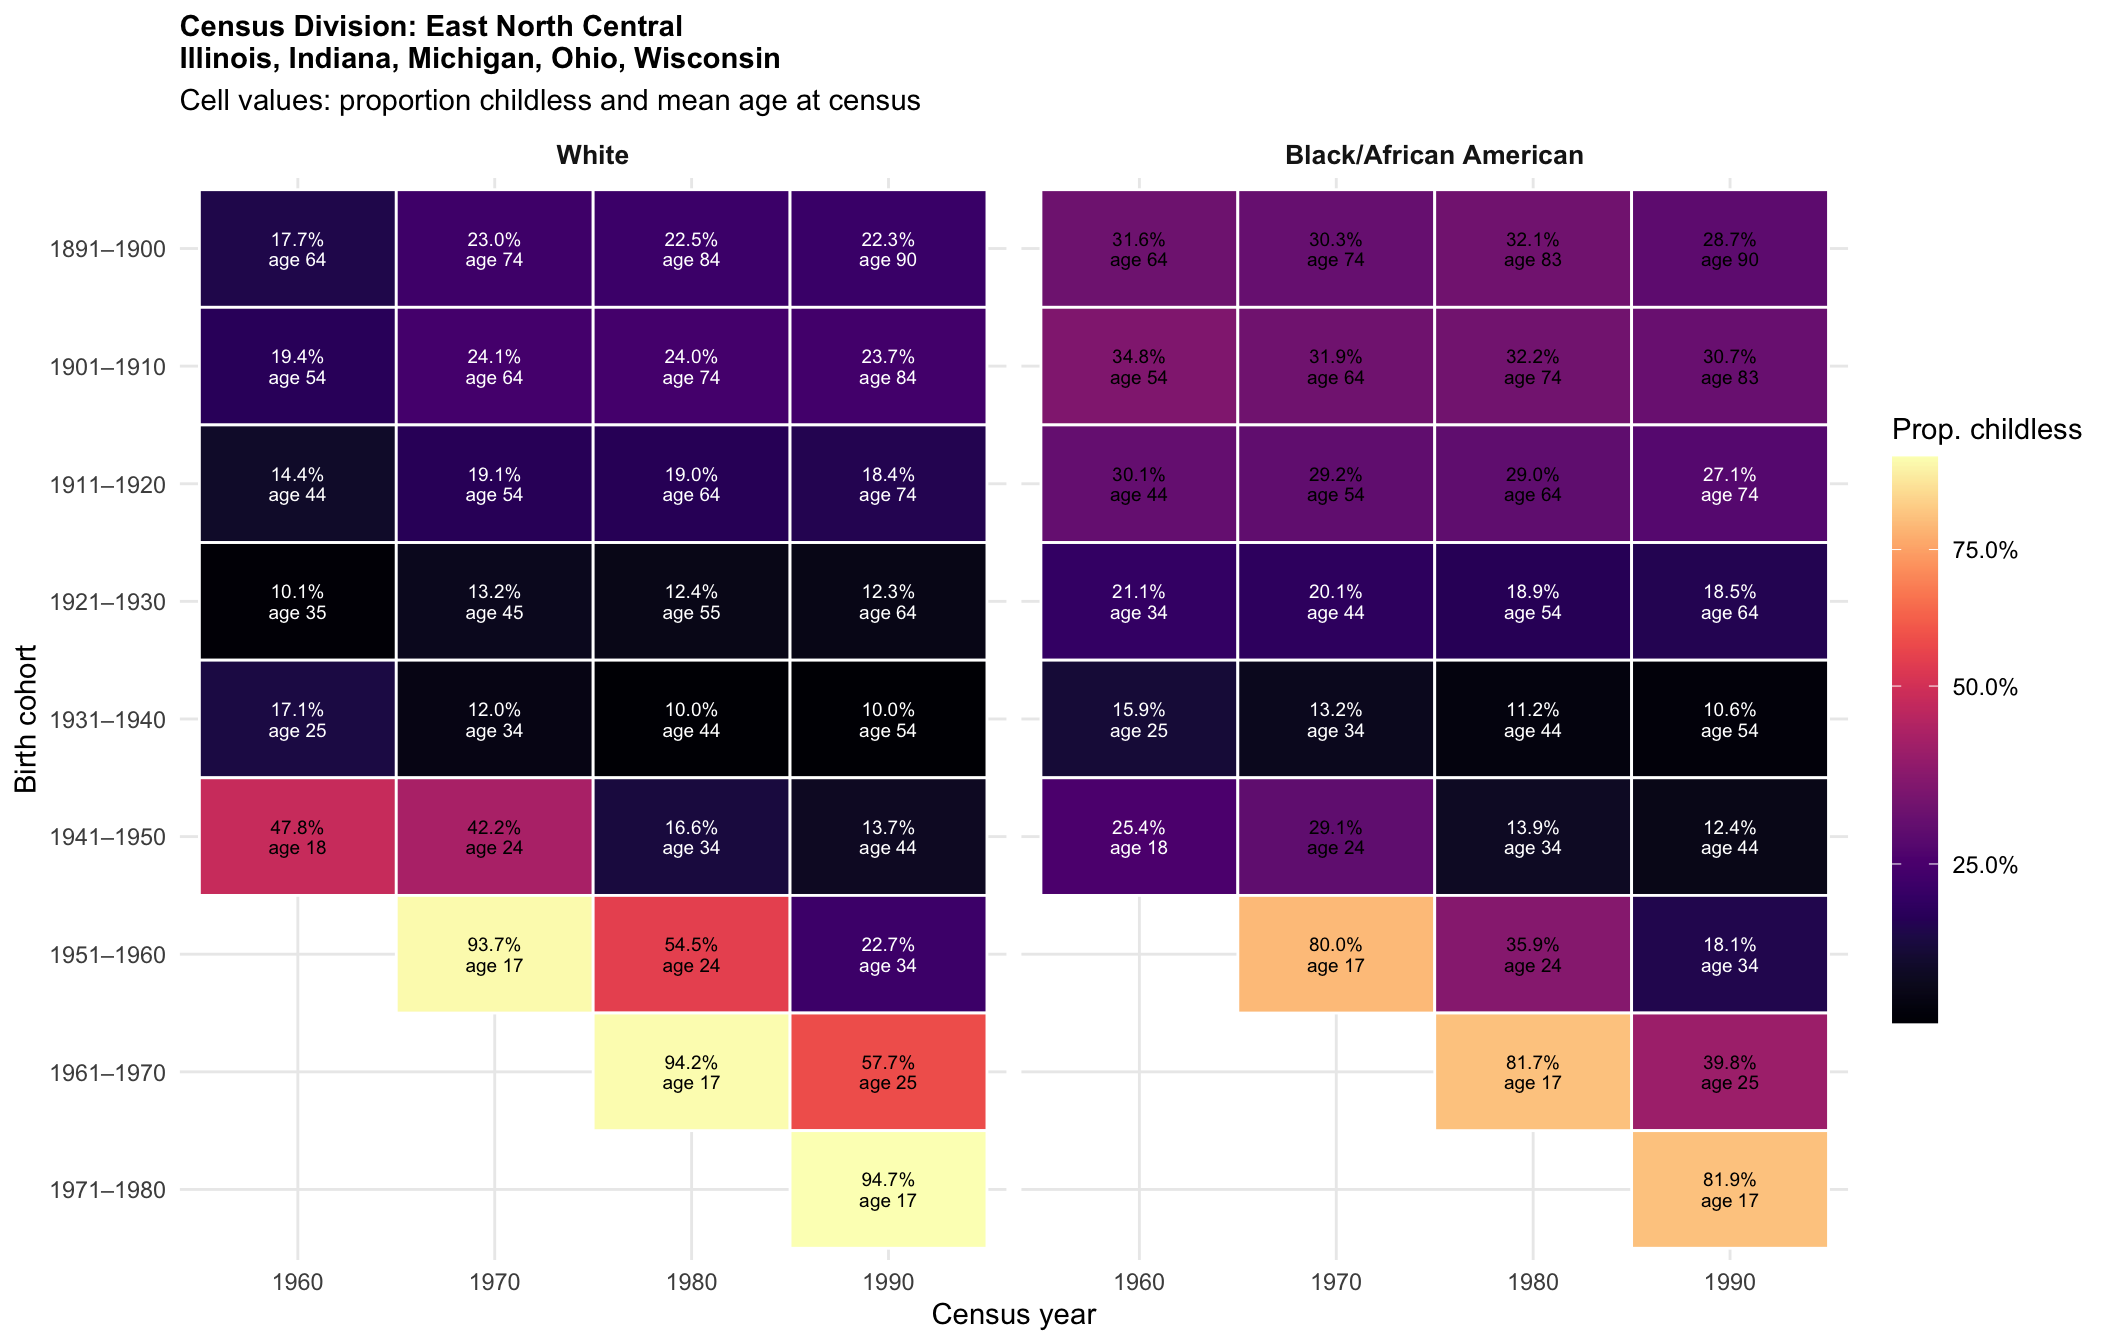
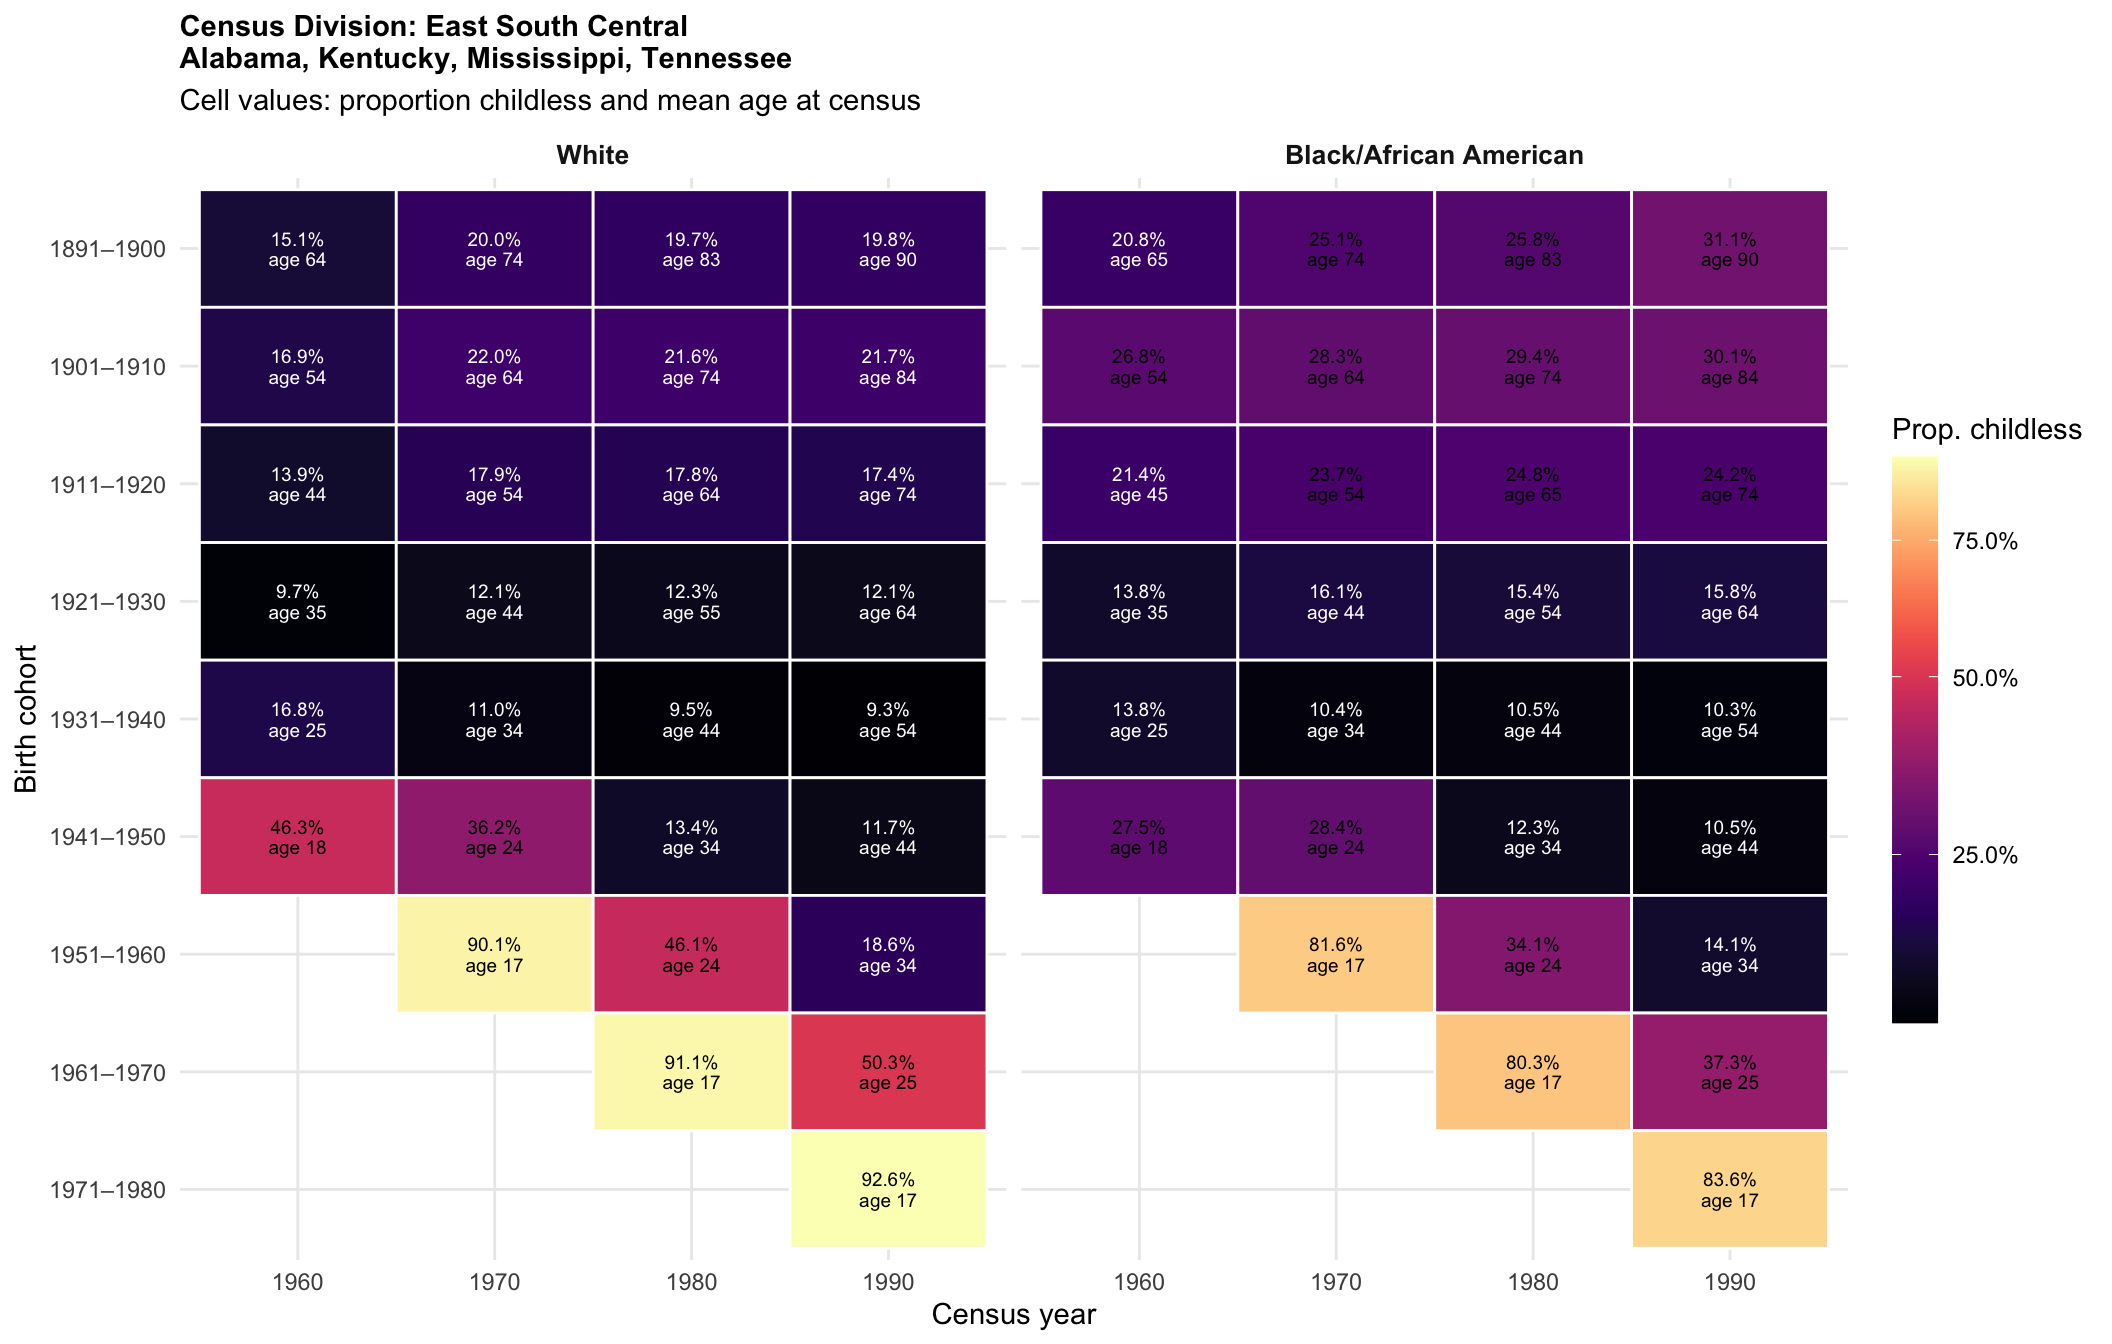
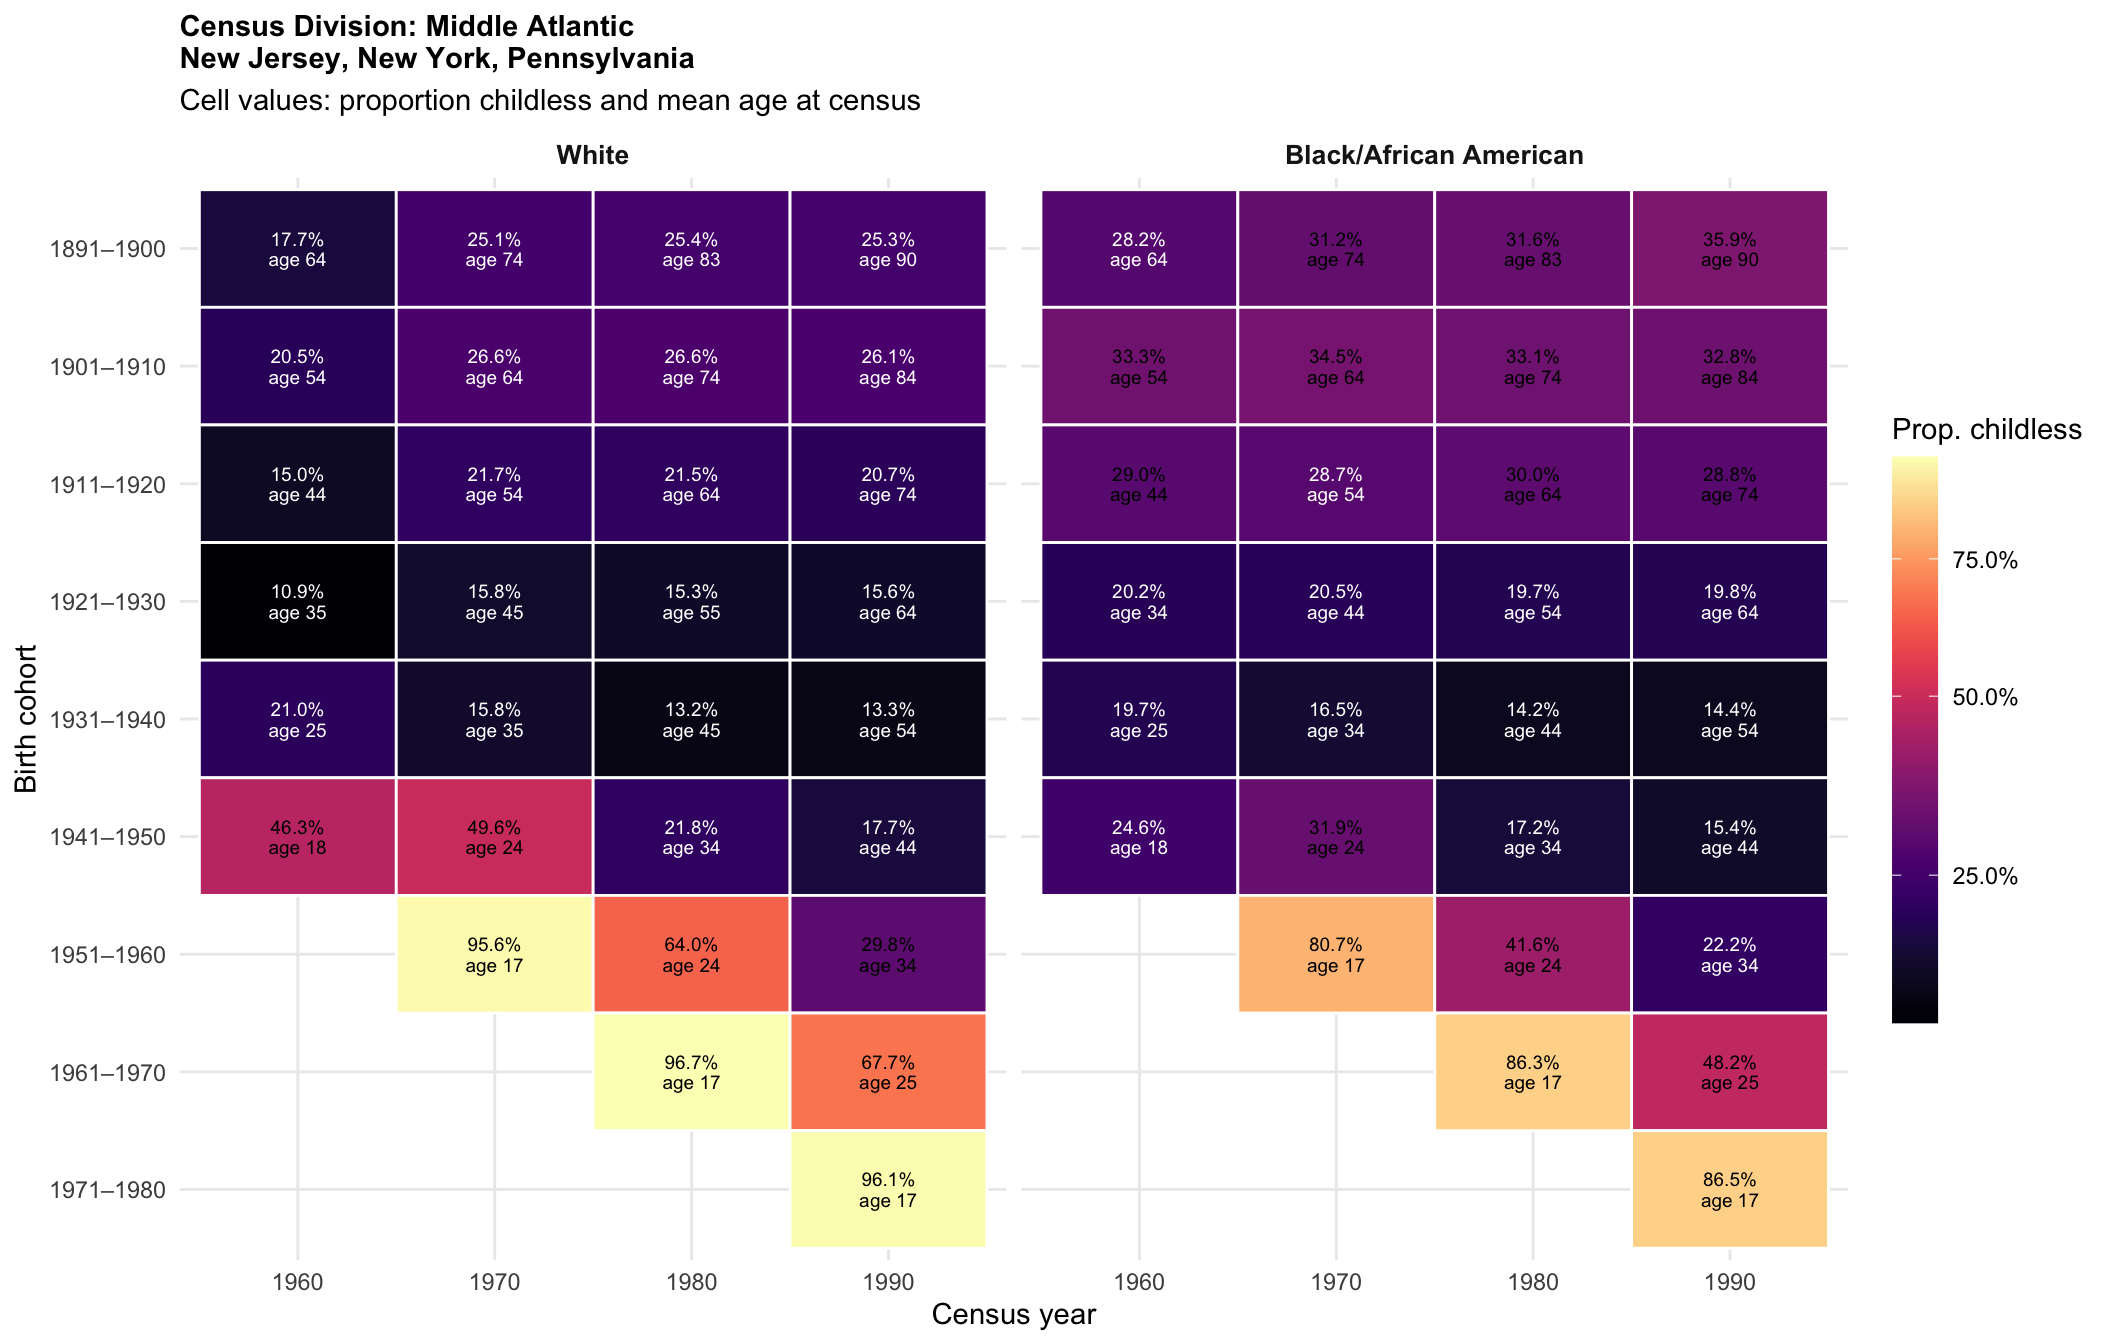
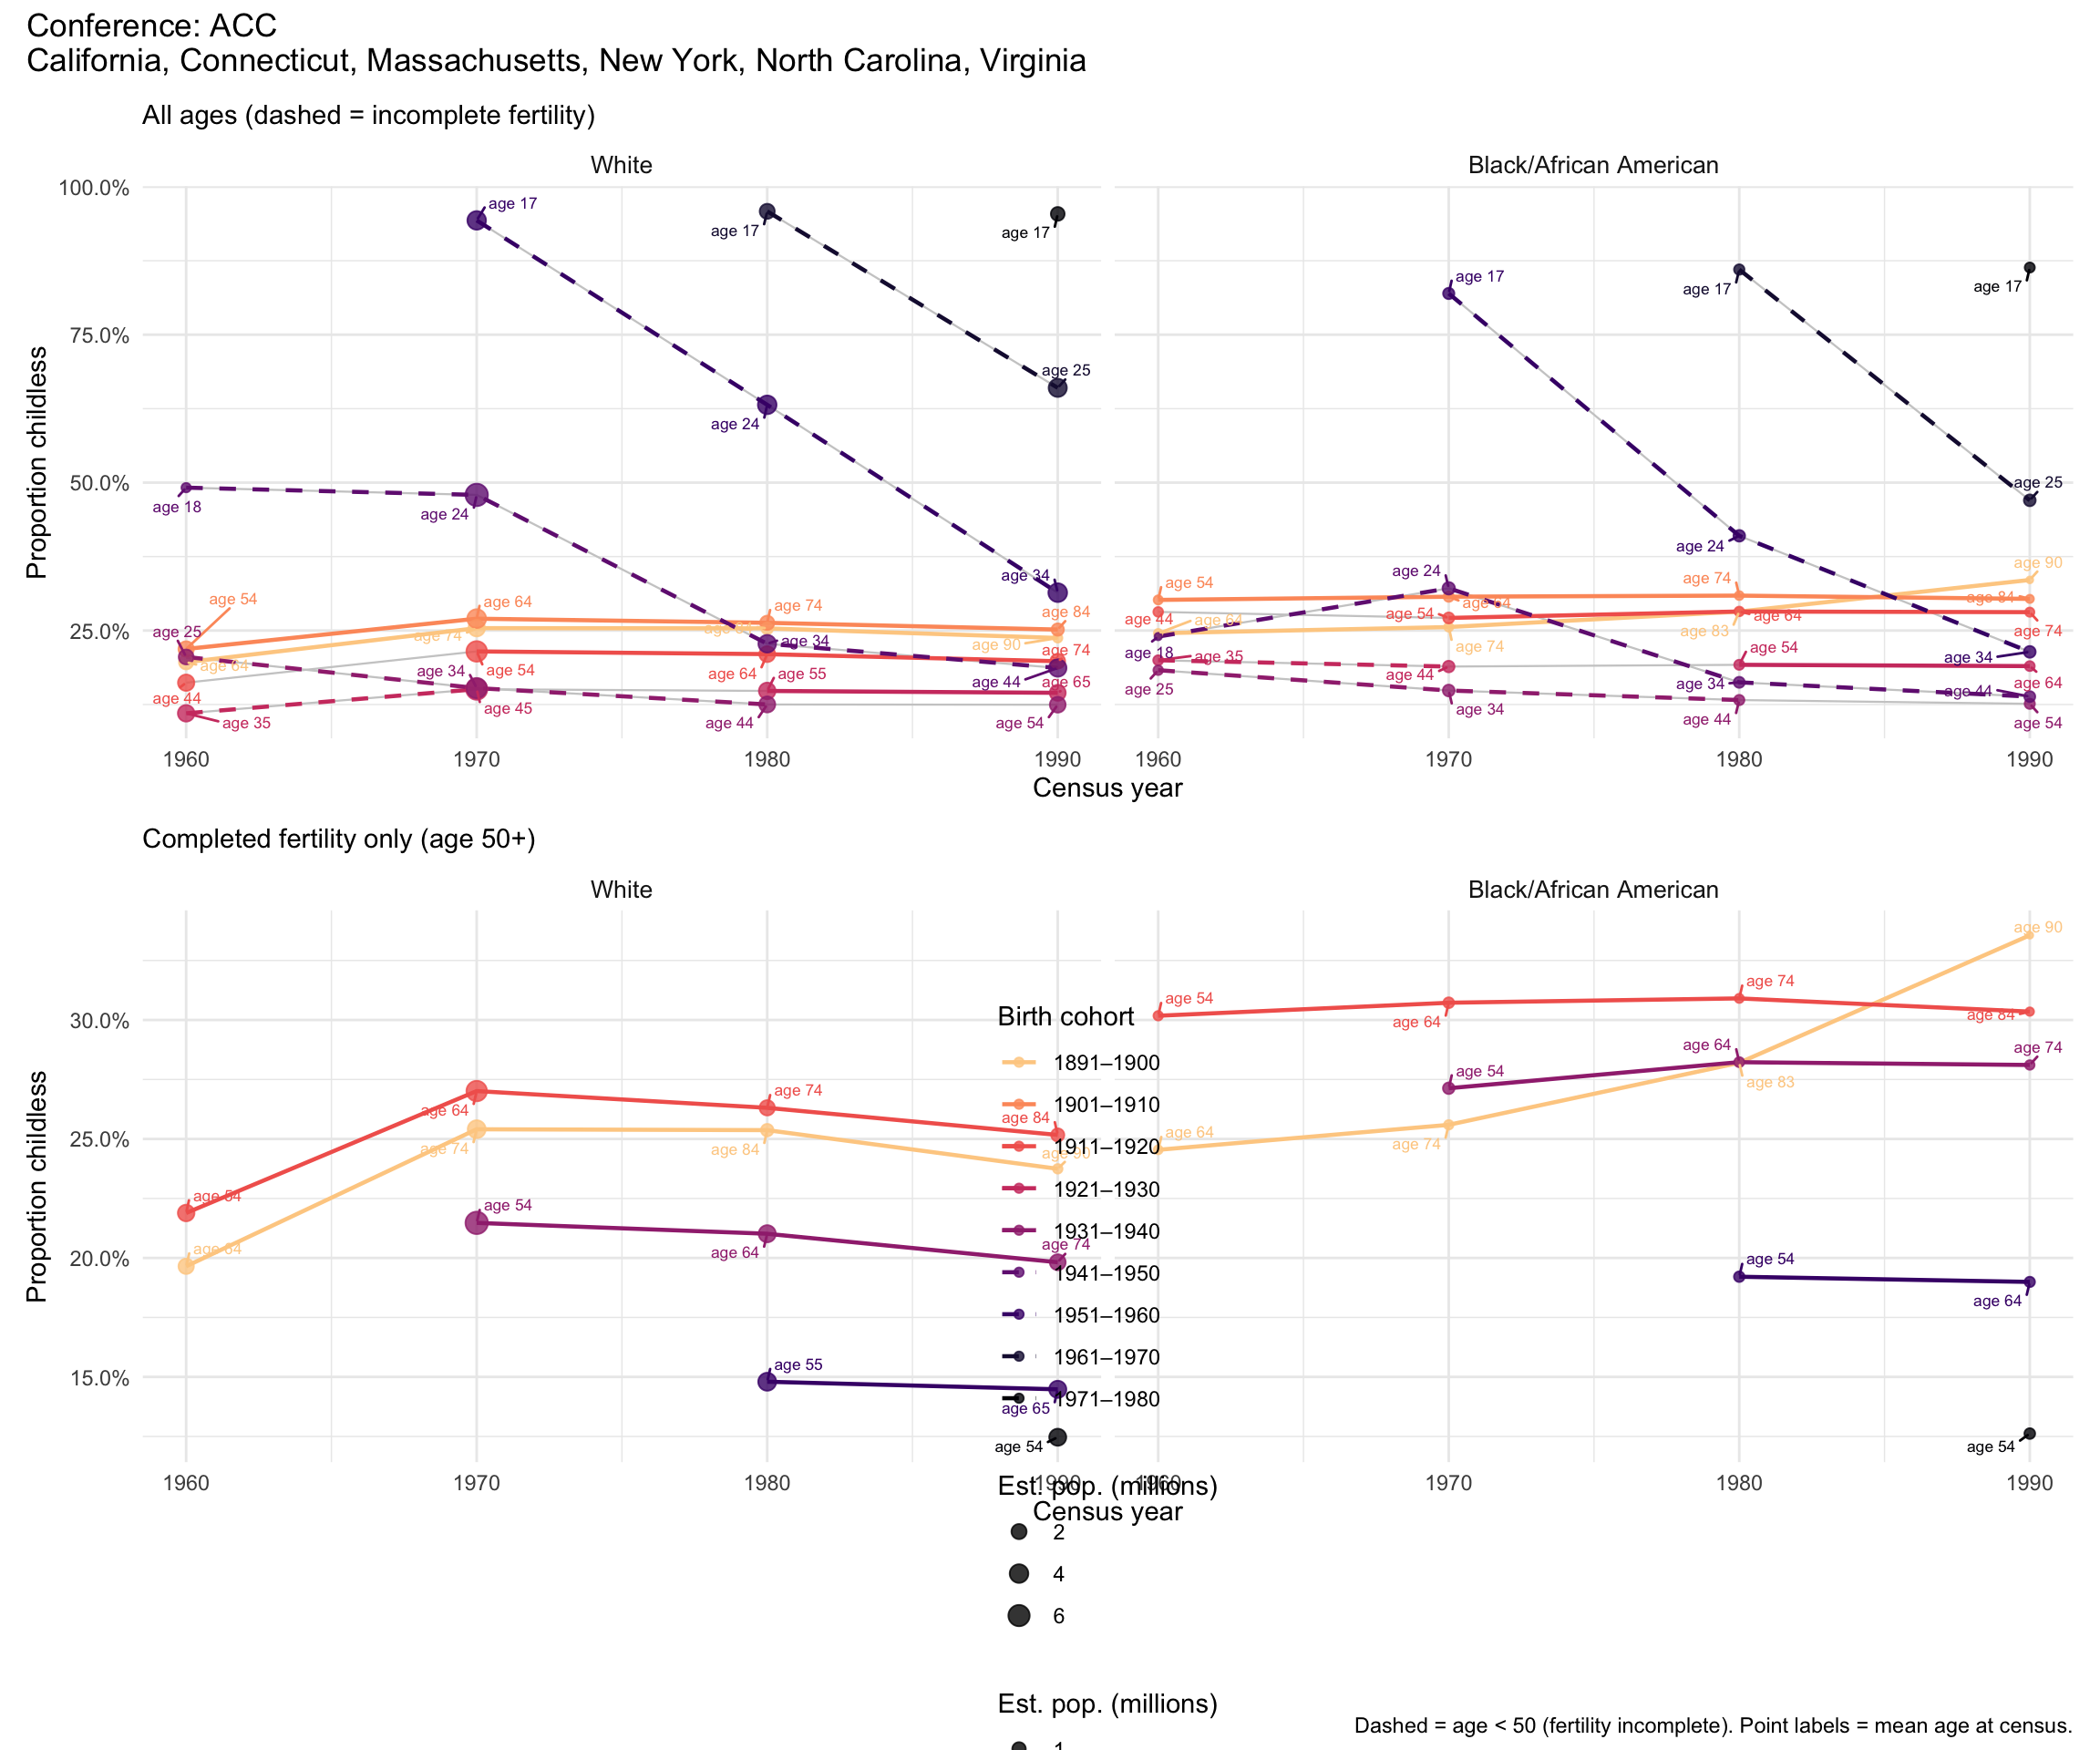
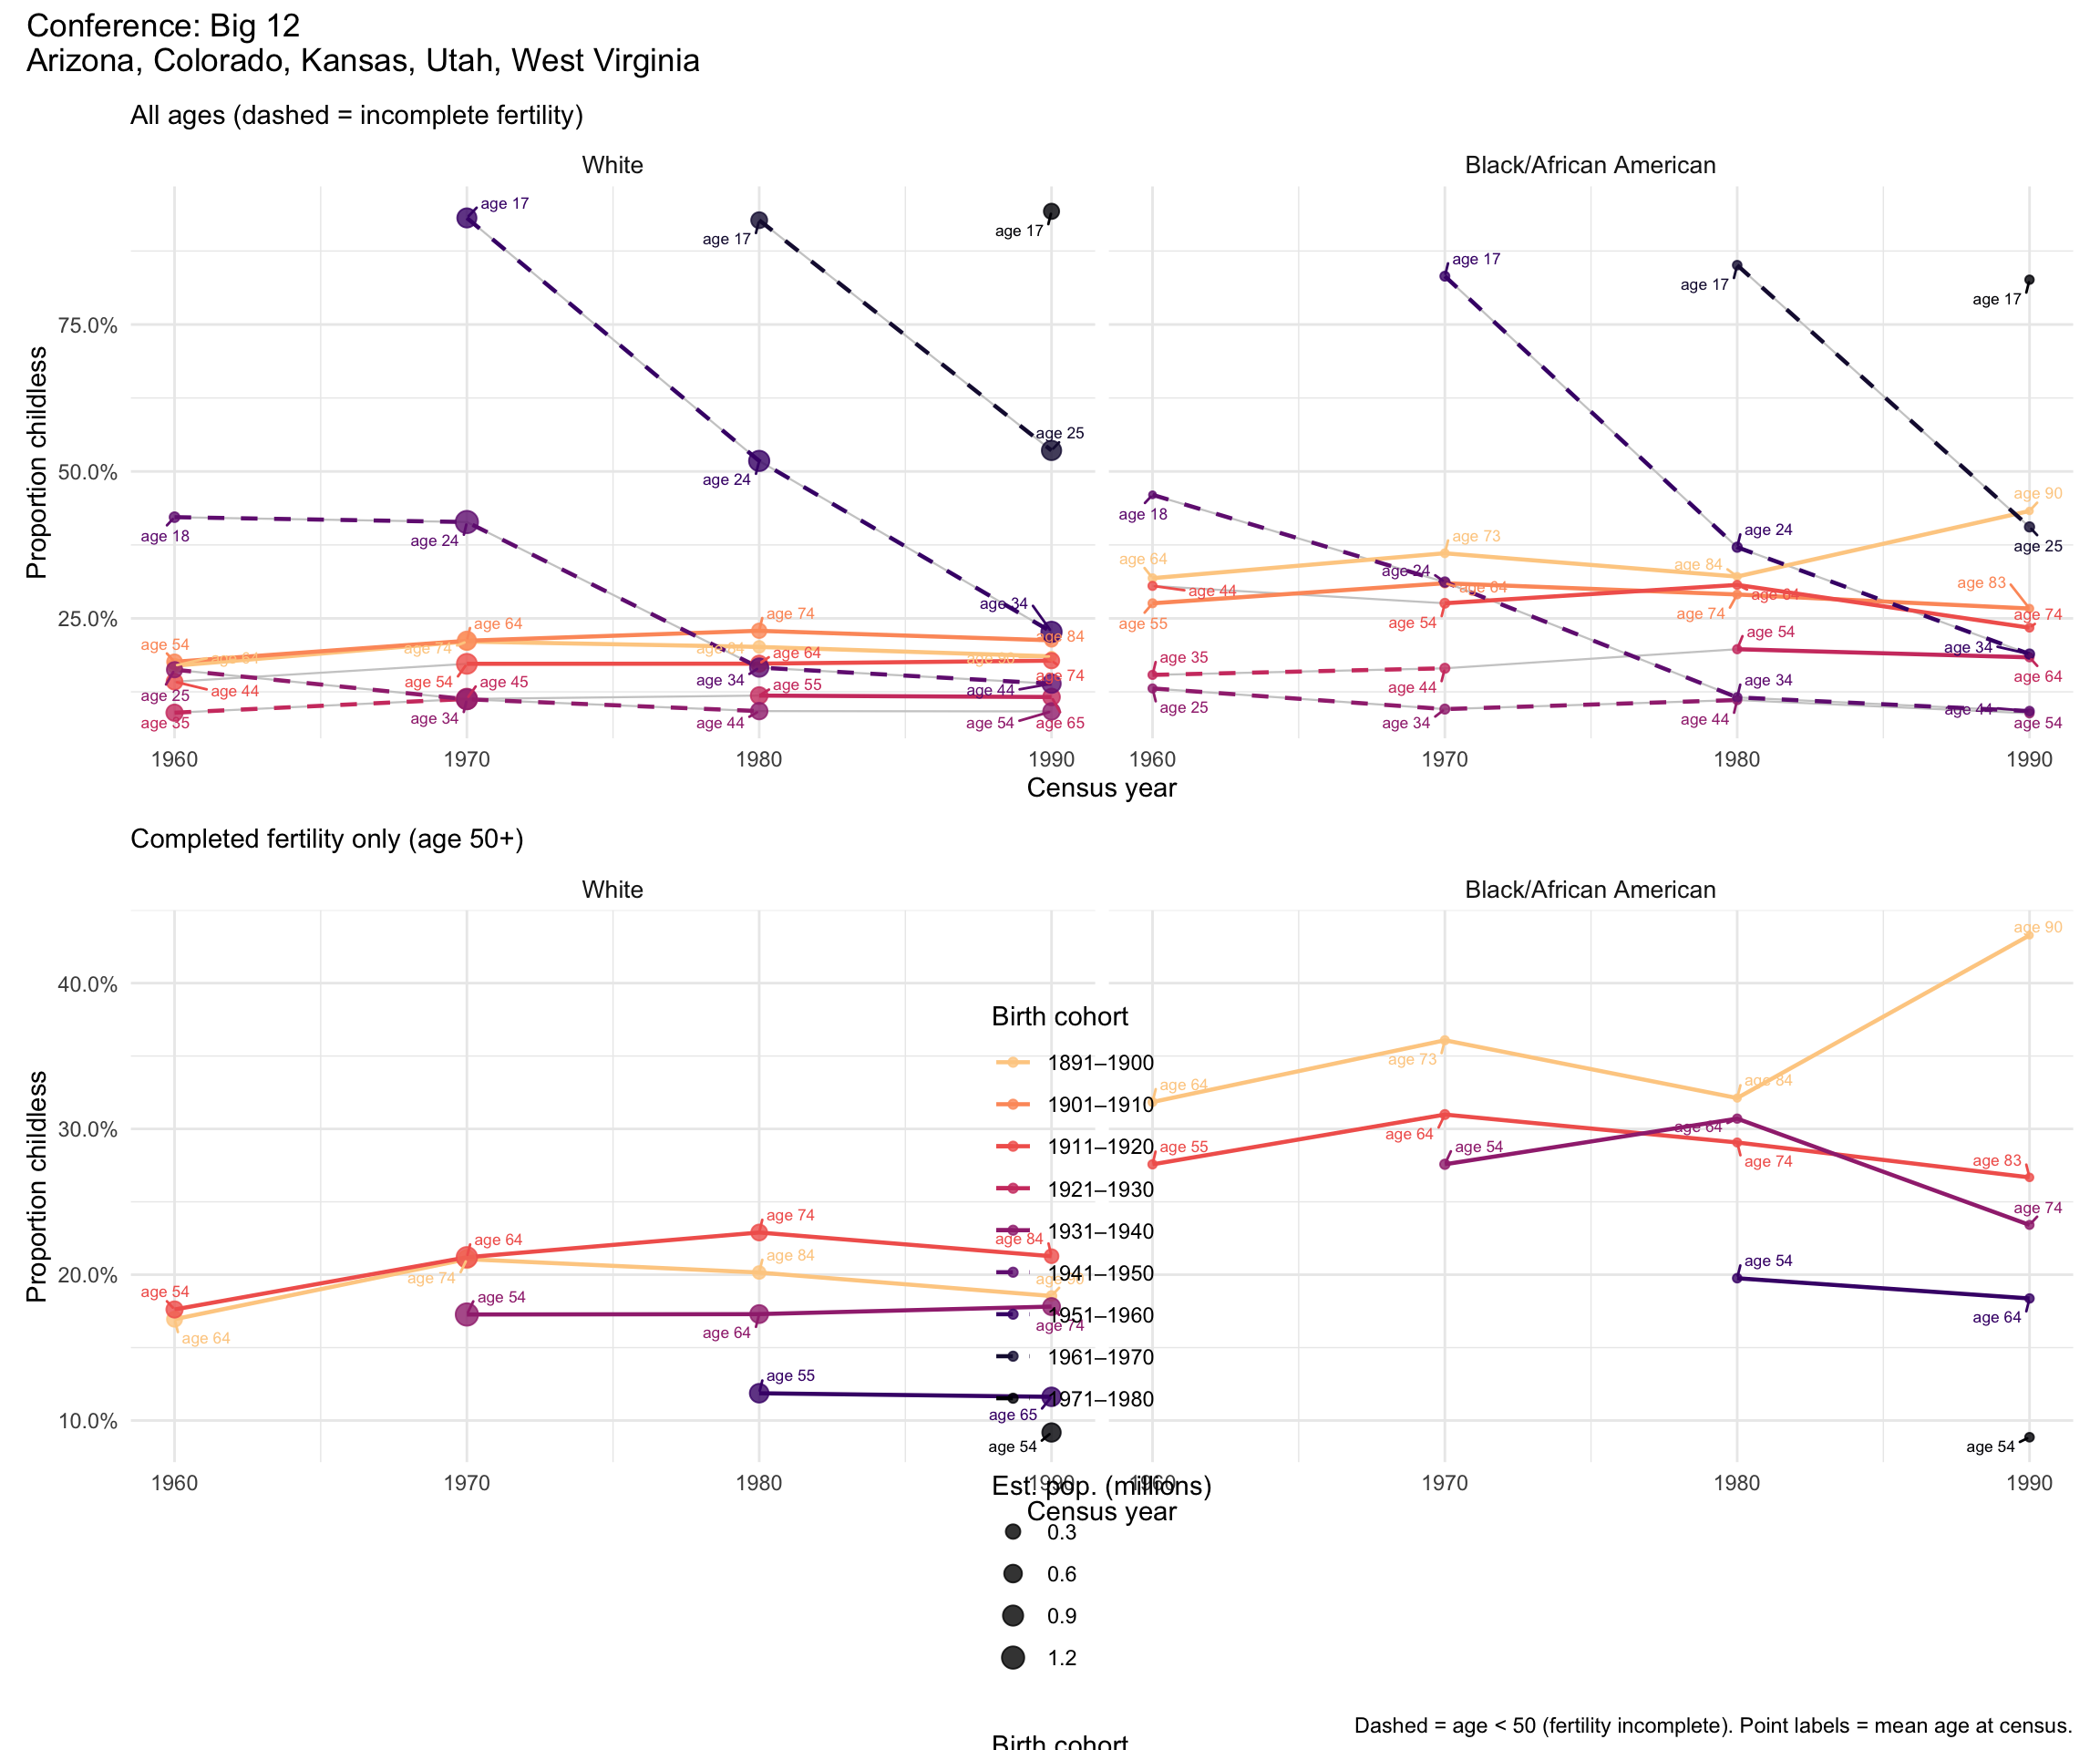
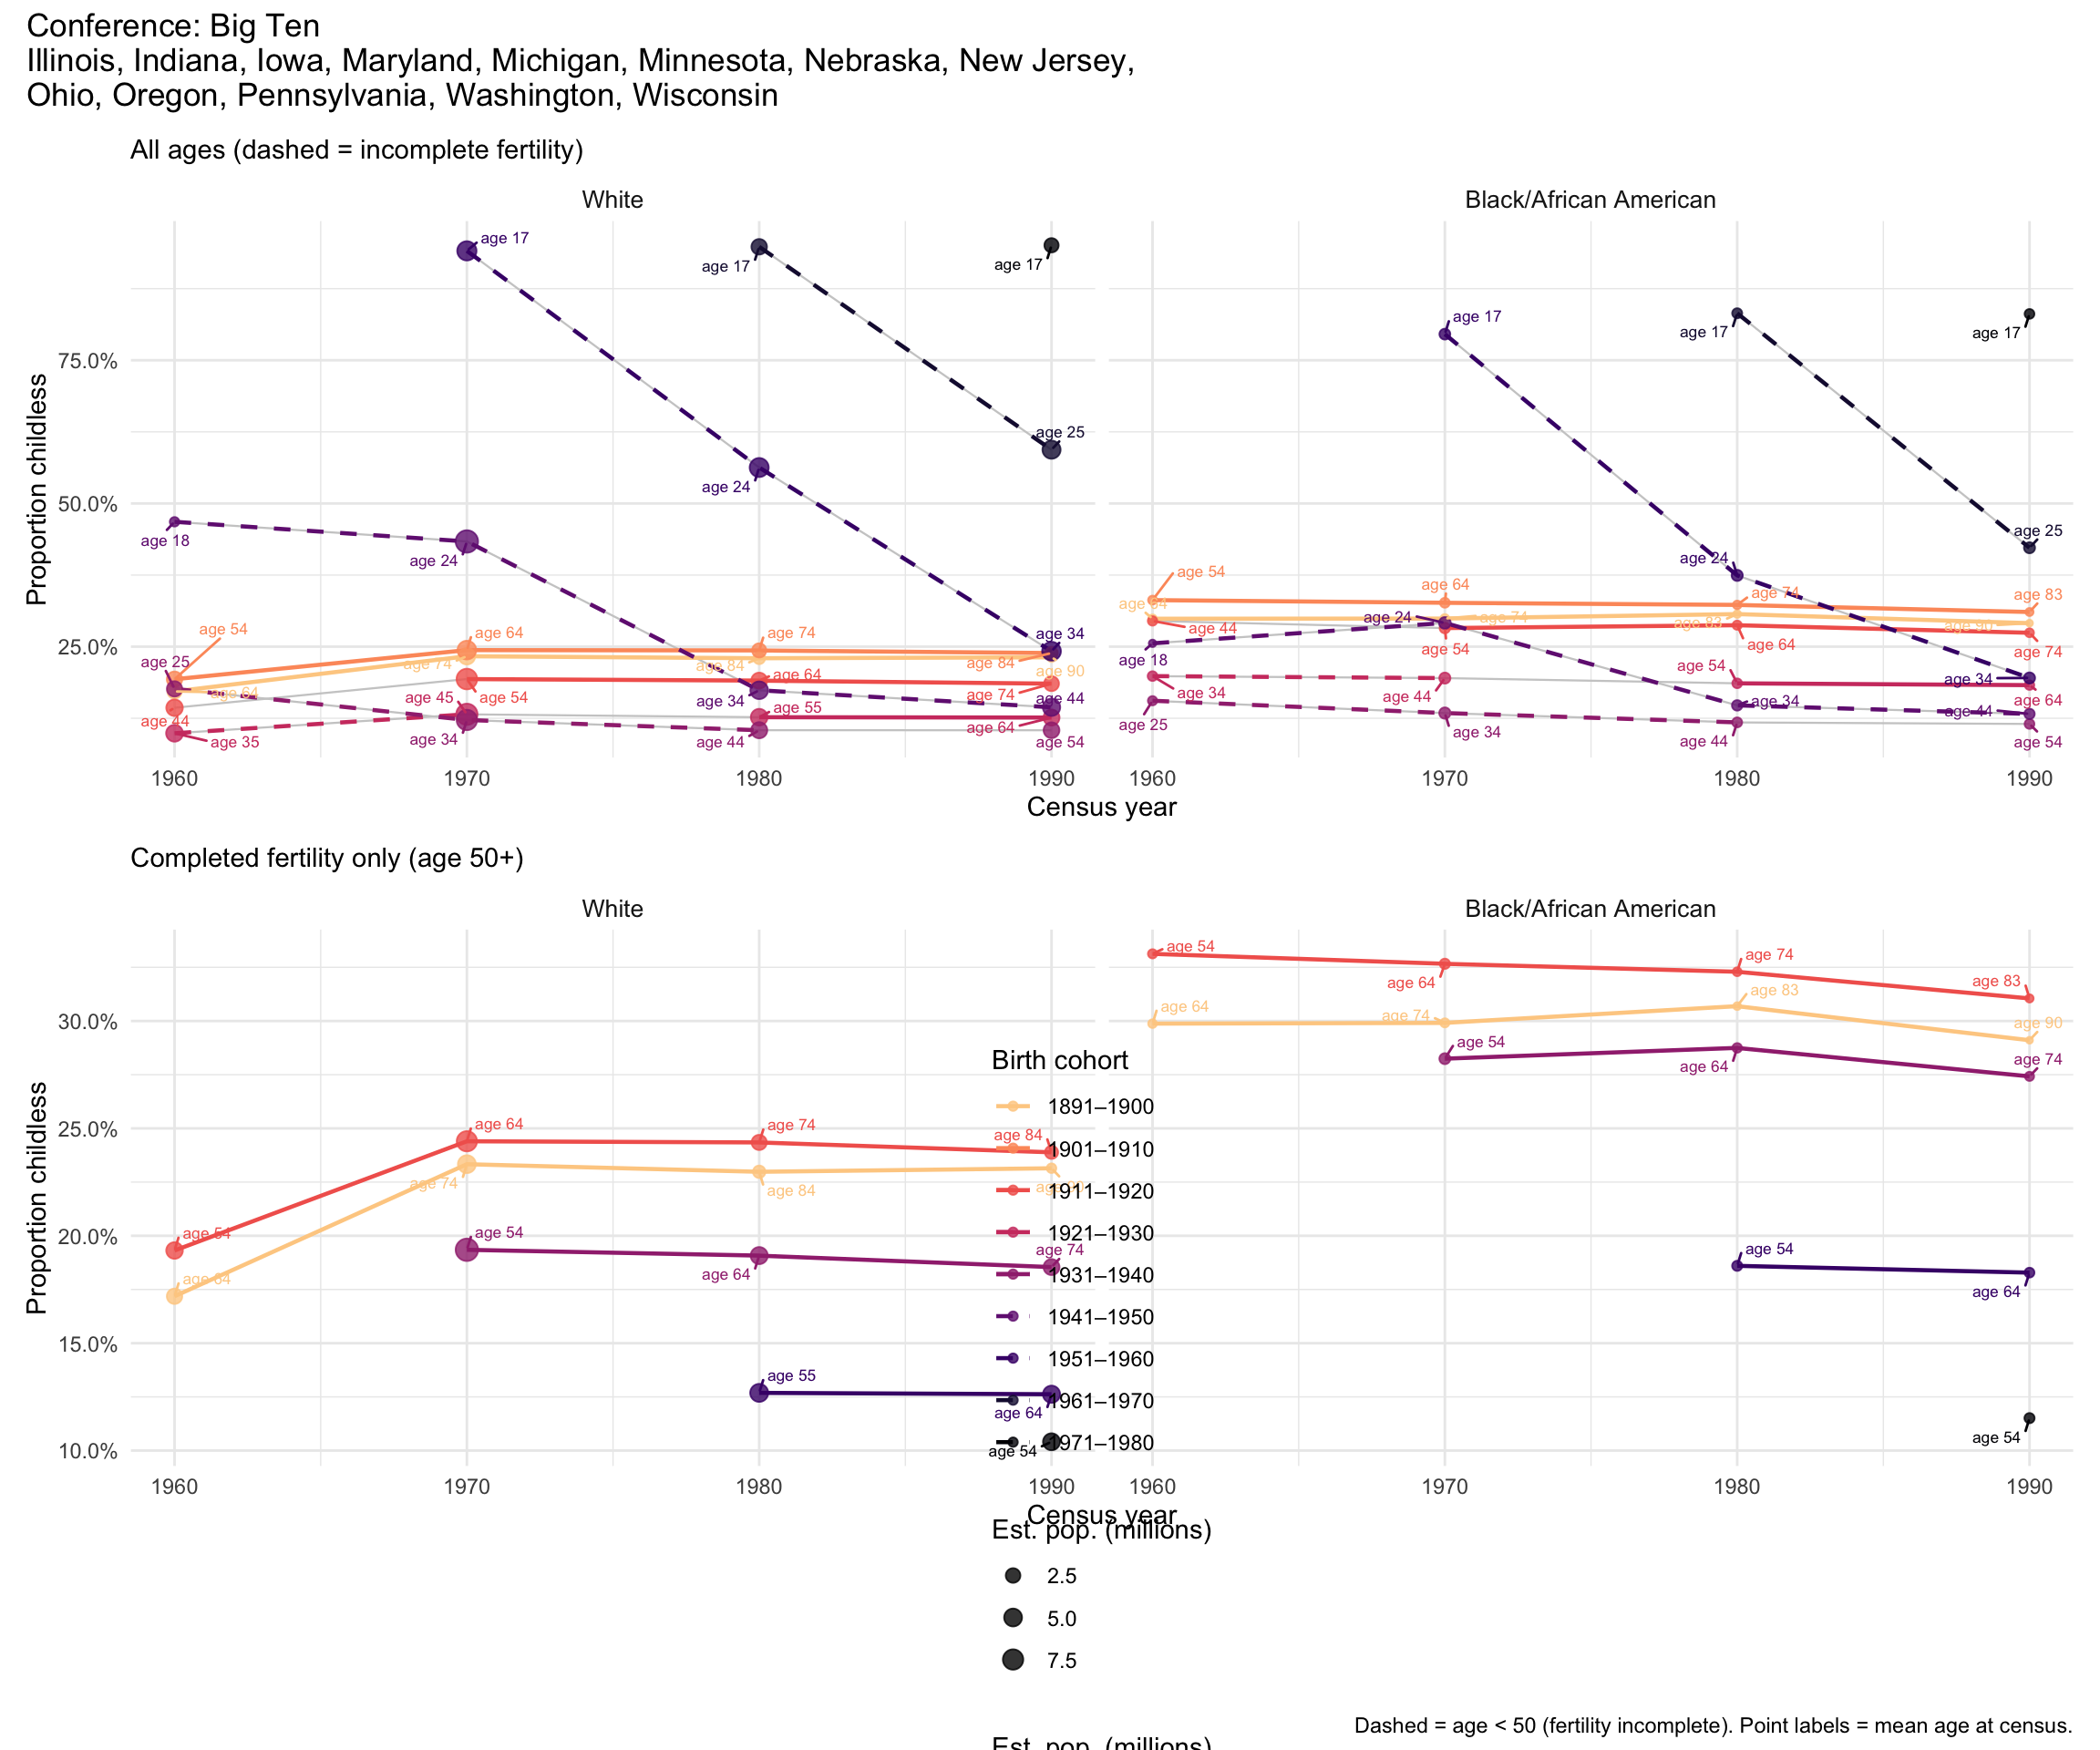
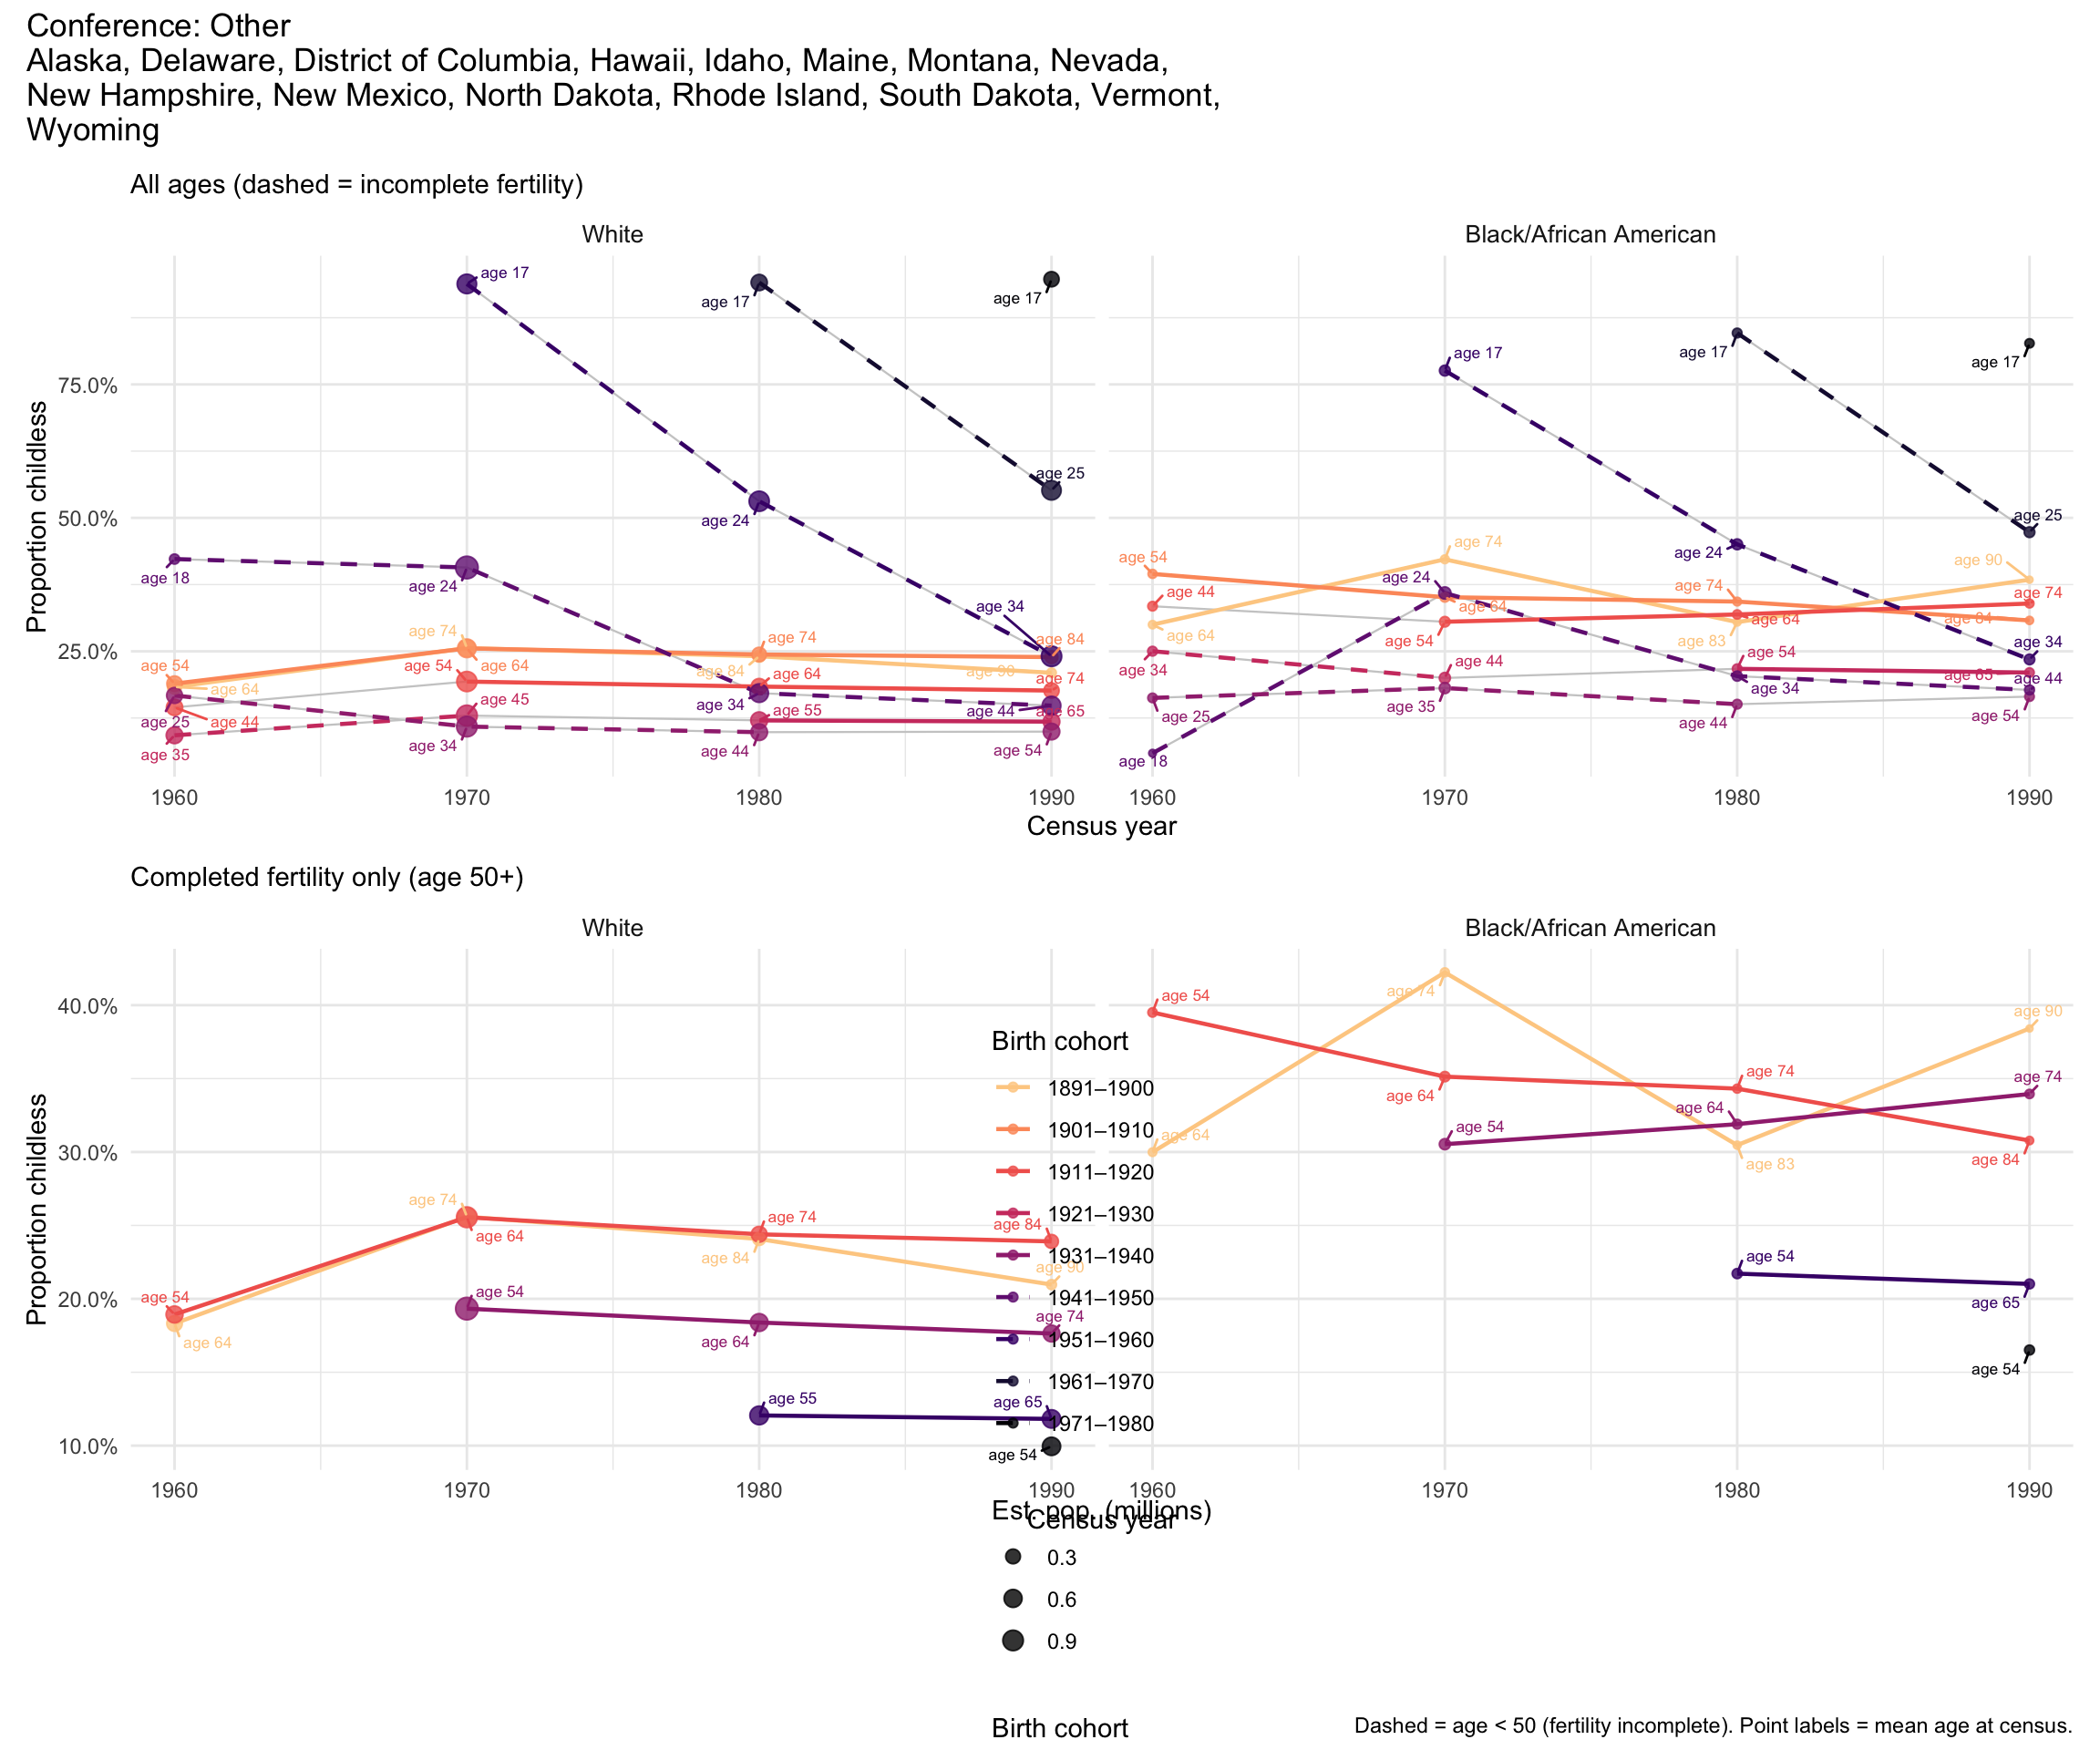
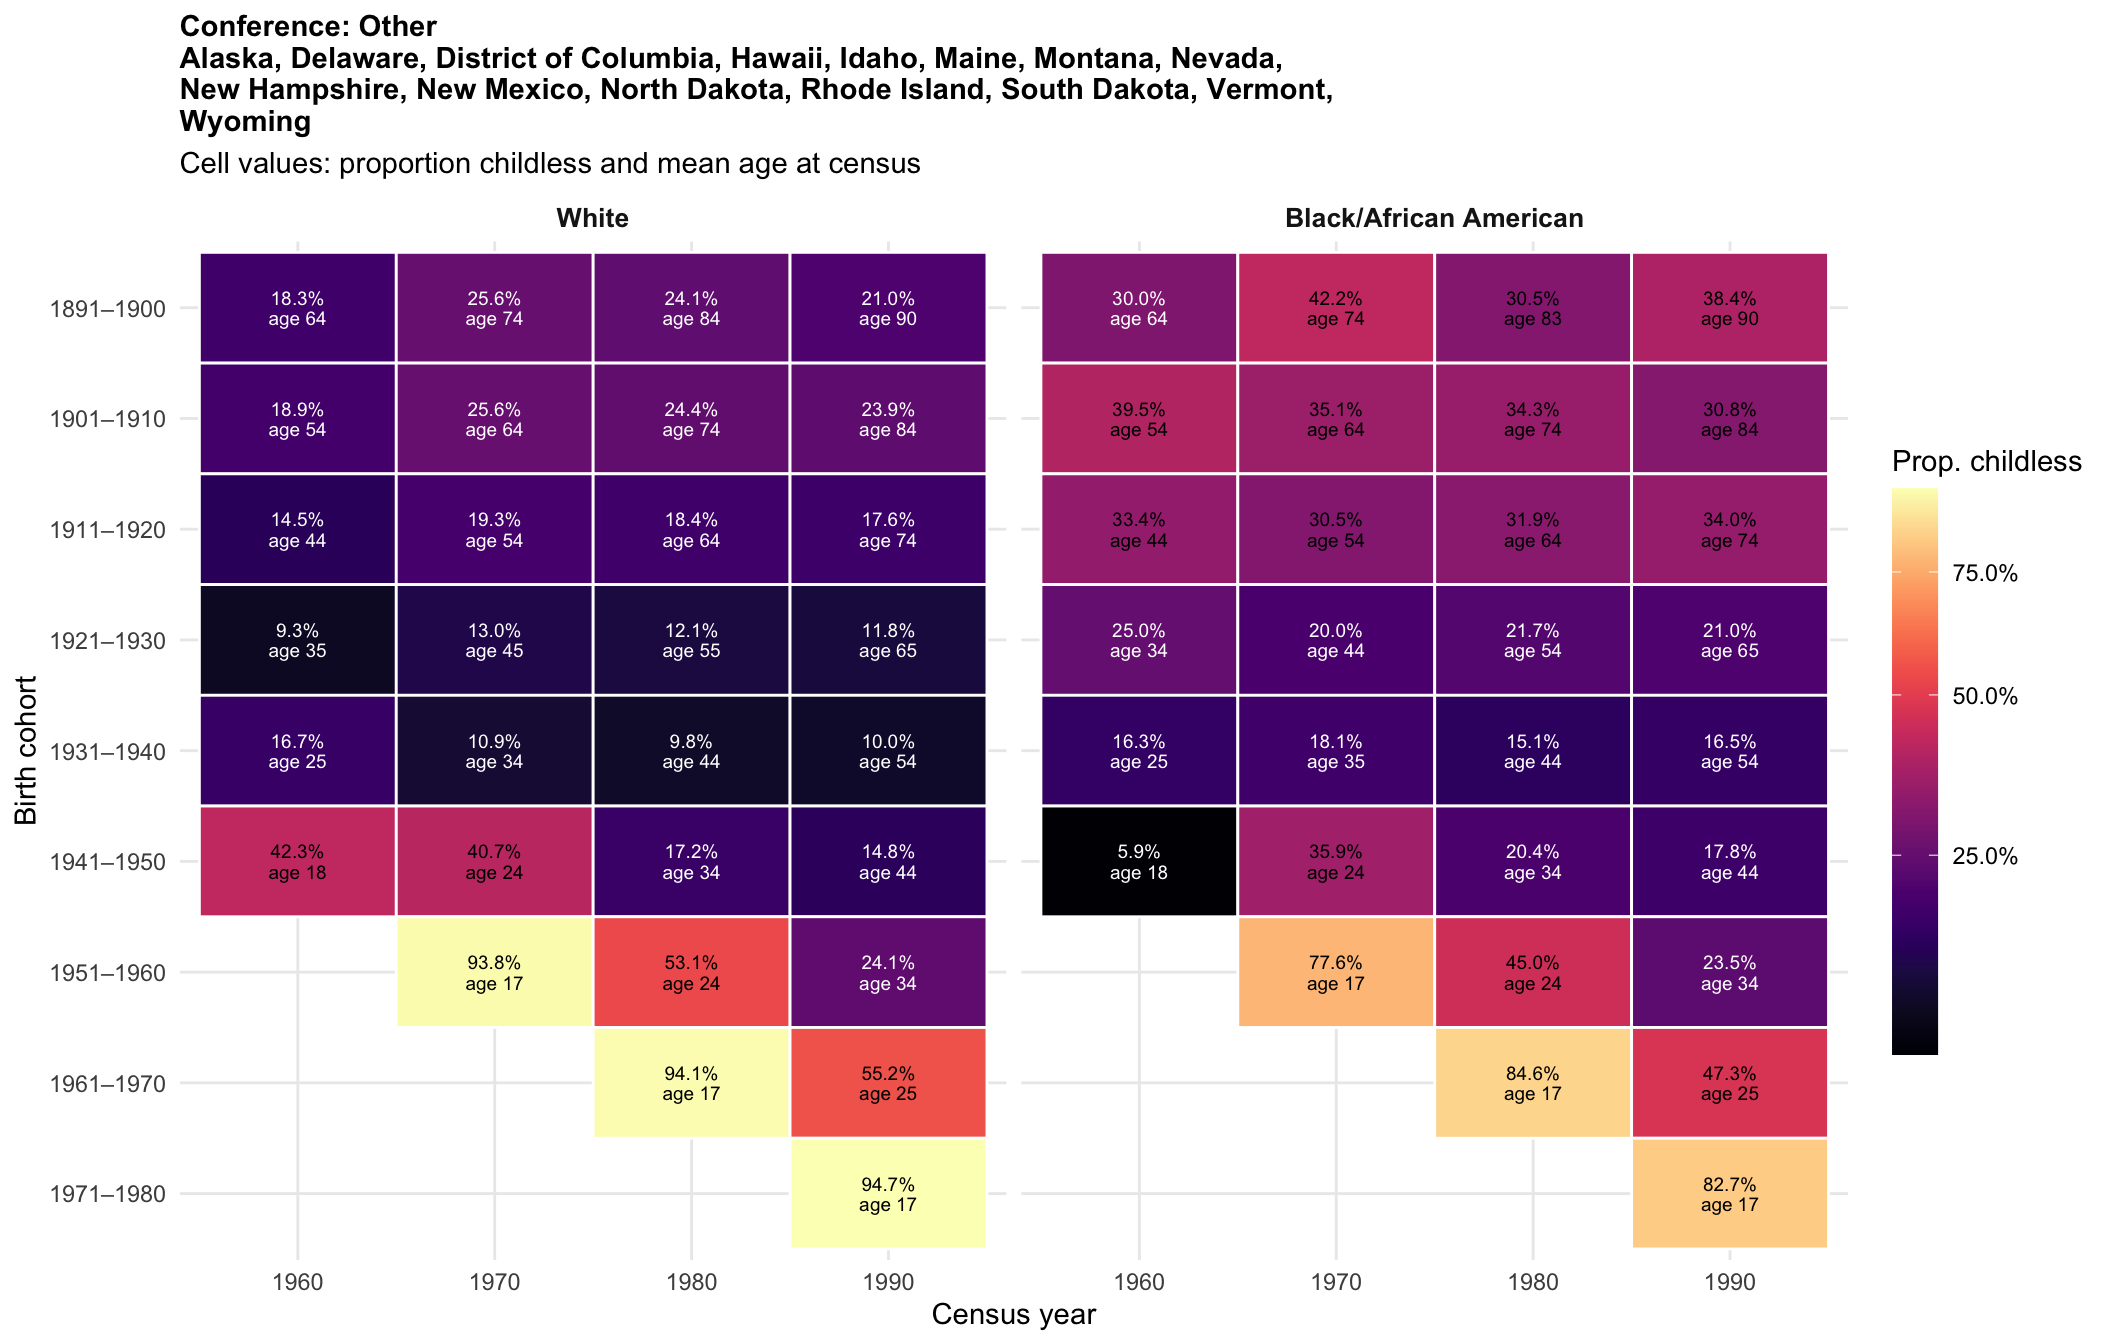
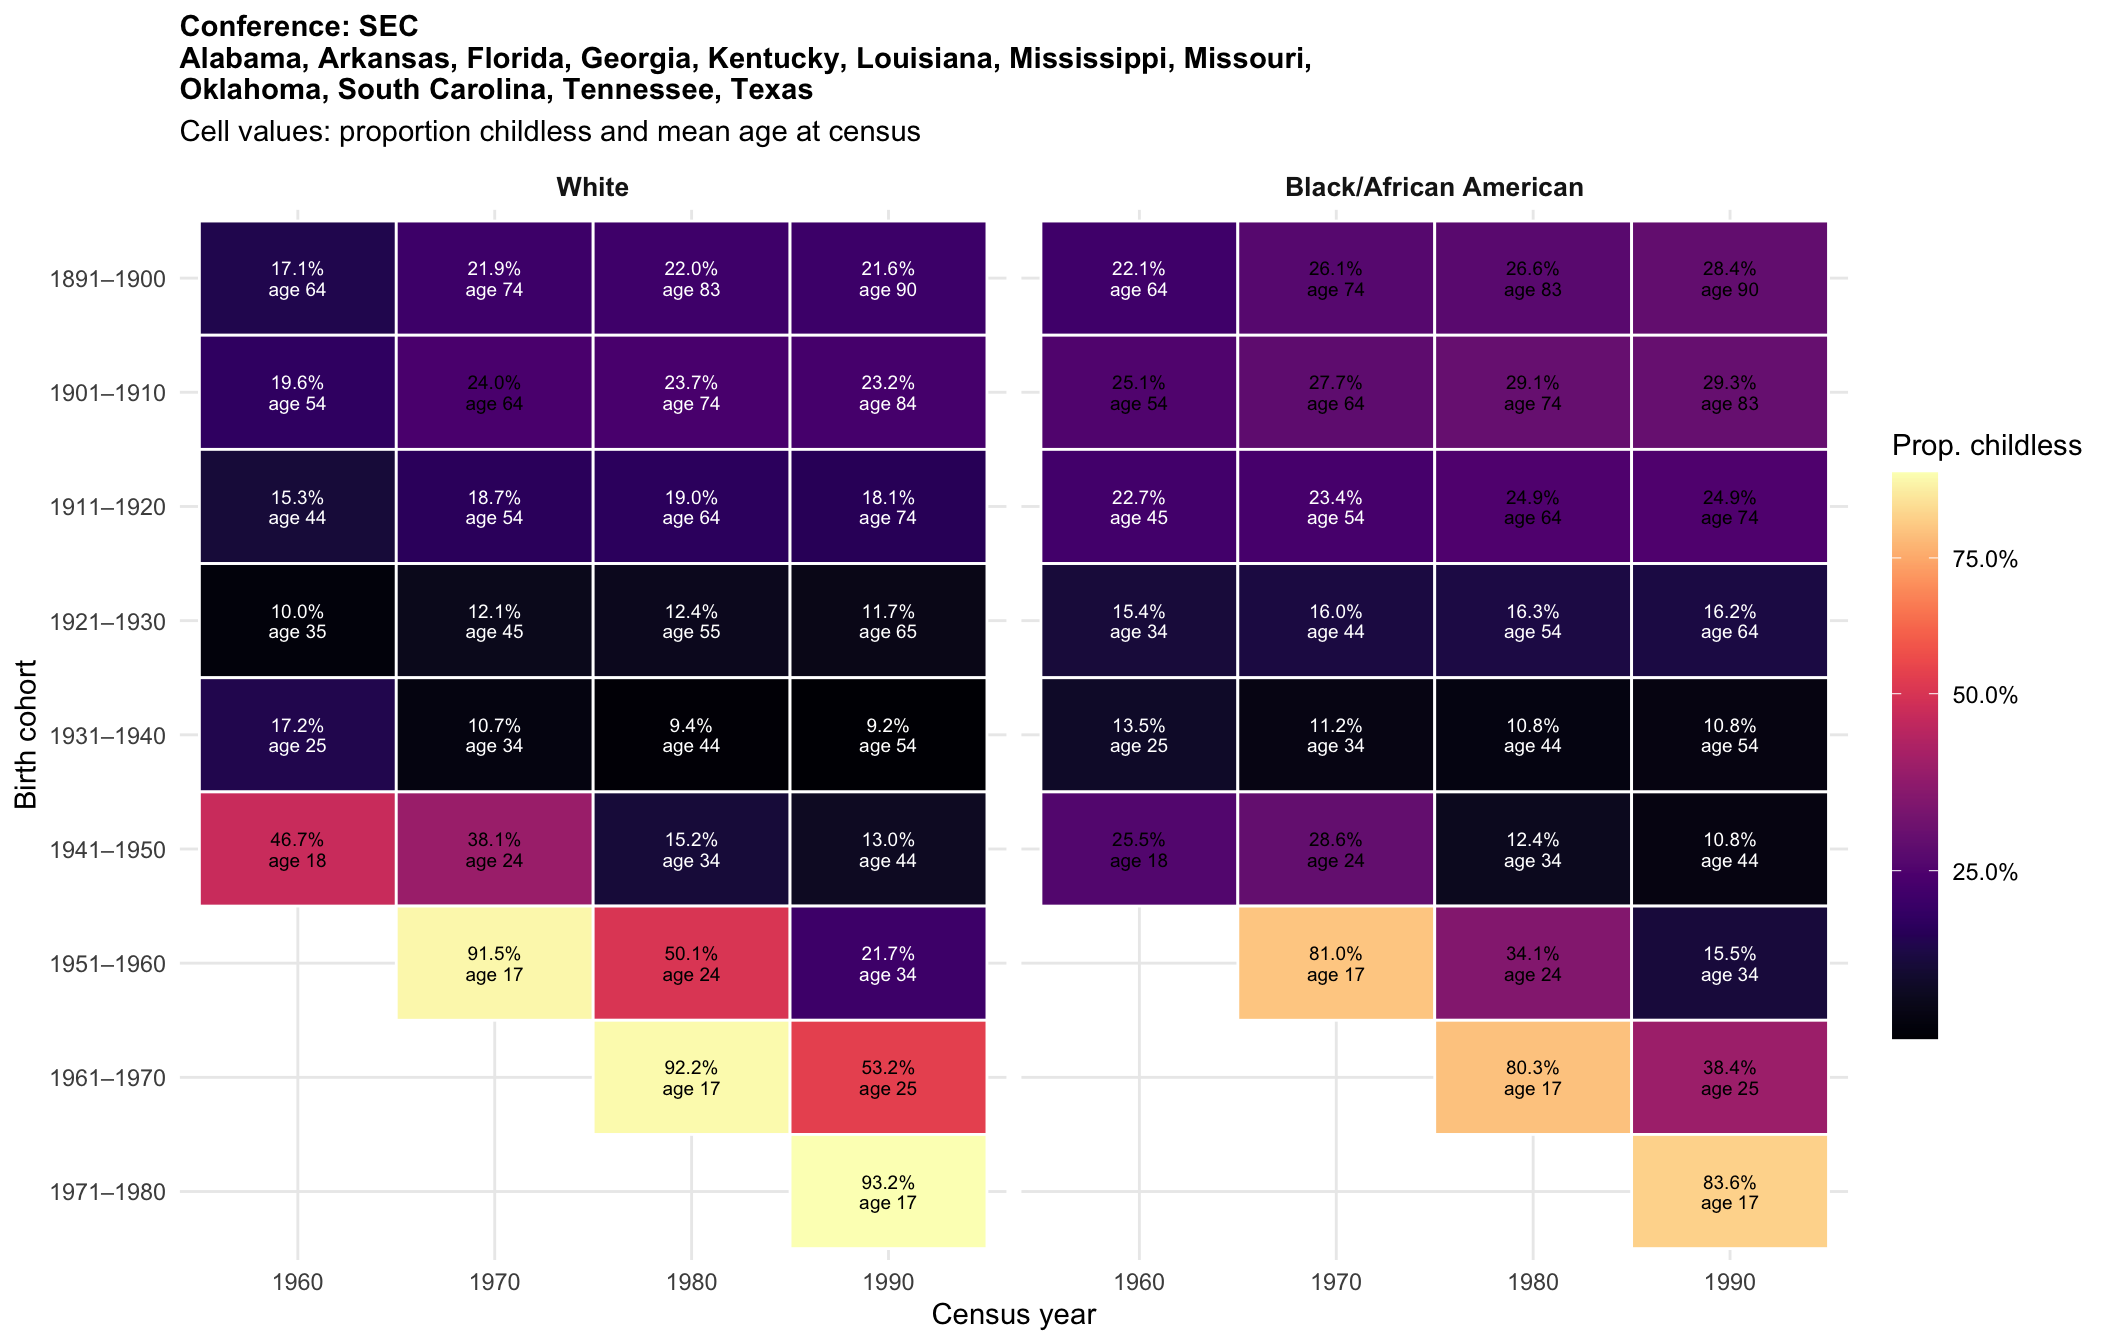
9. Cohort analysis: childlessness across age groups
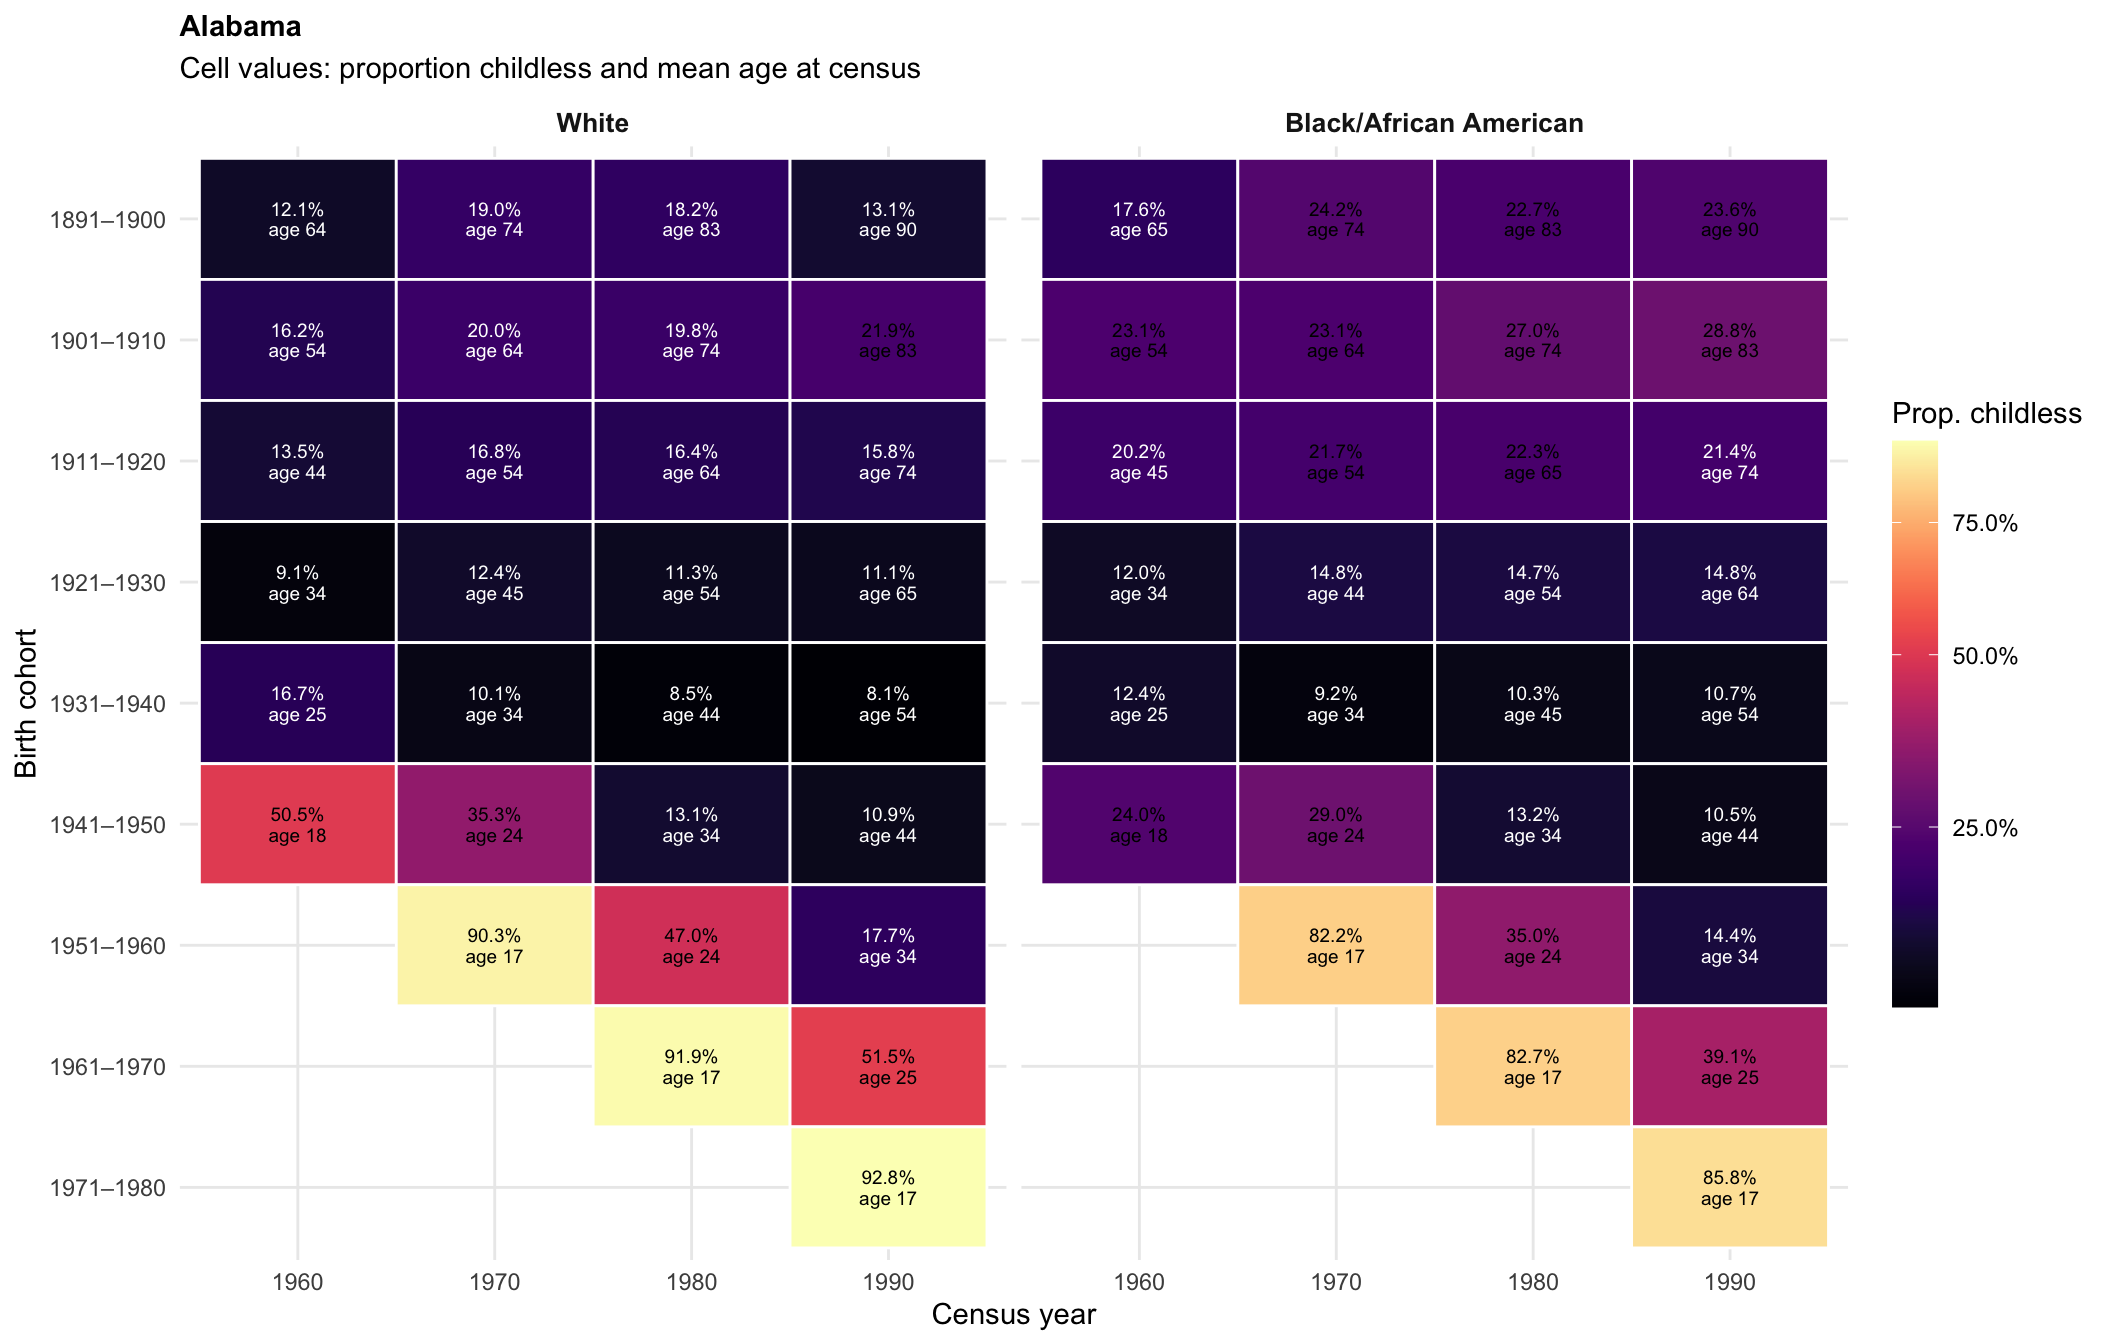
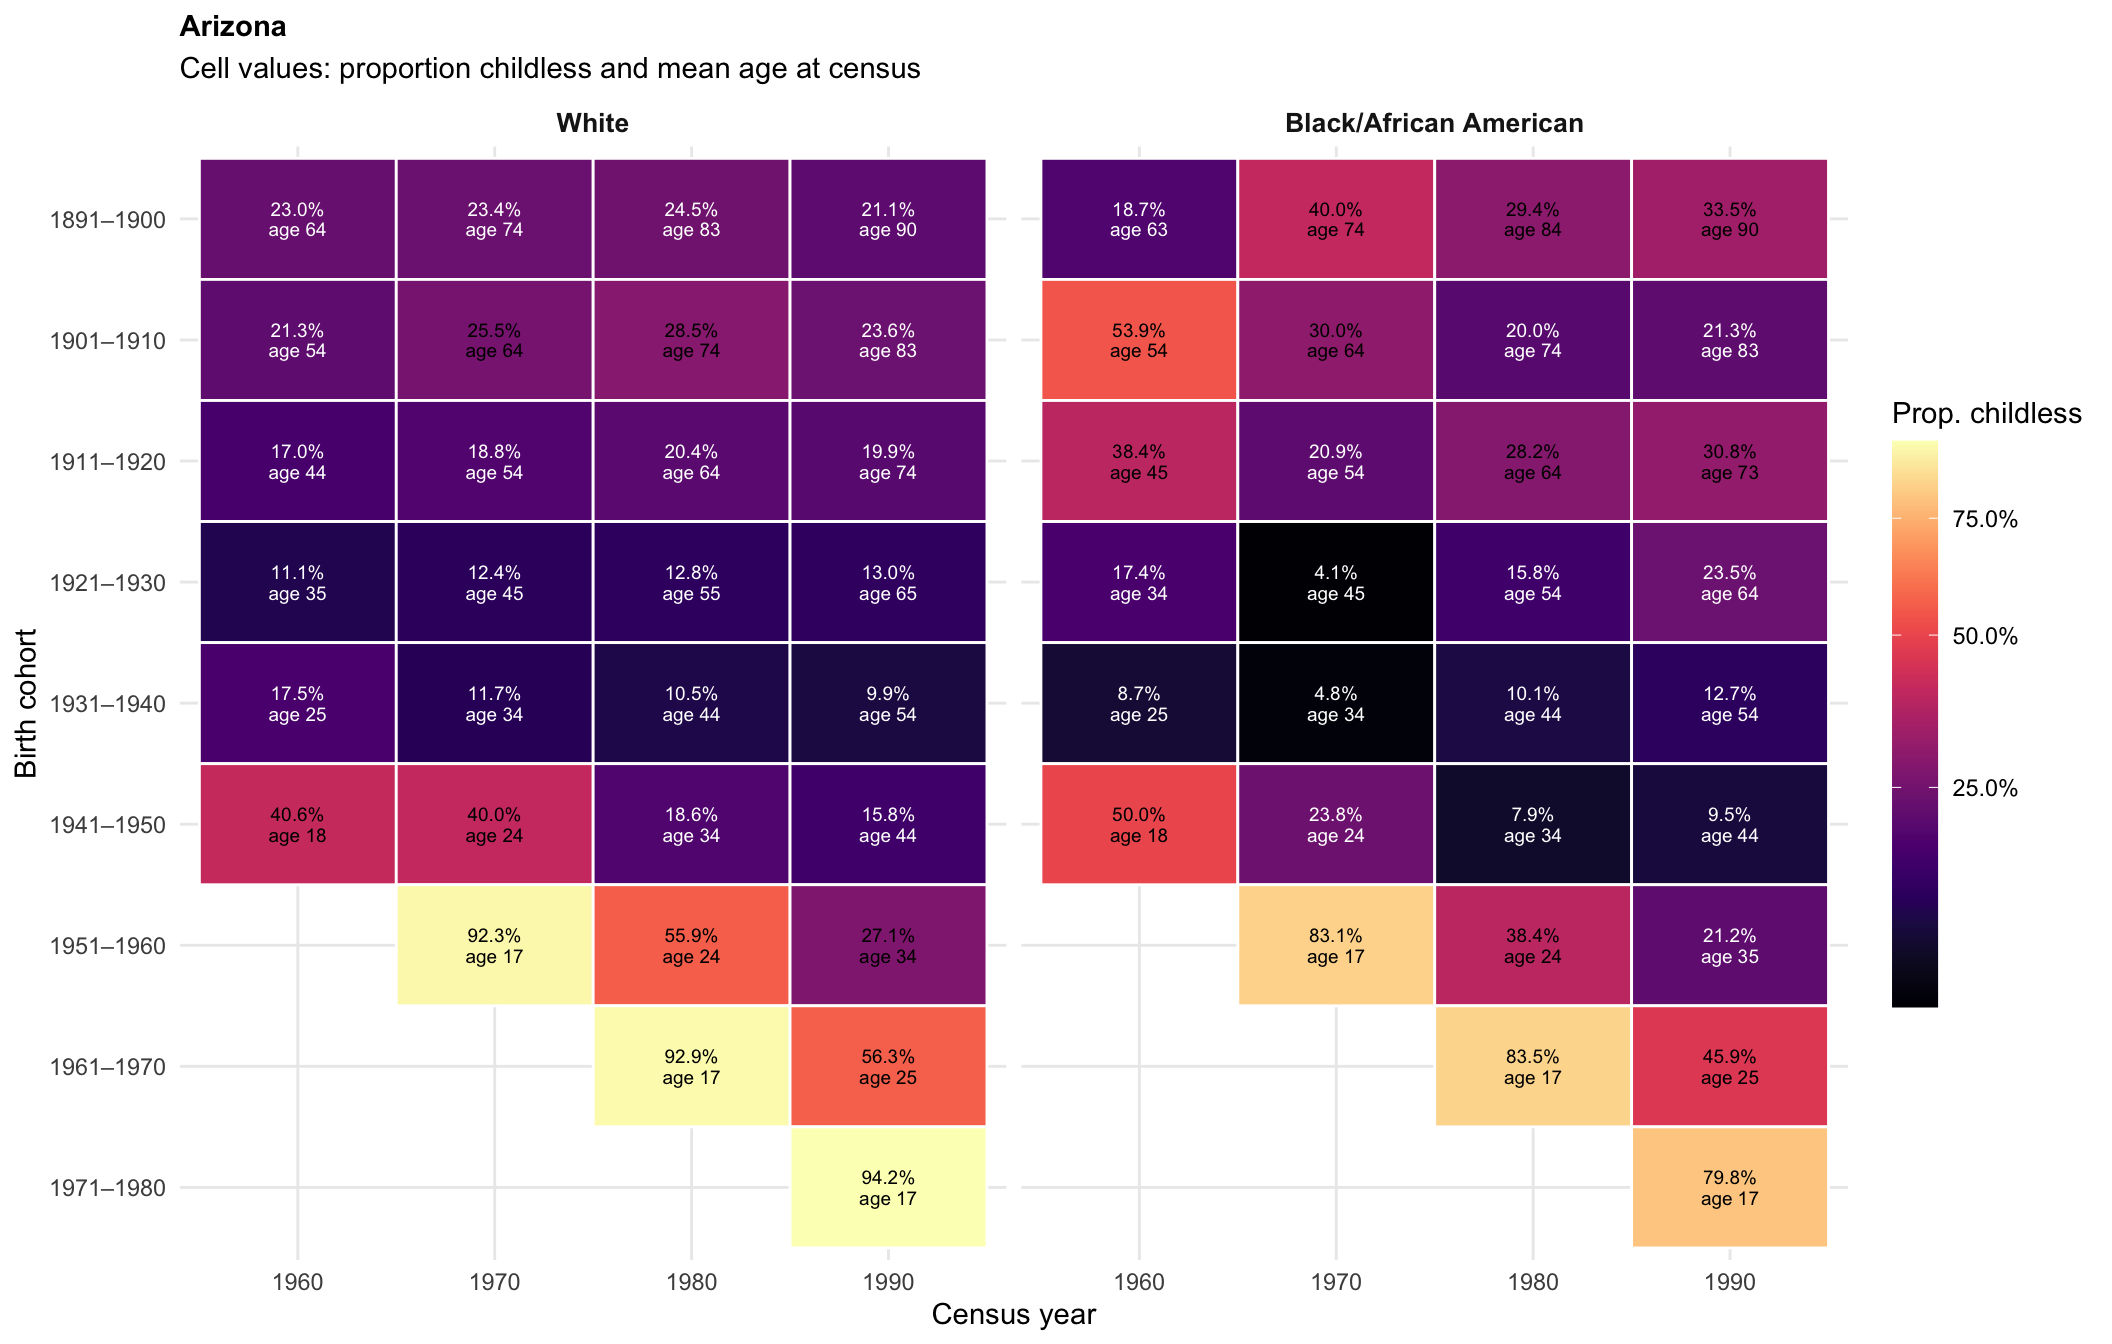
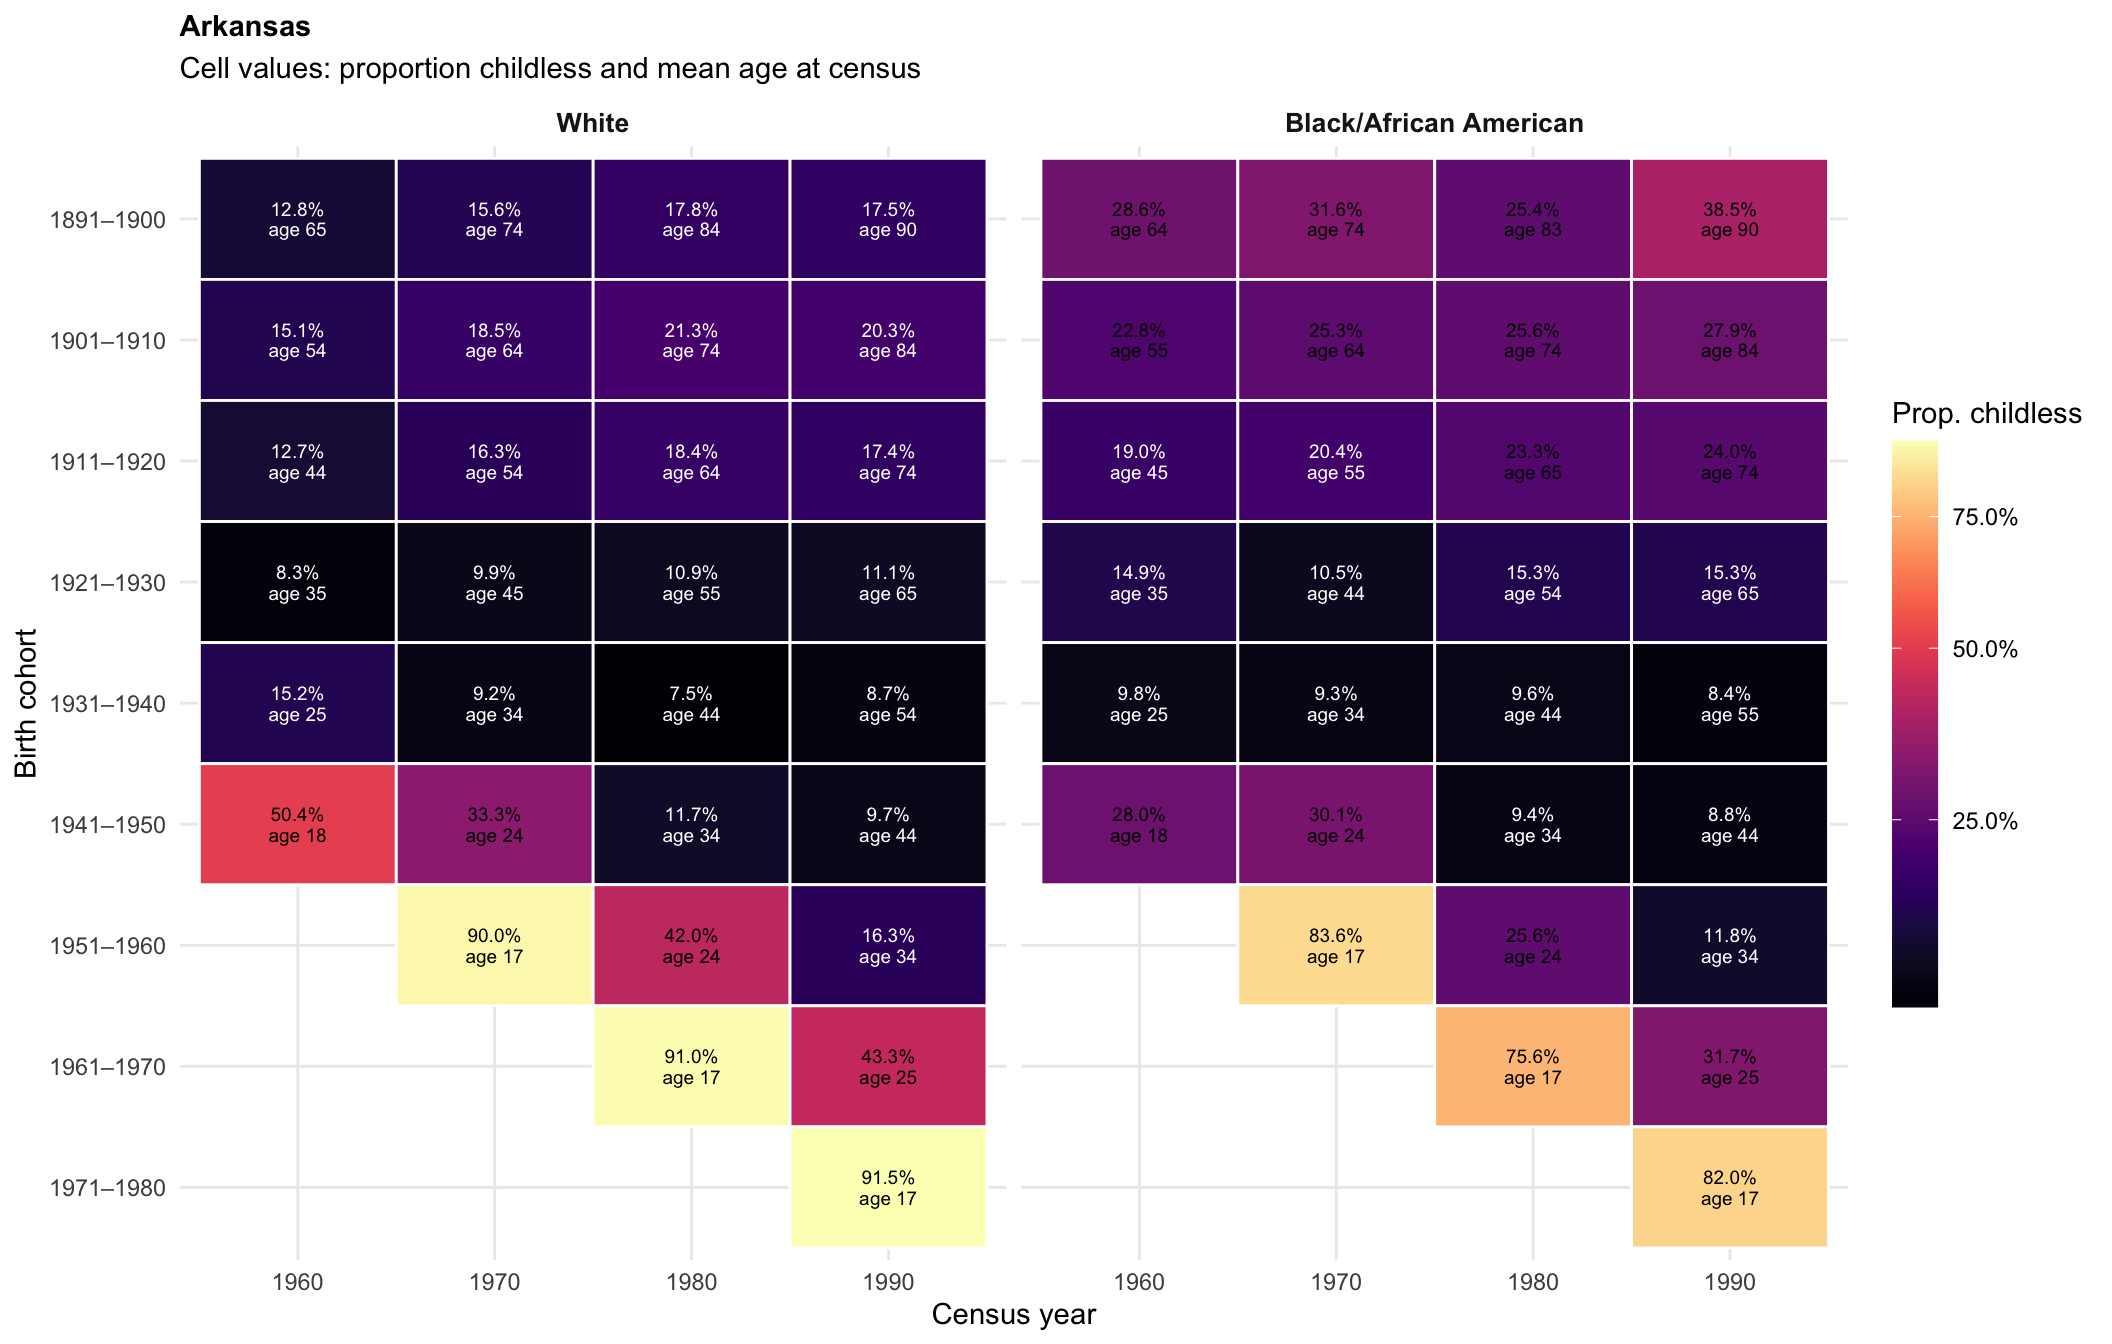
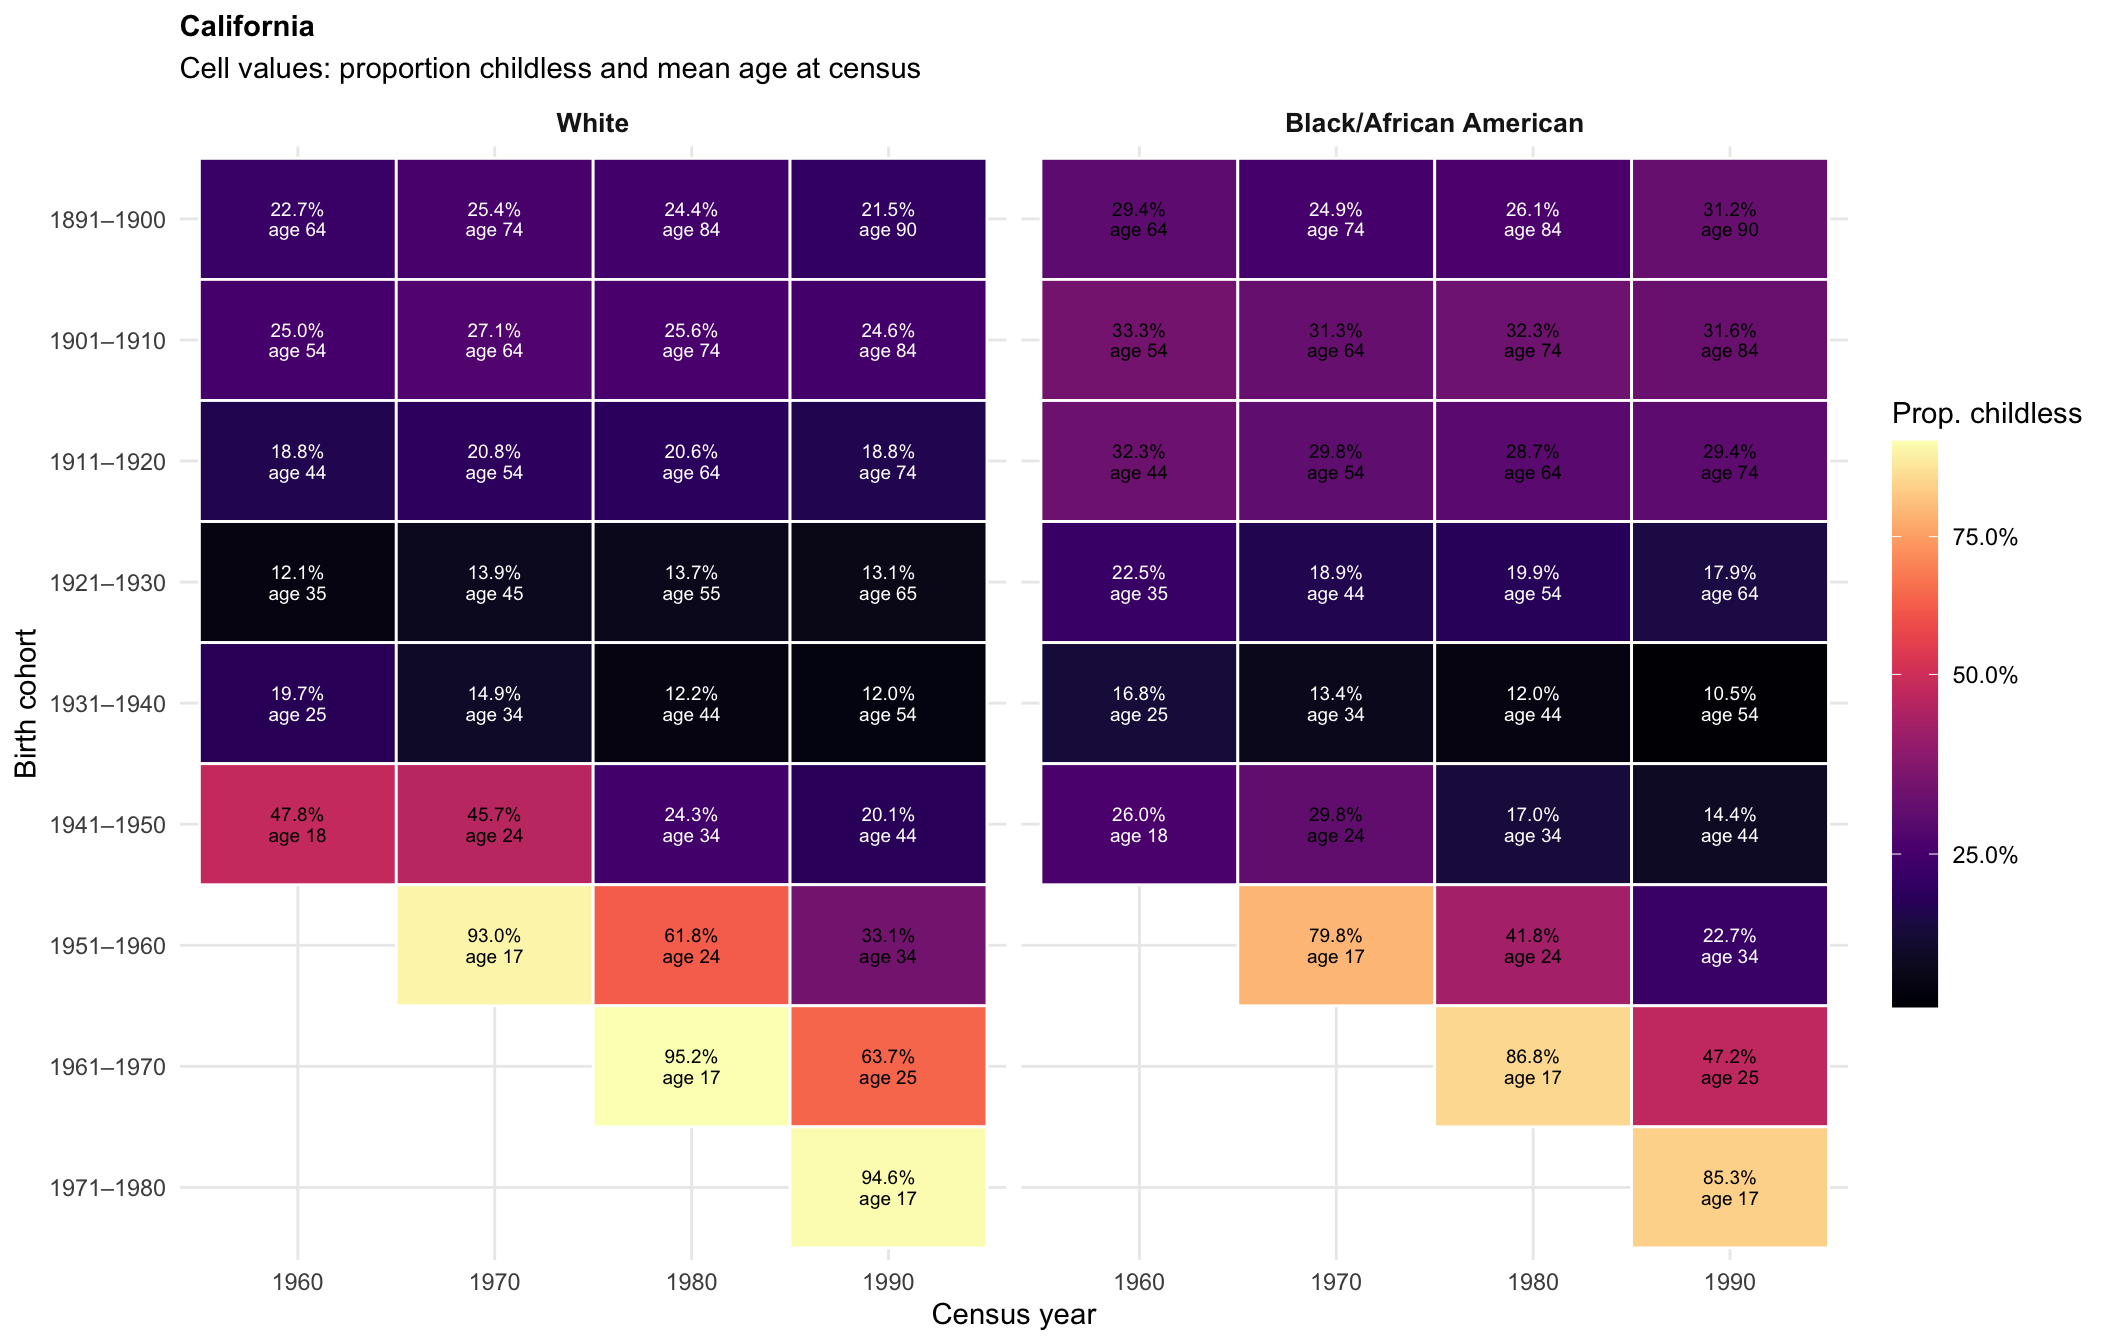
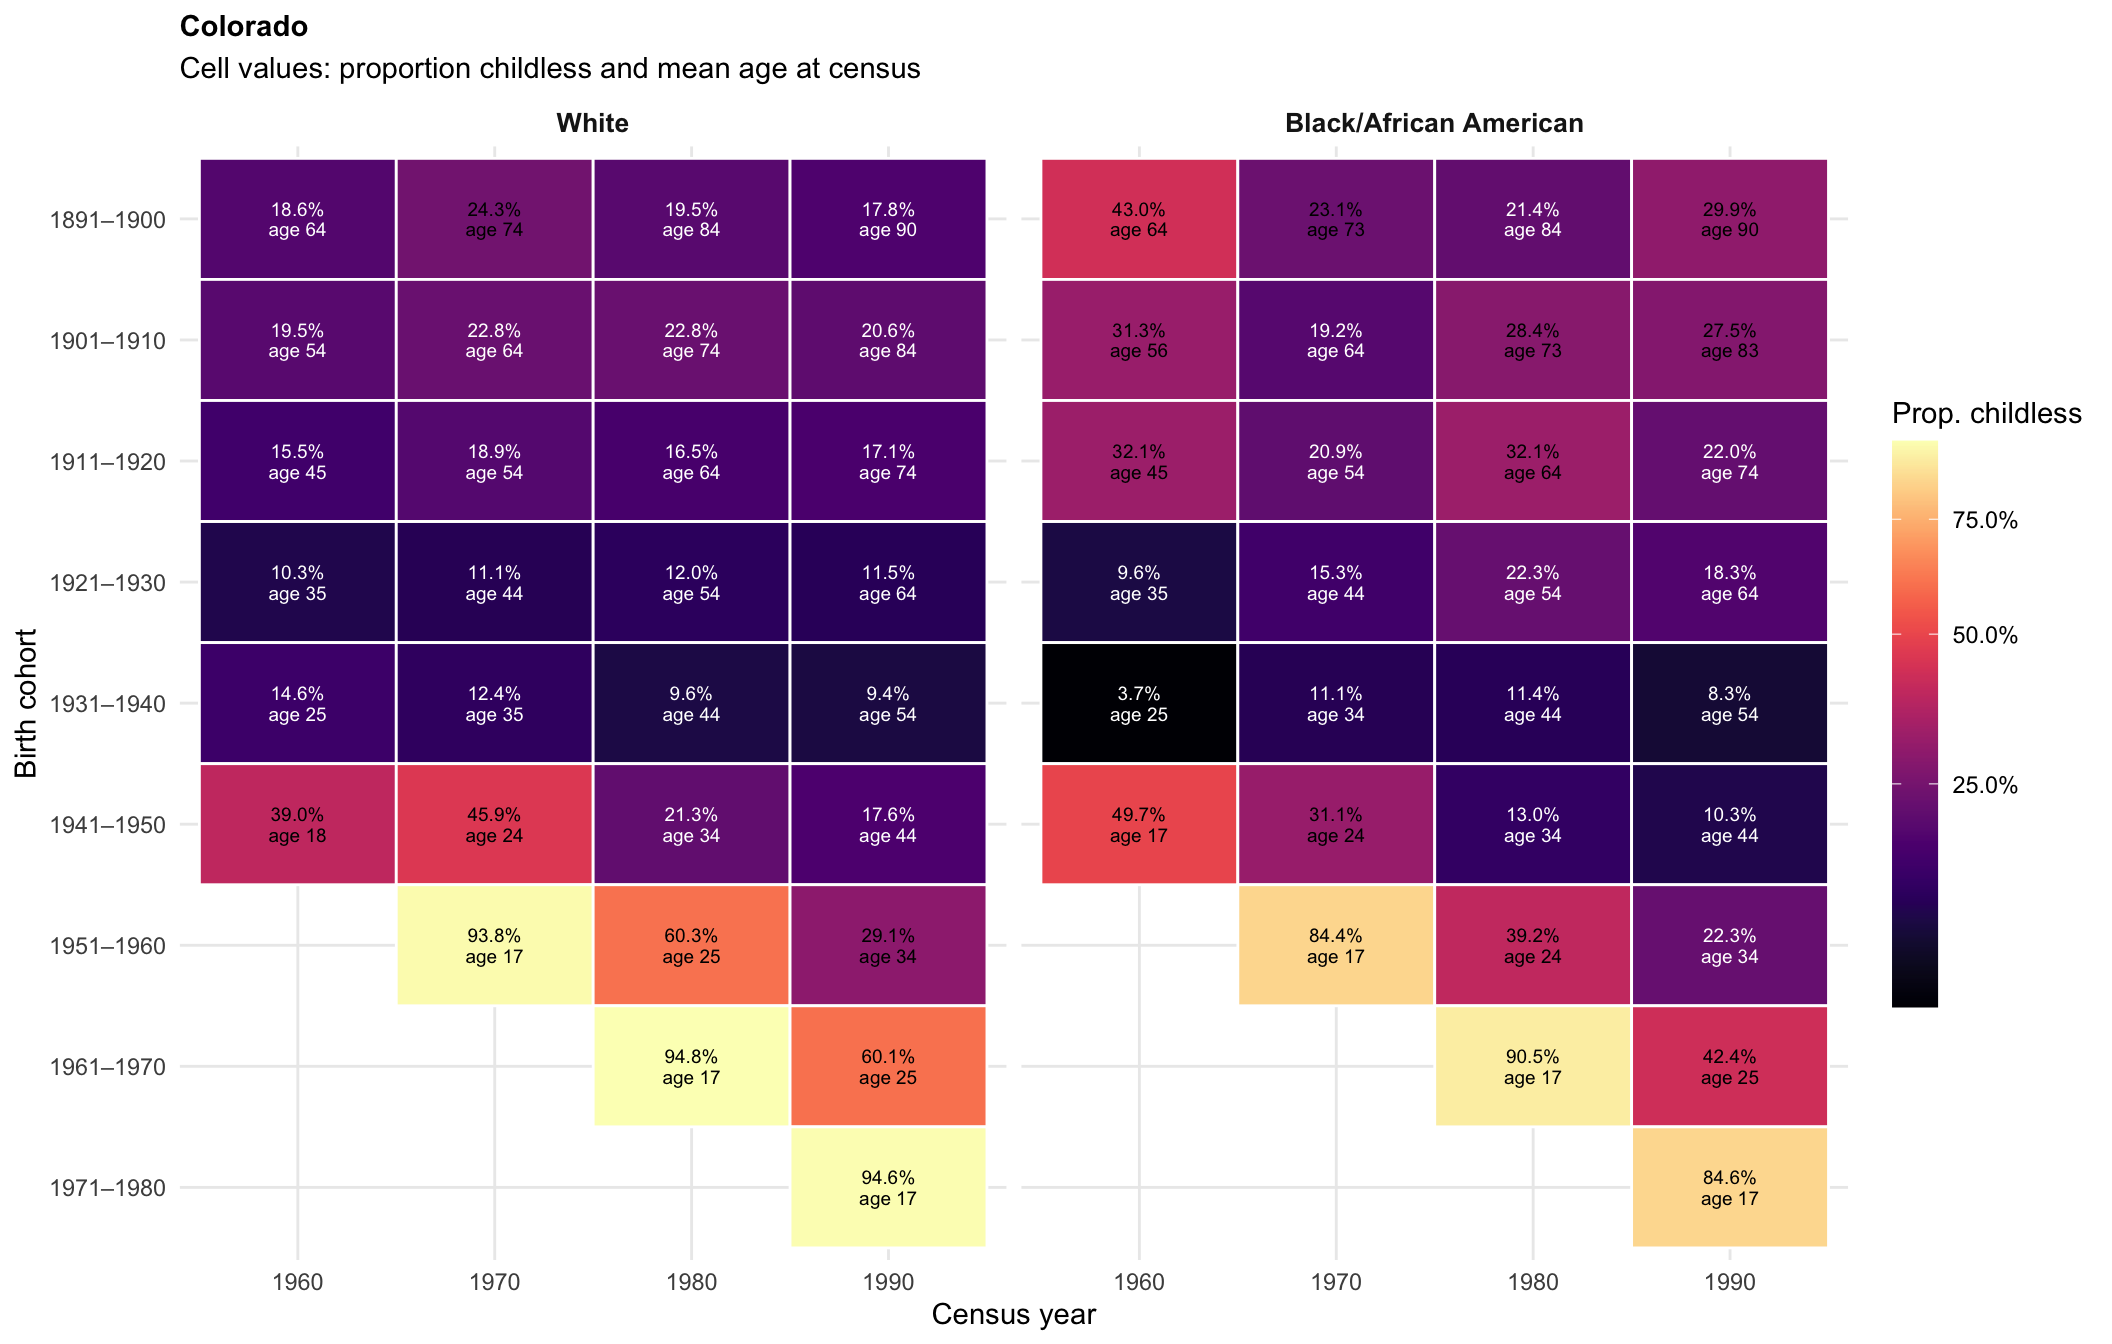
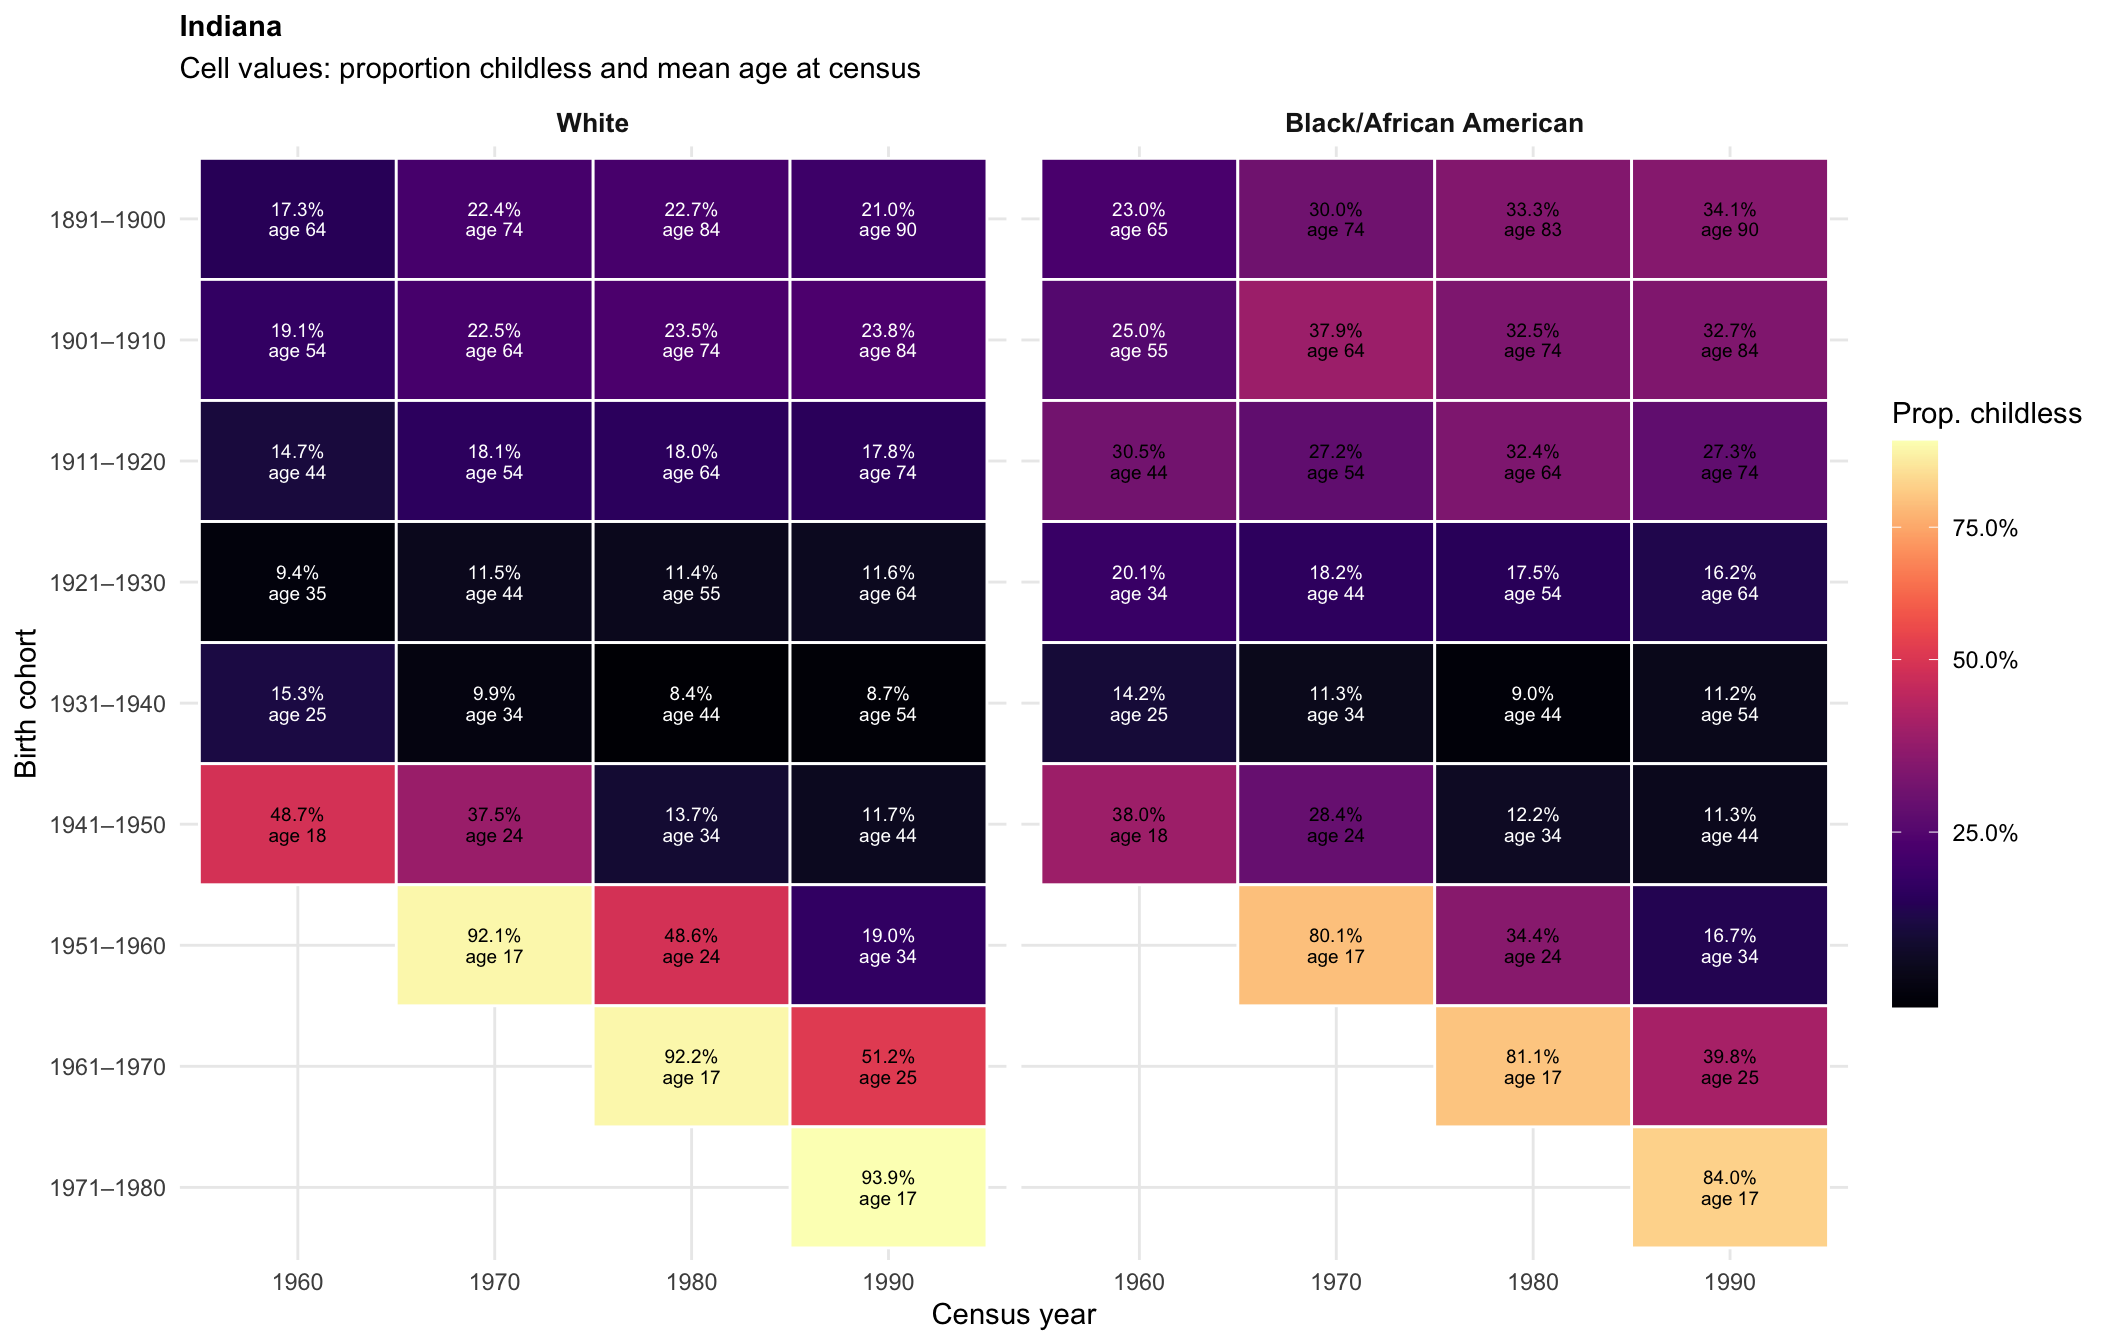
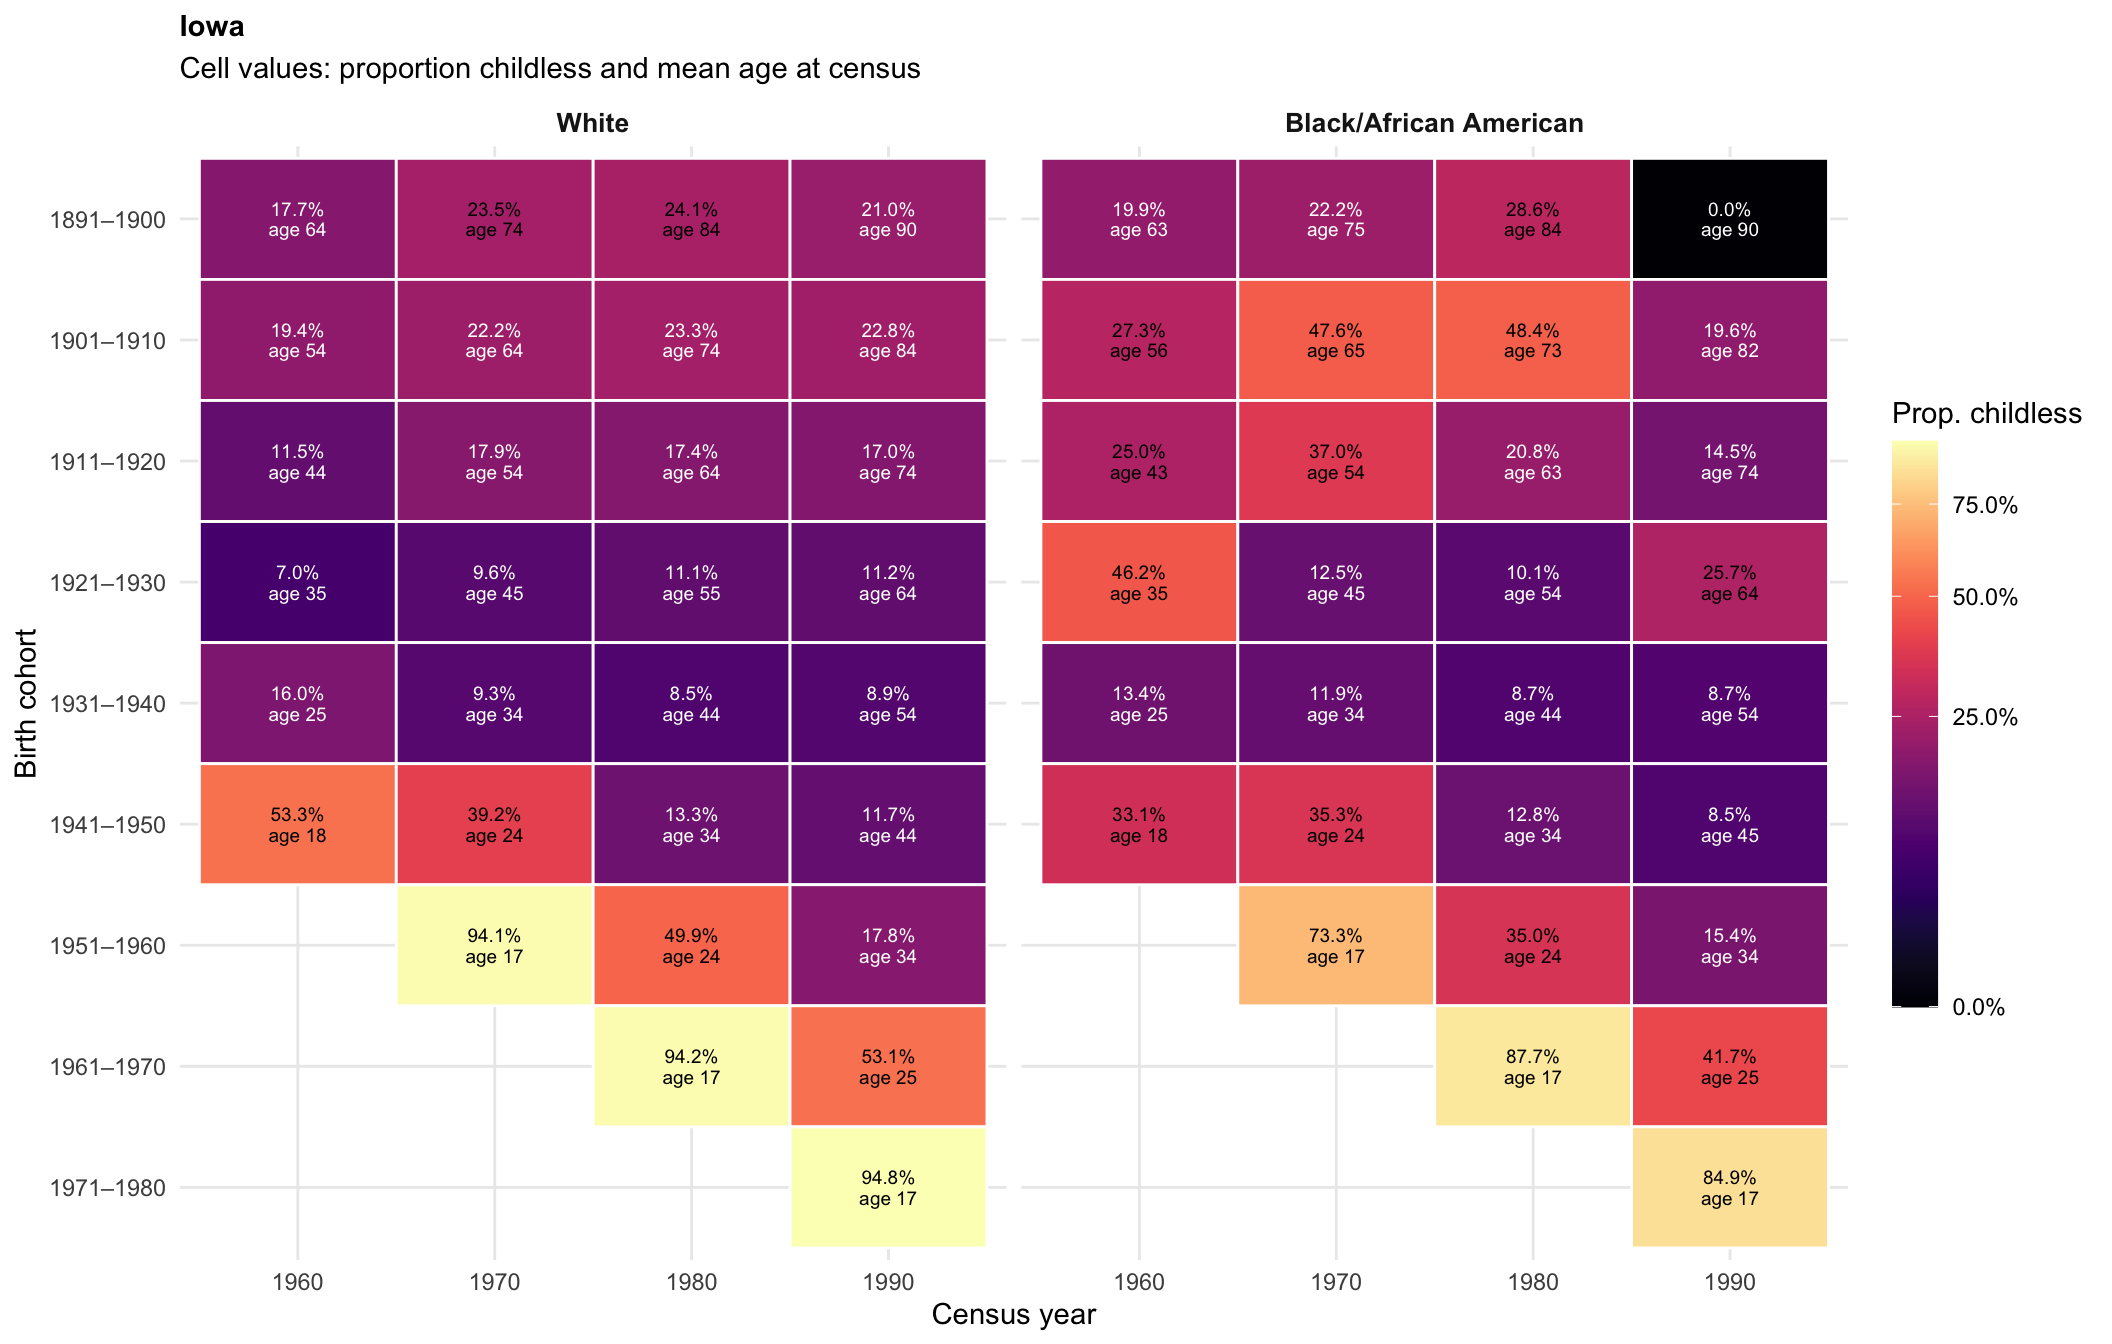
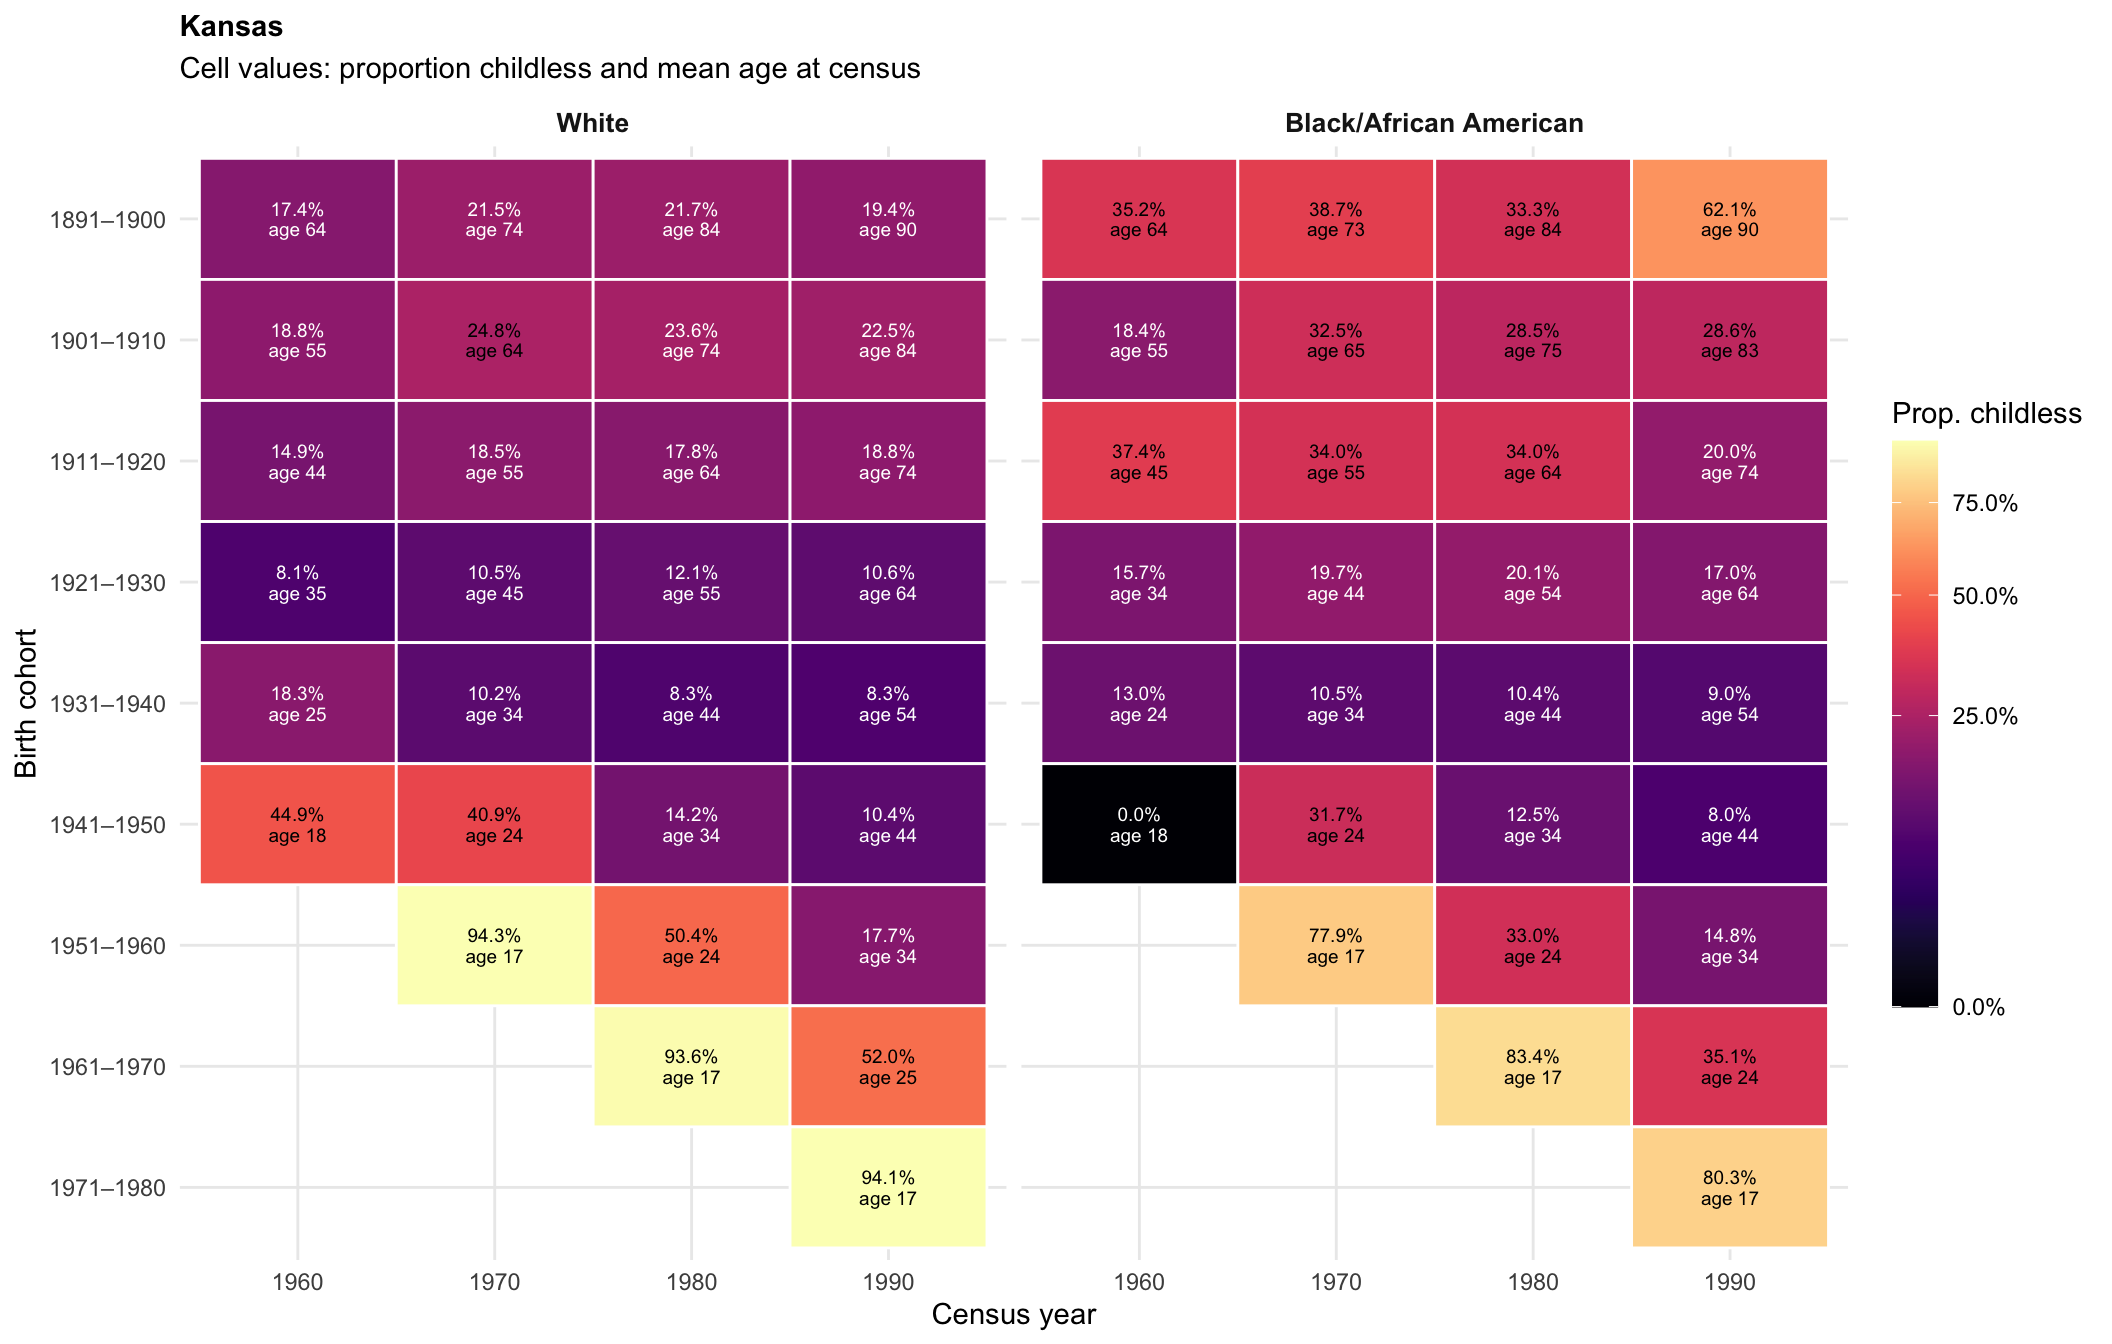
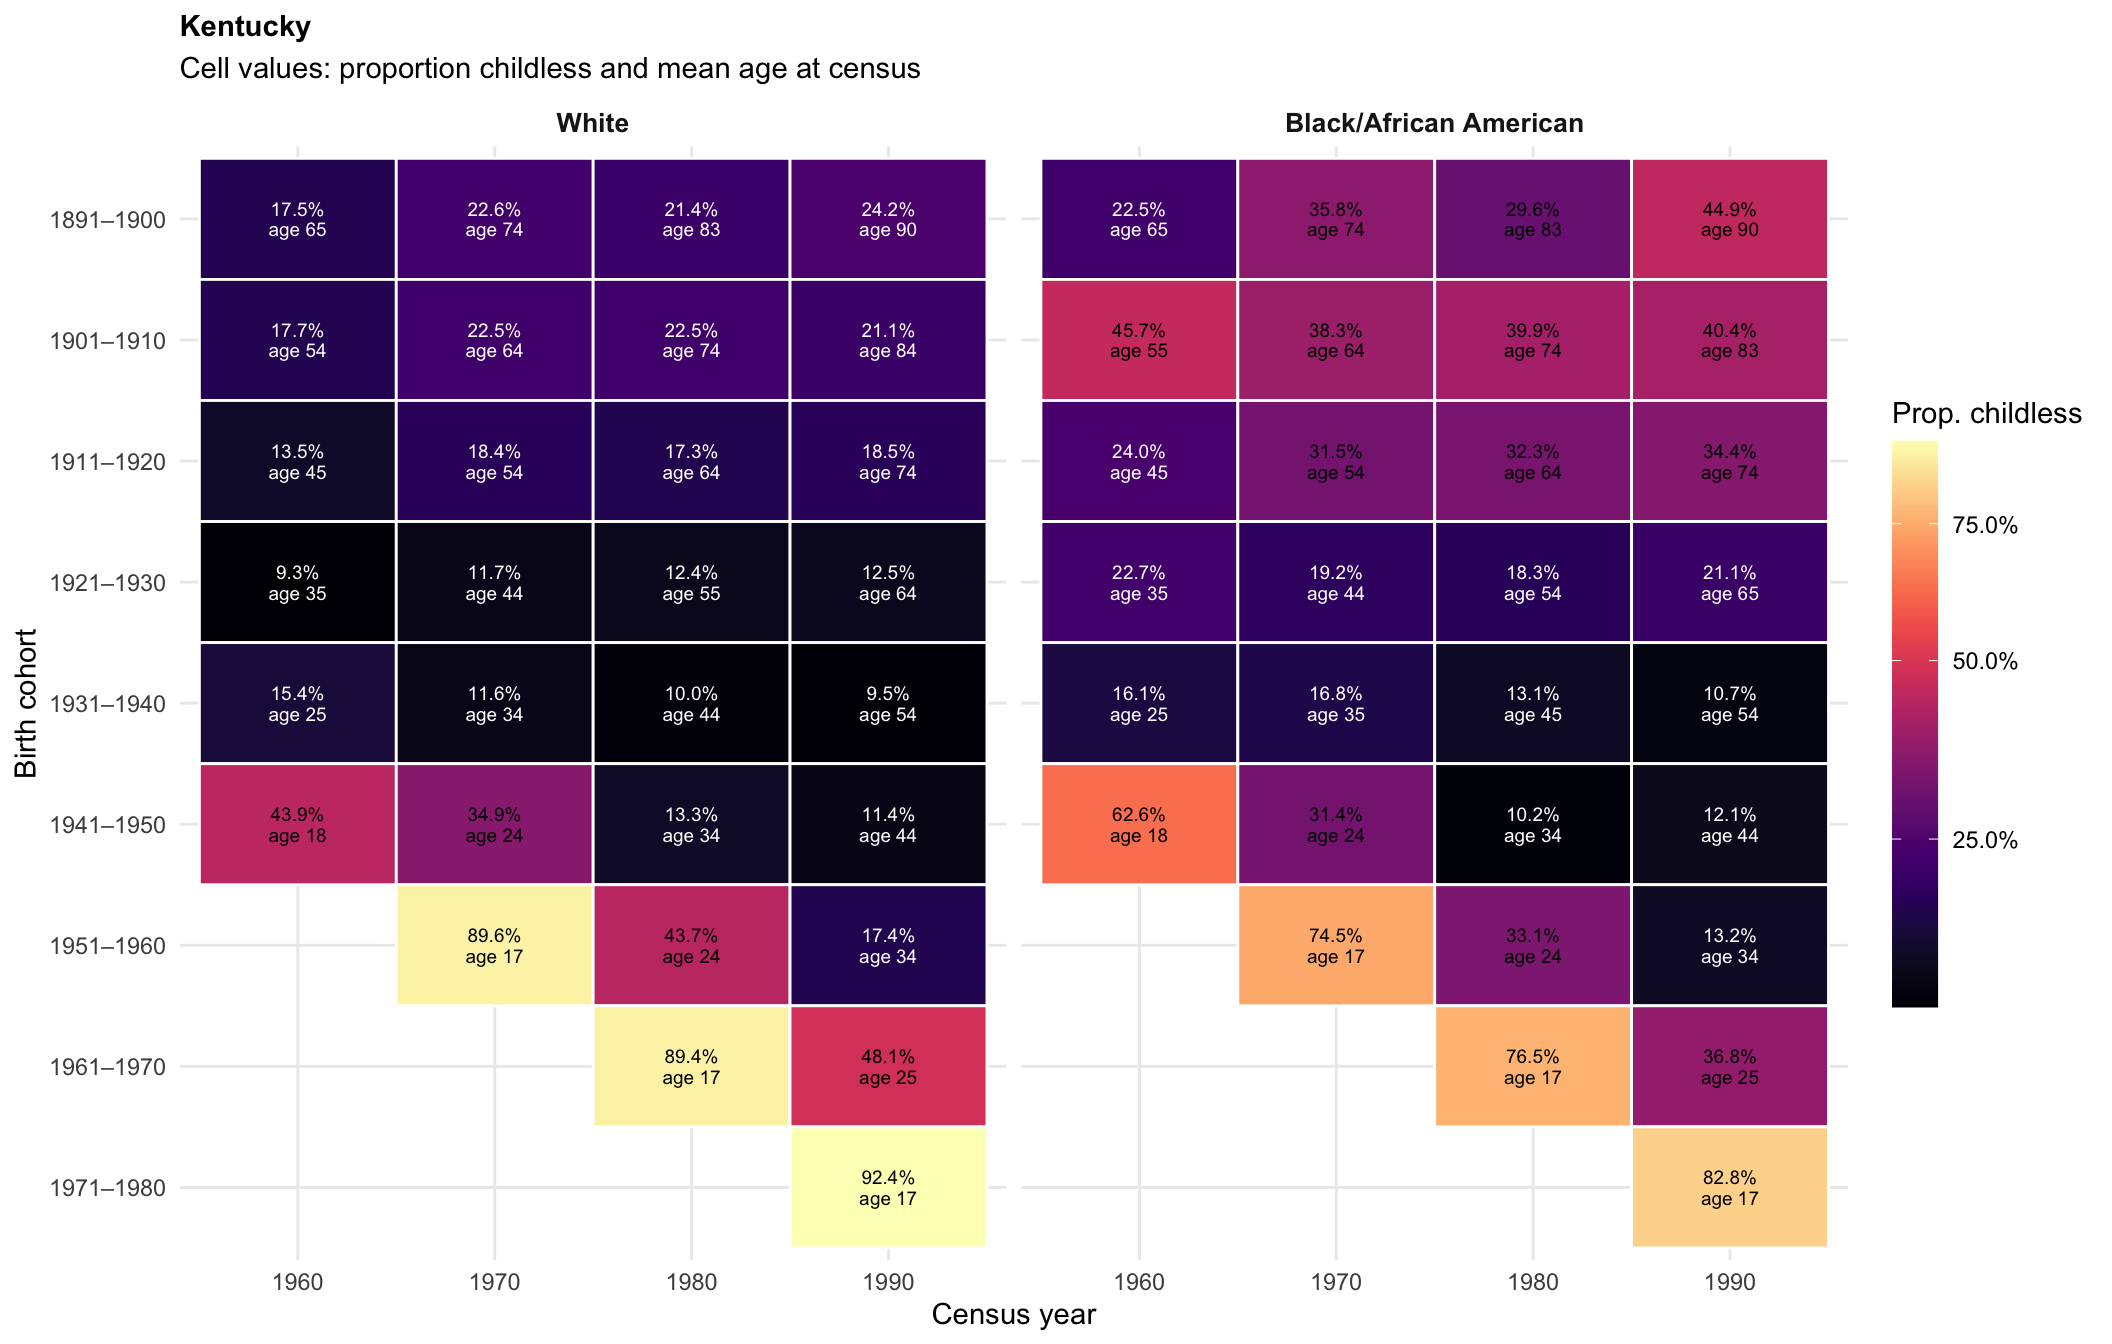
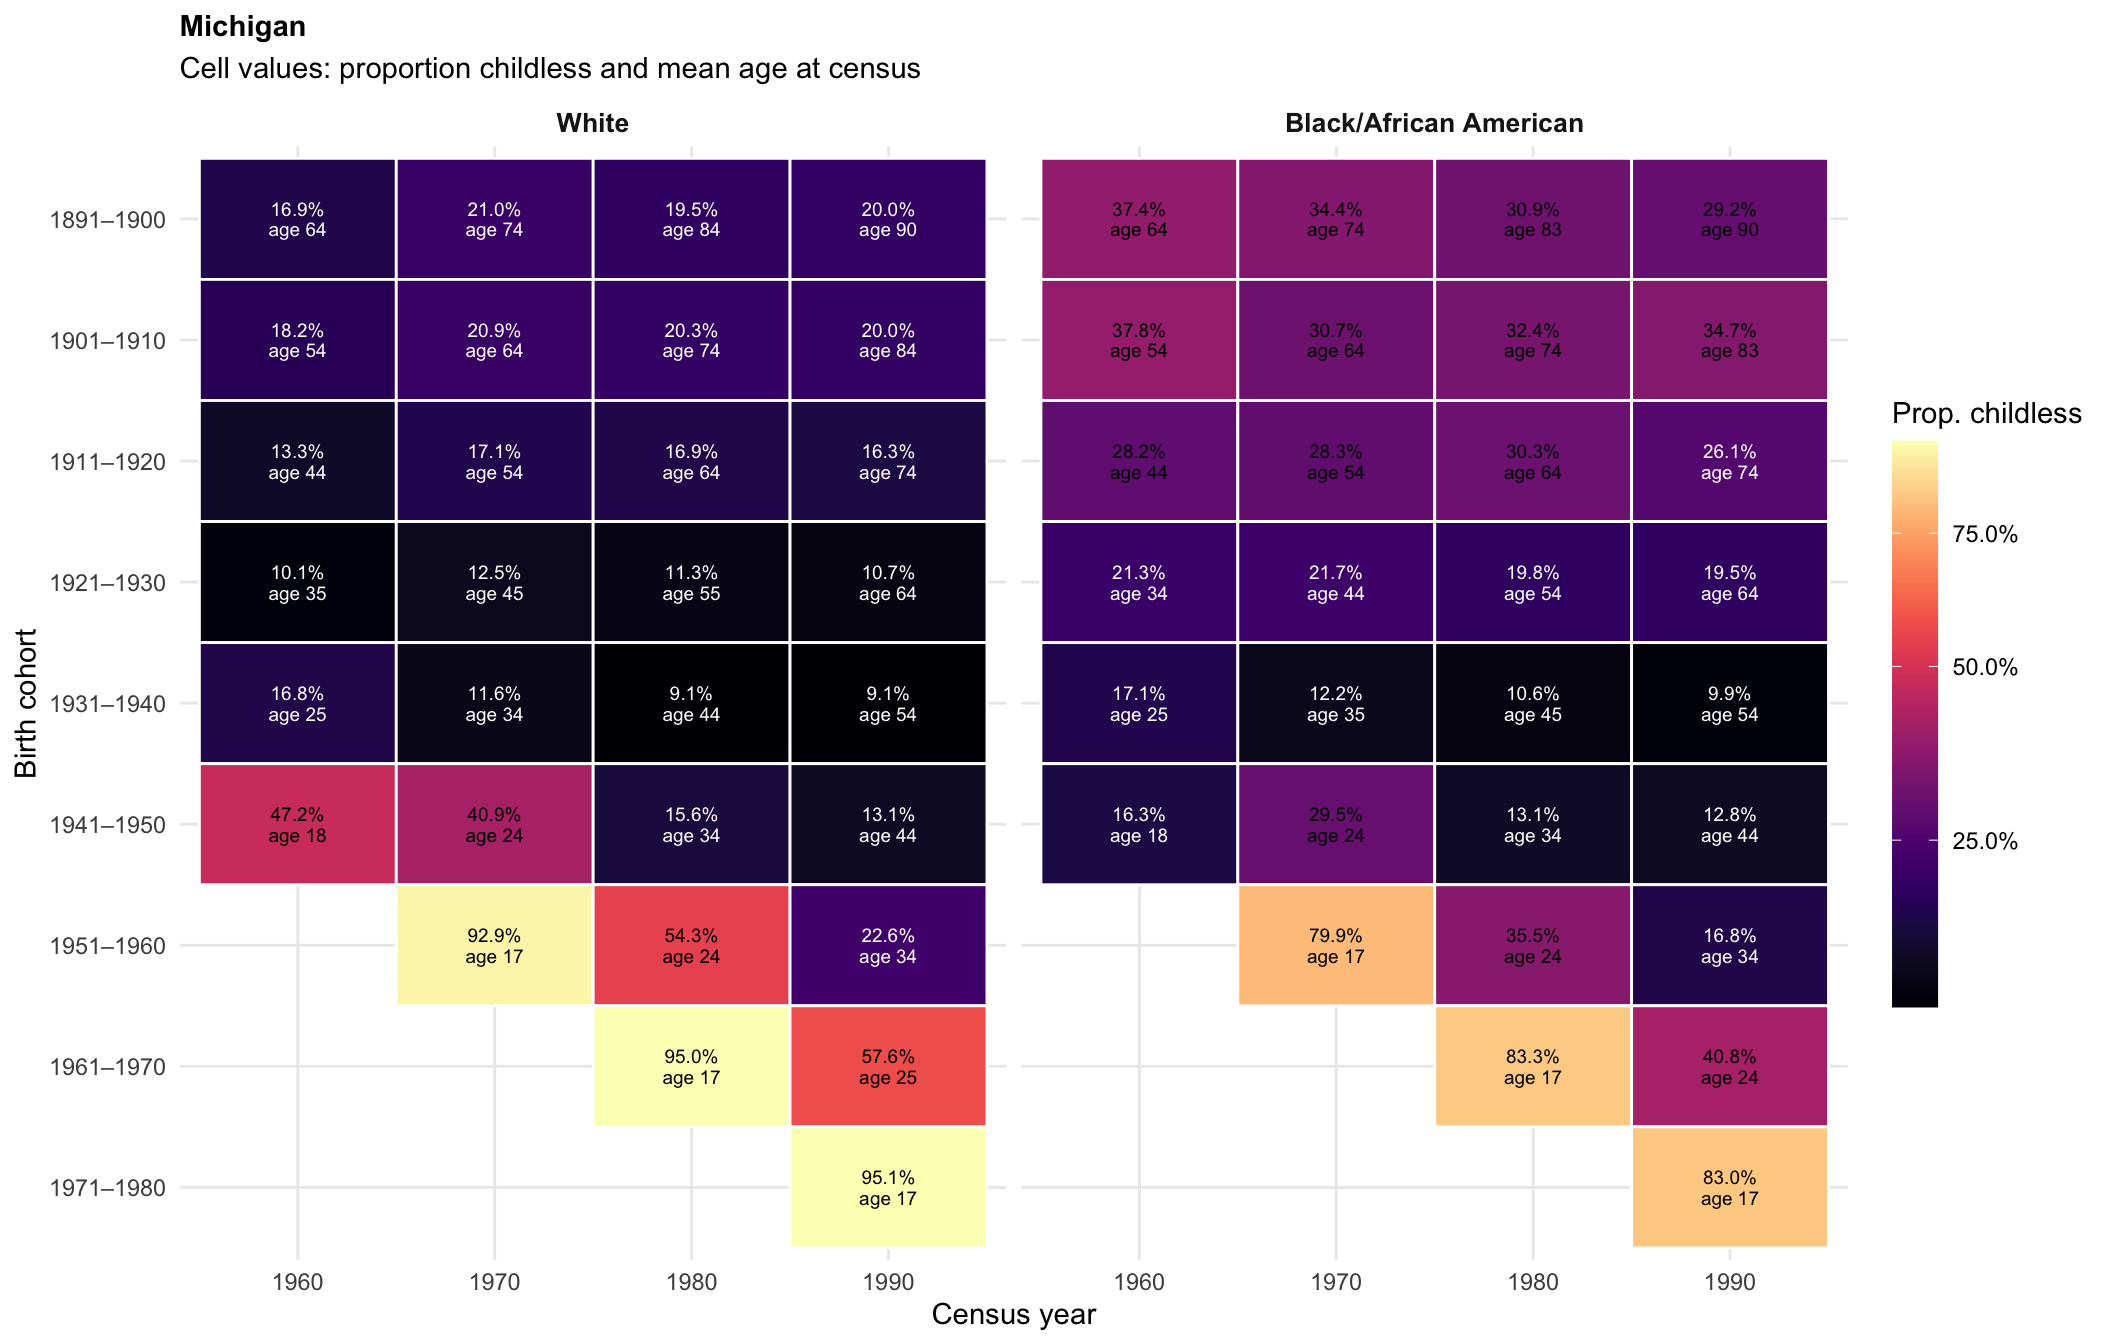
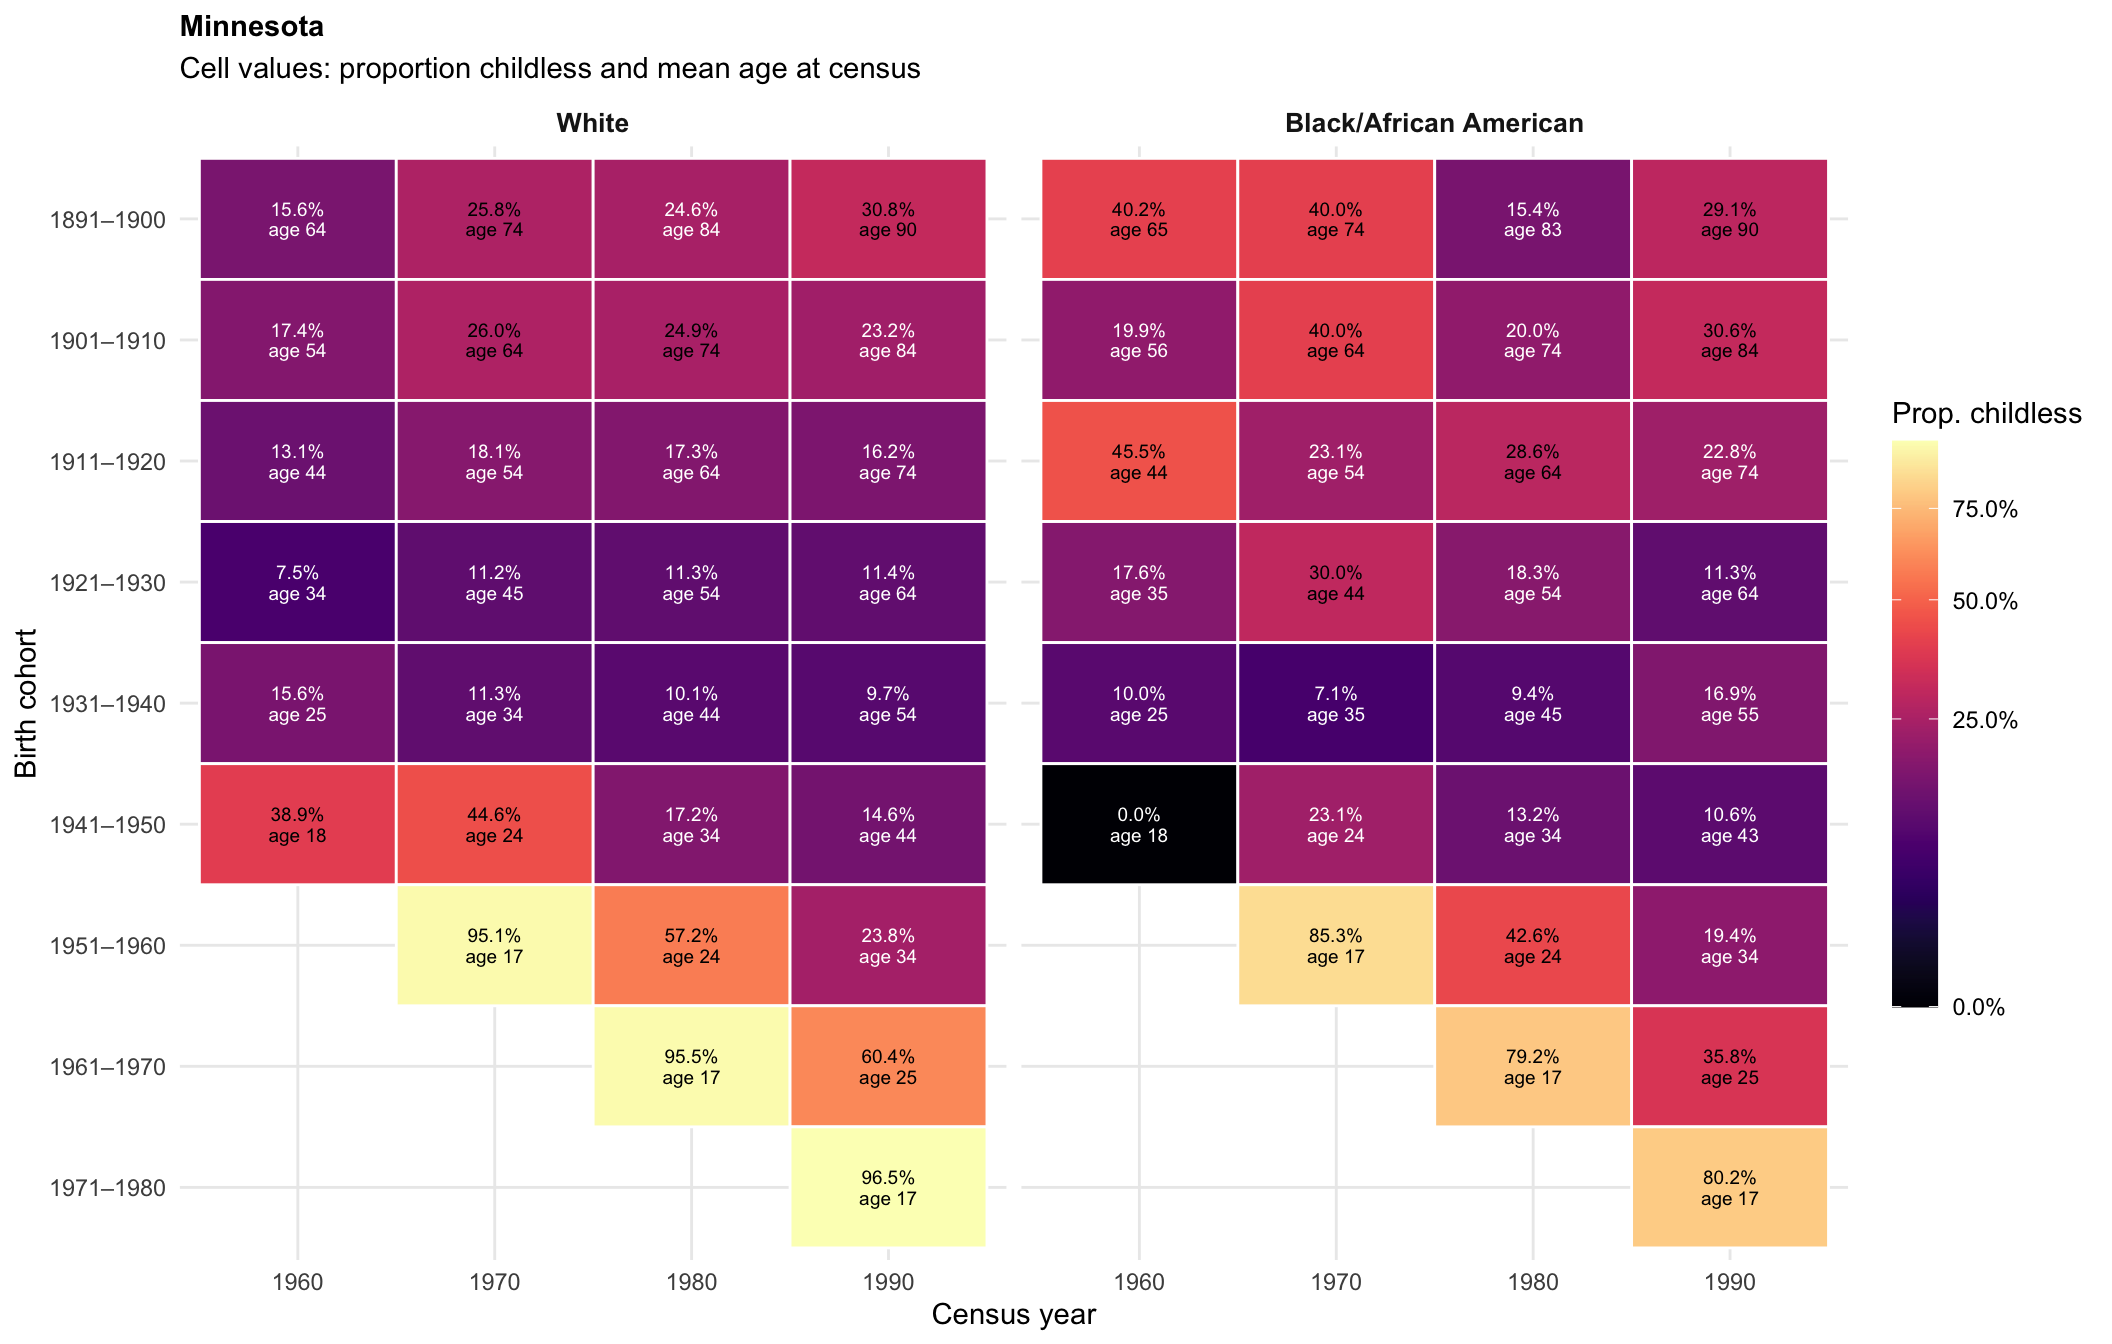
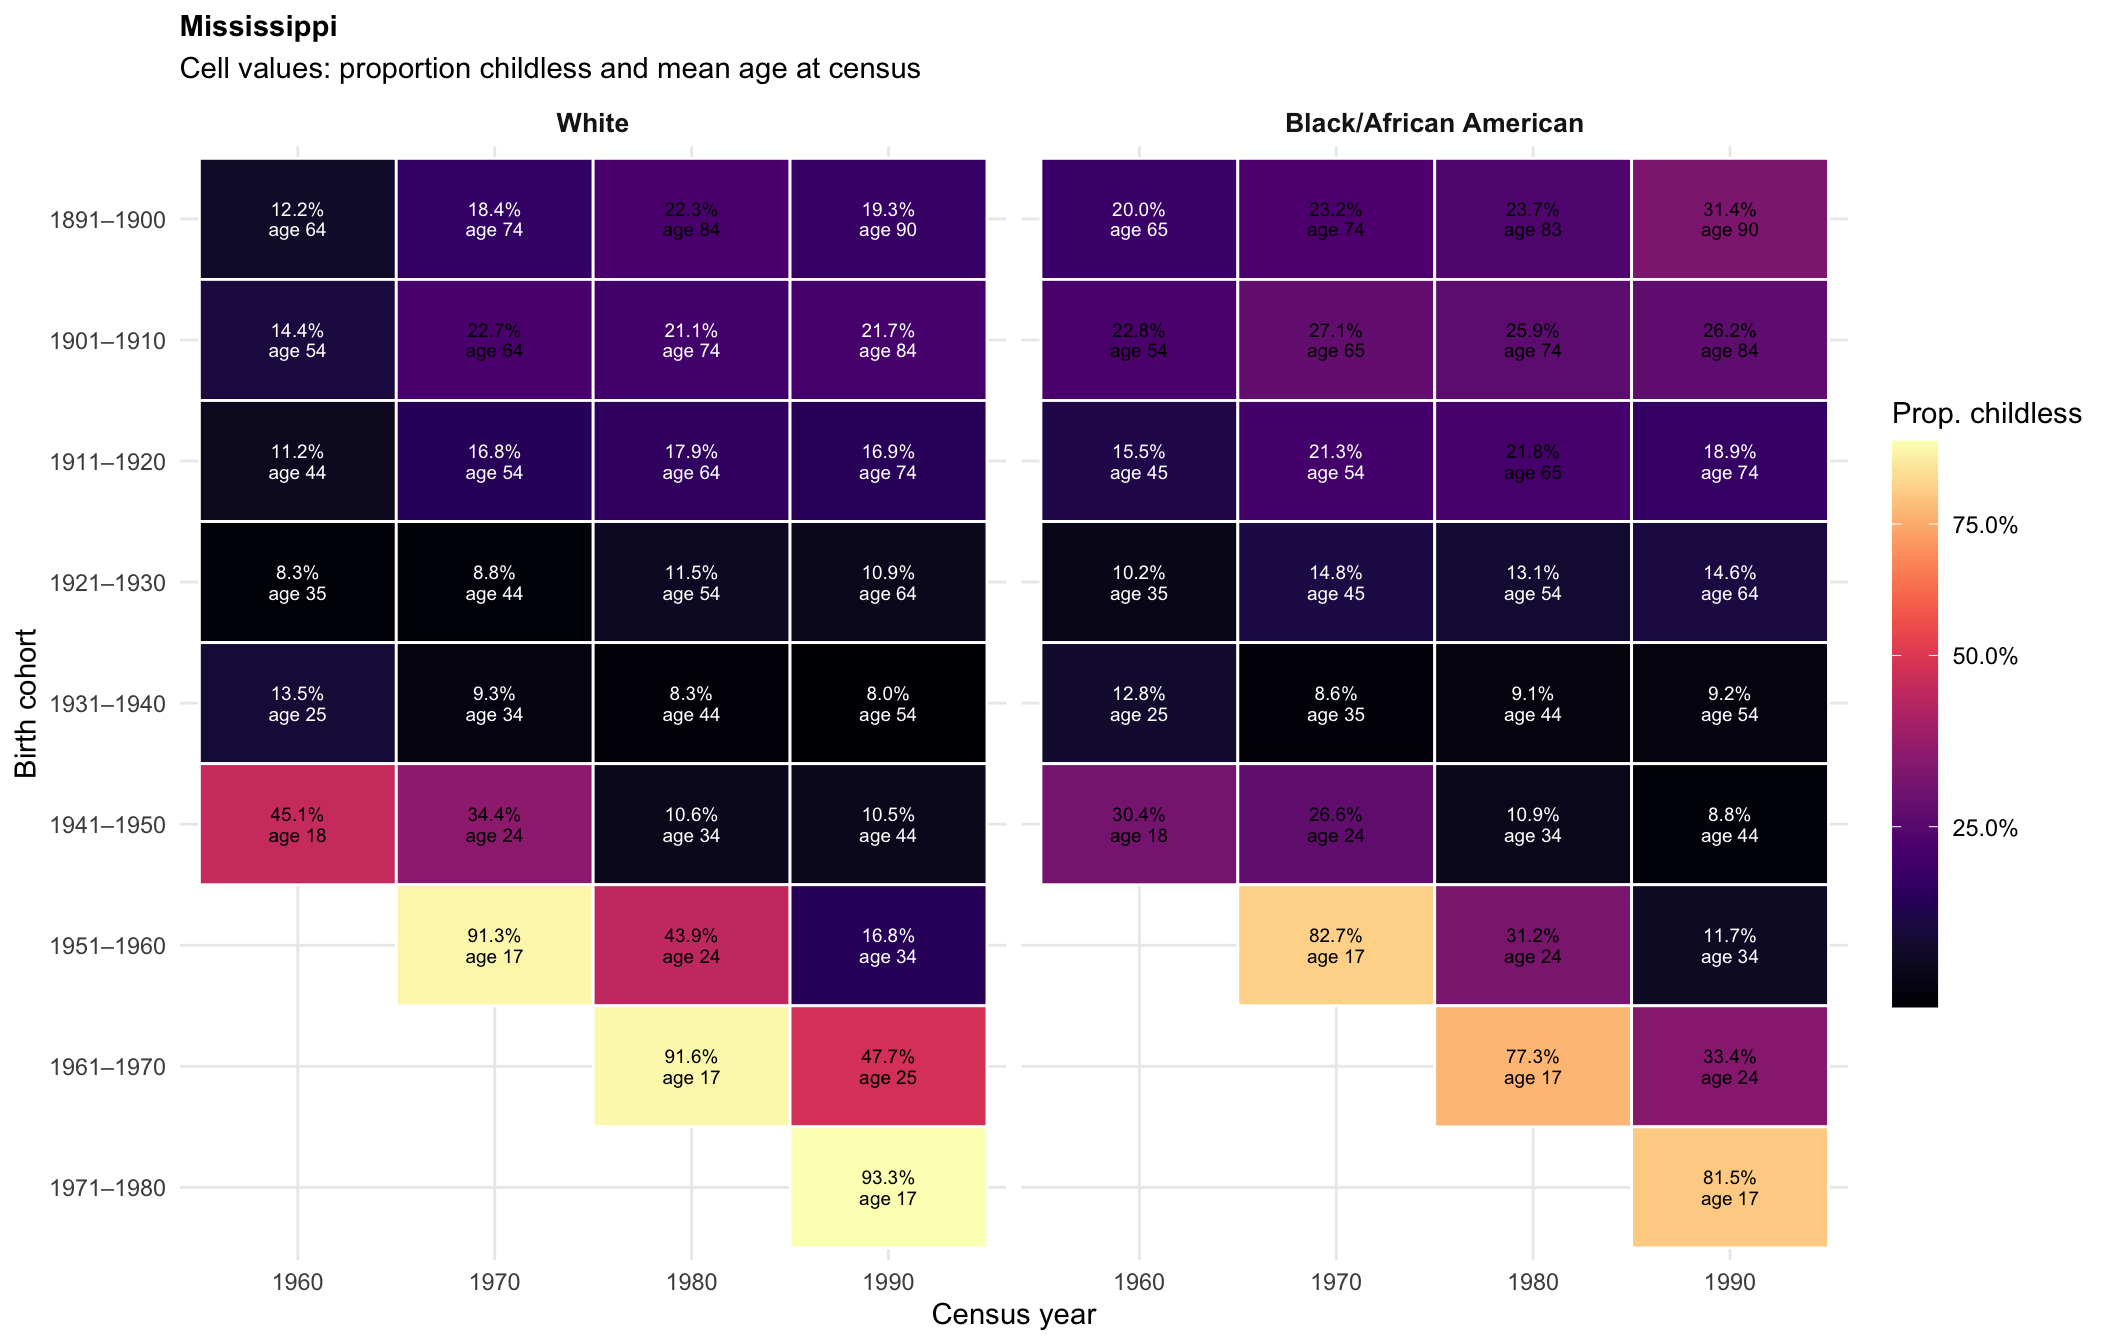
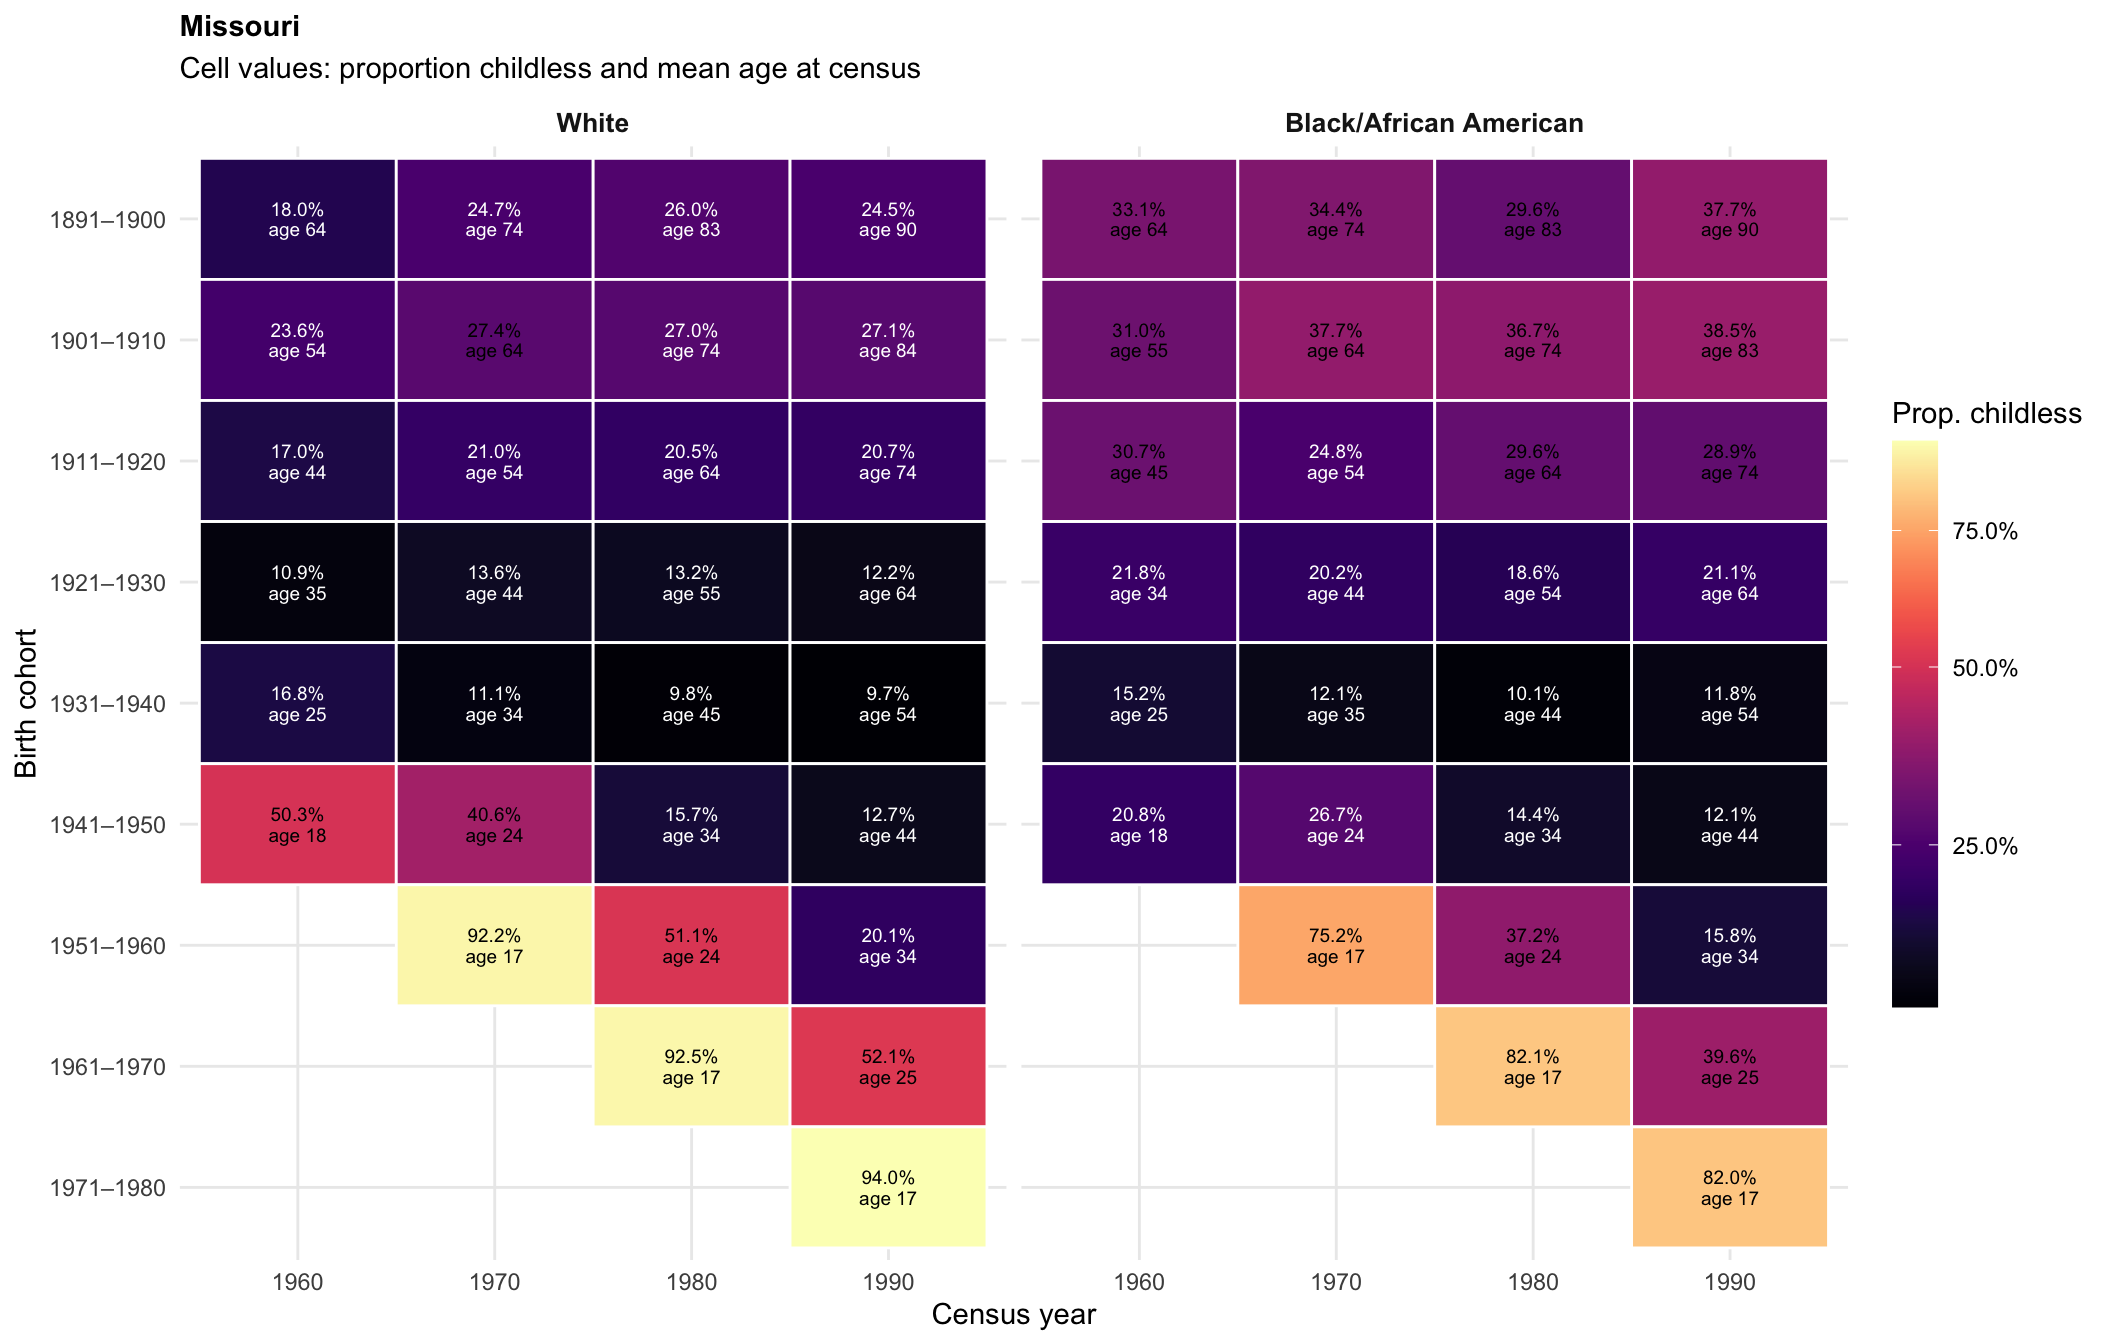
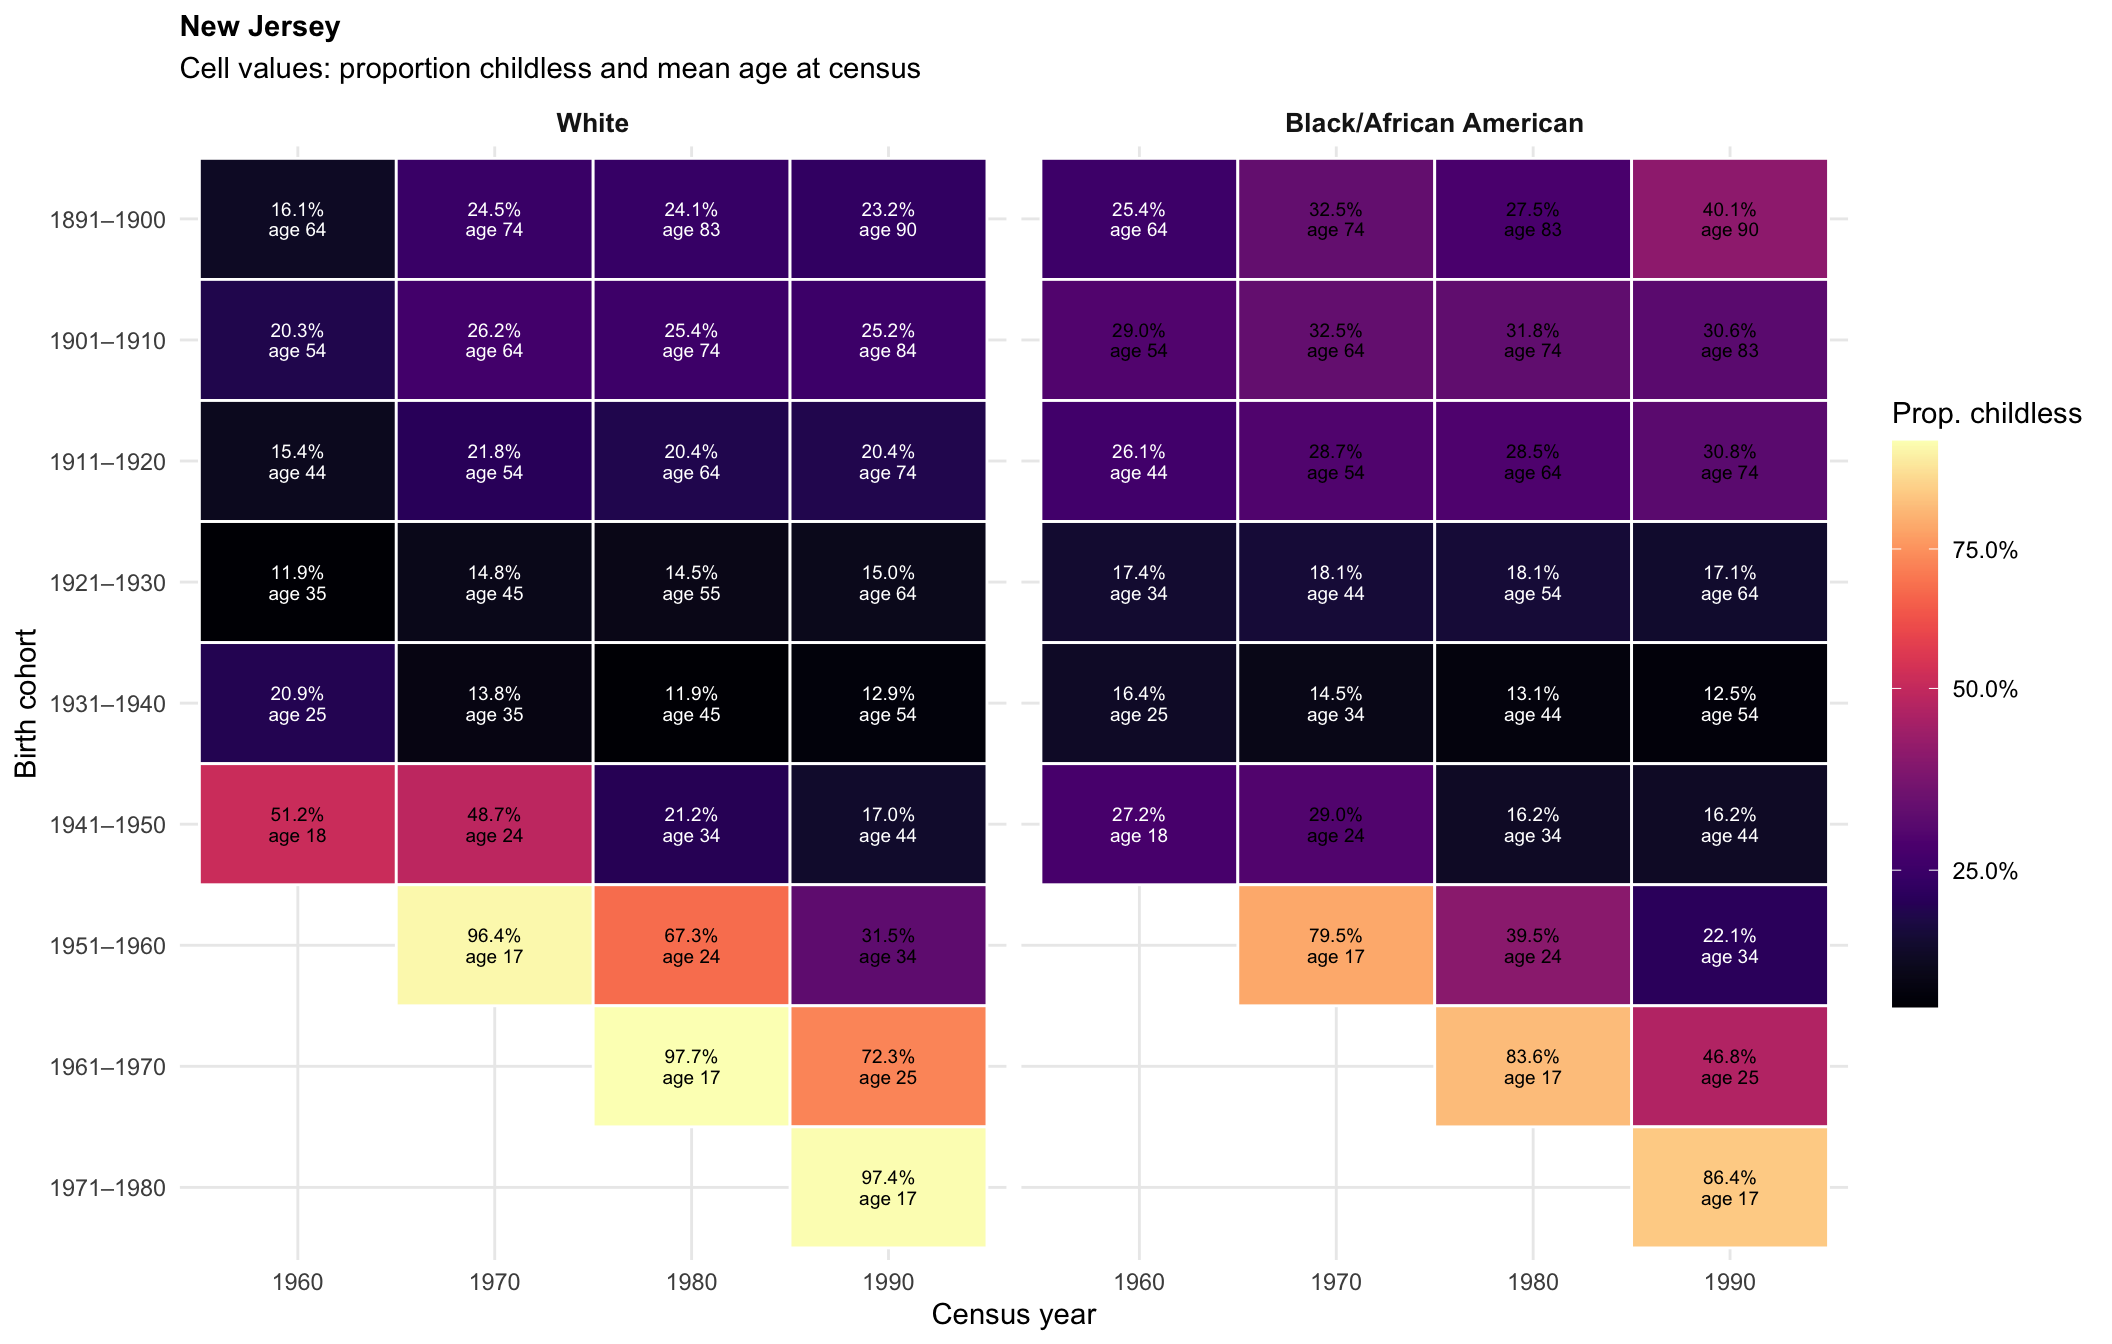
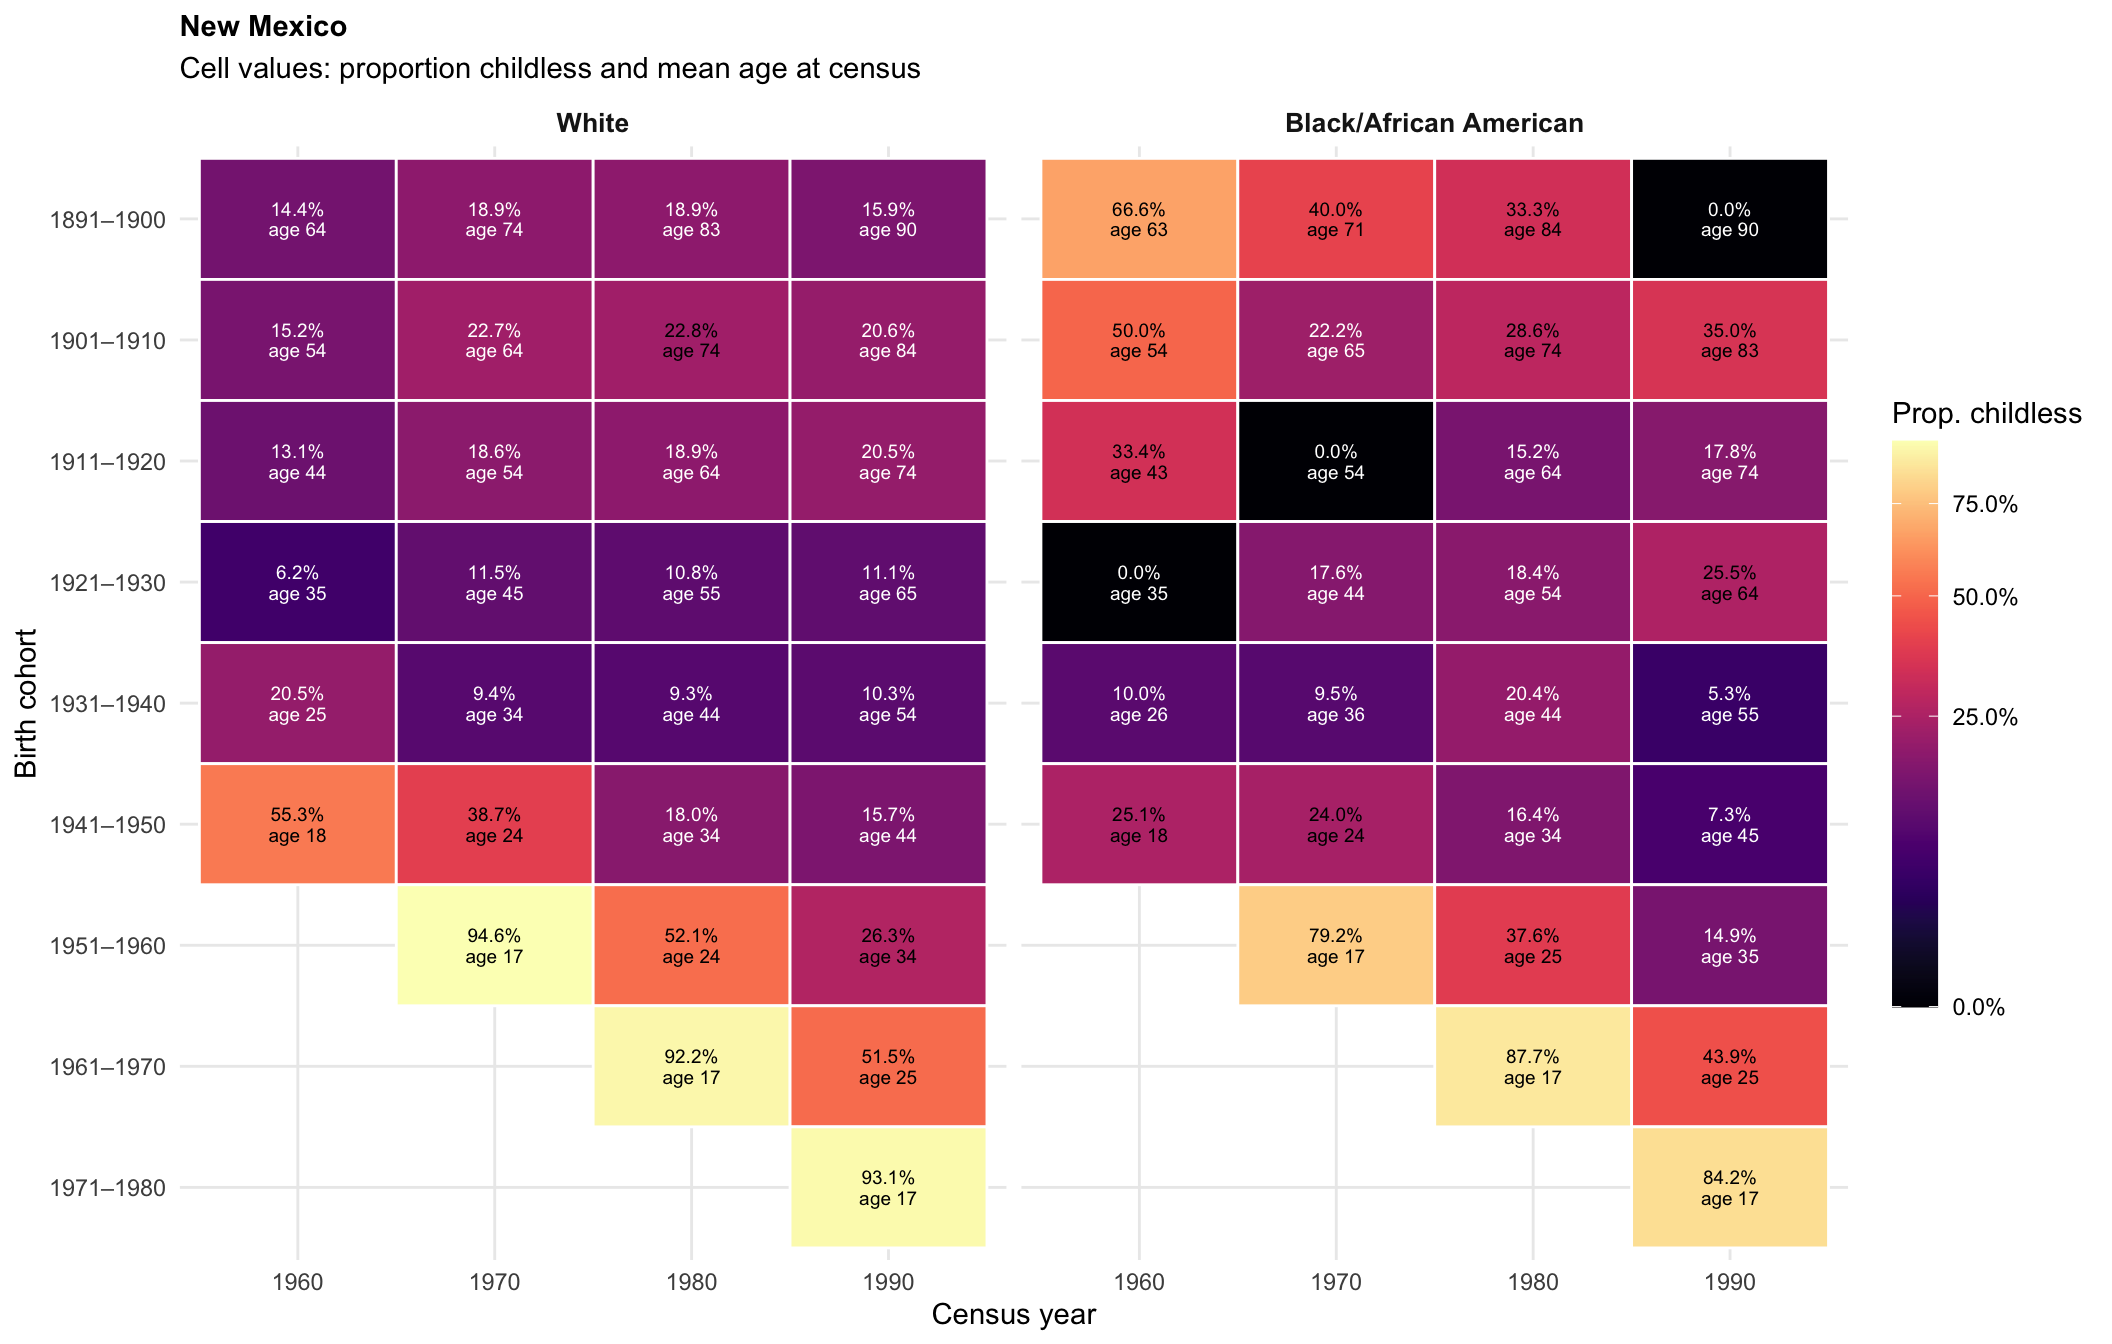
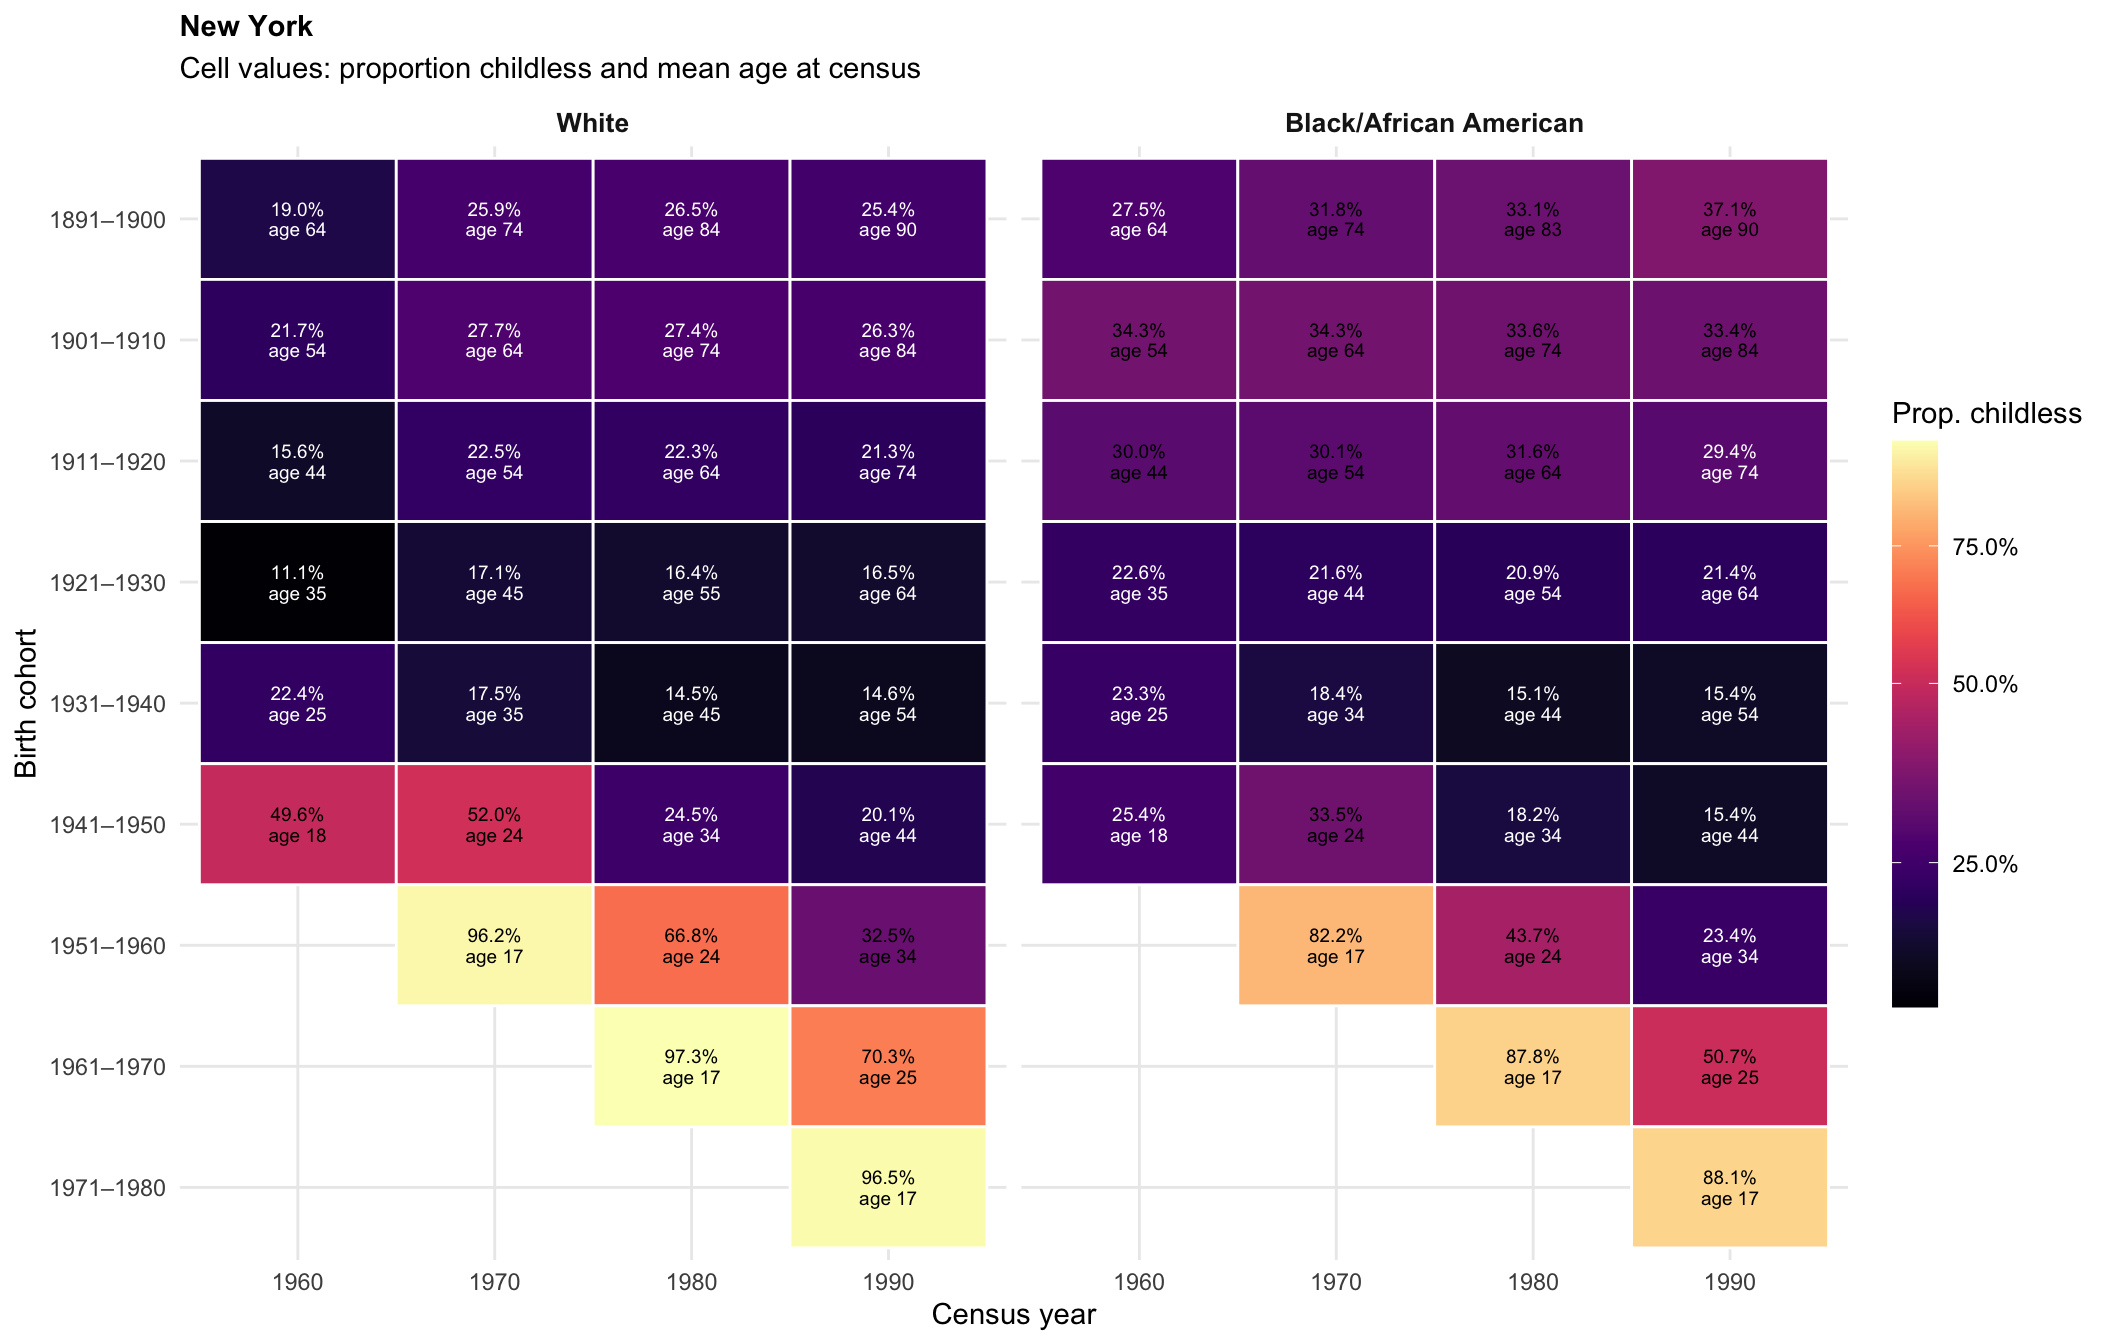
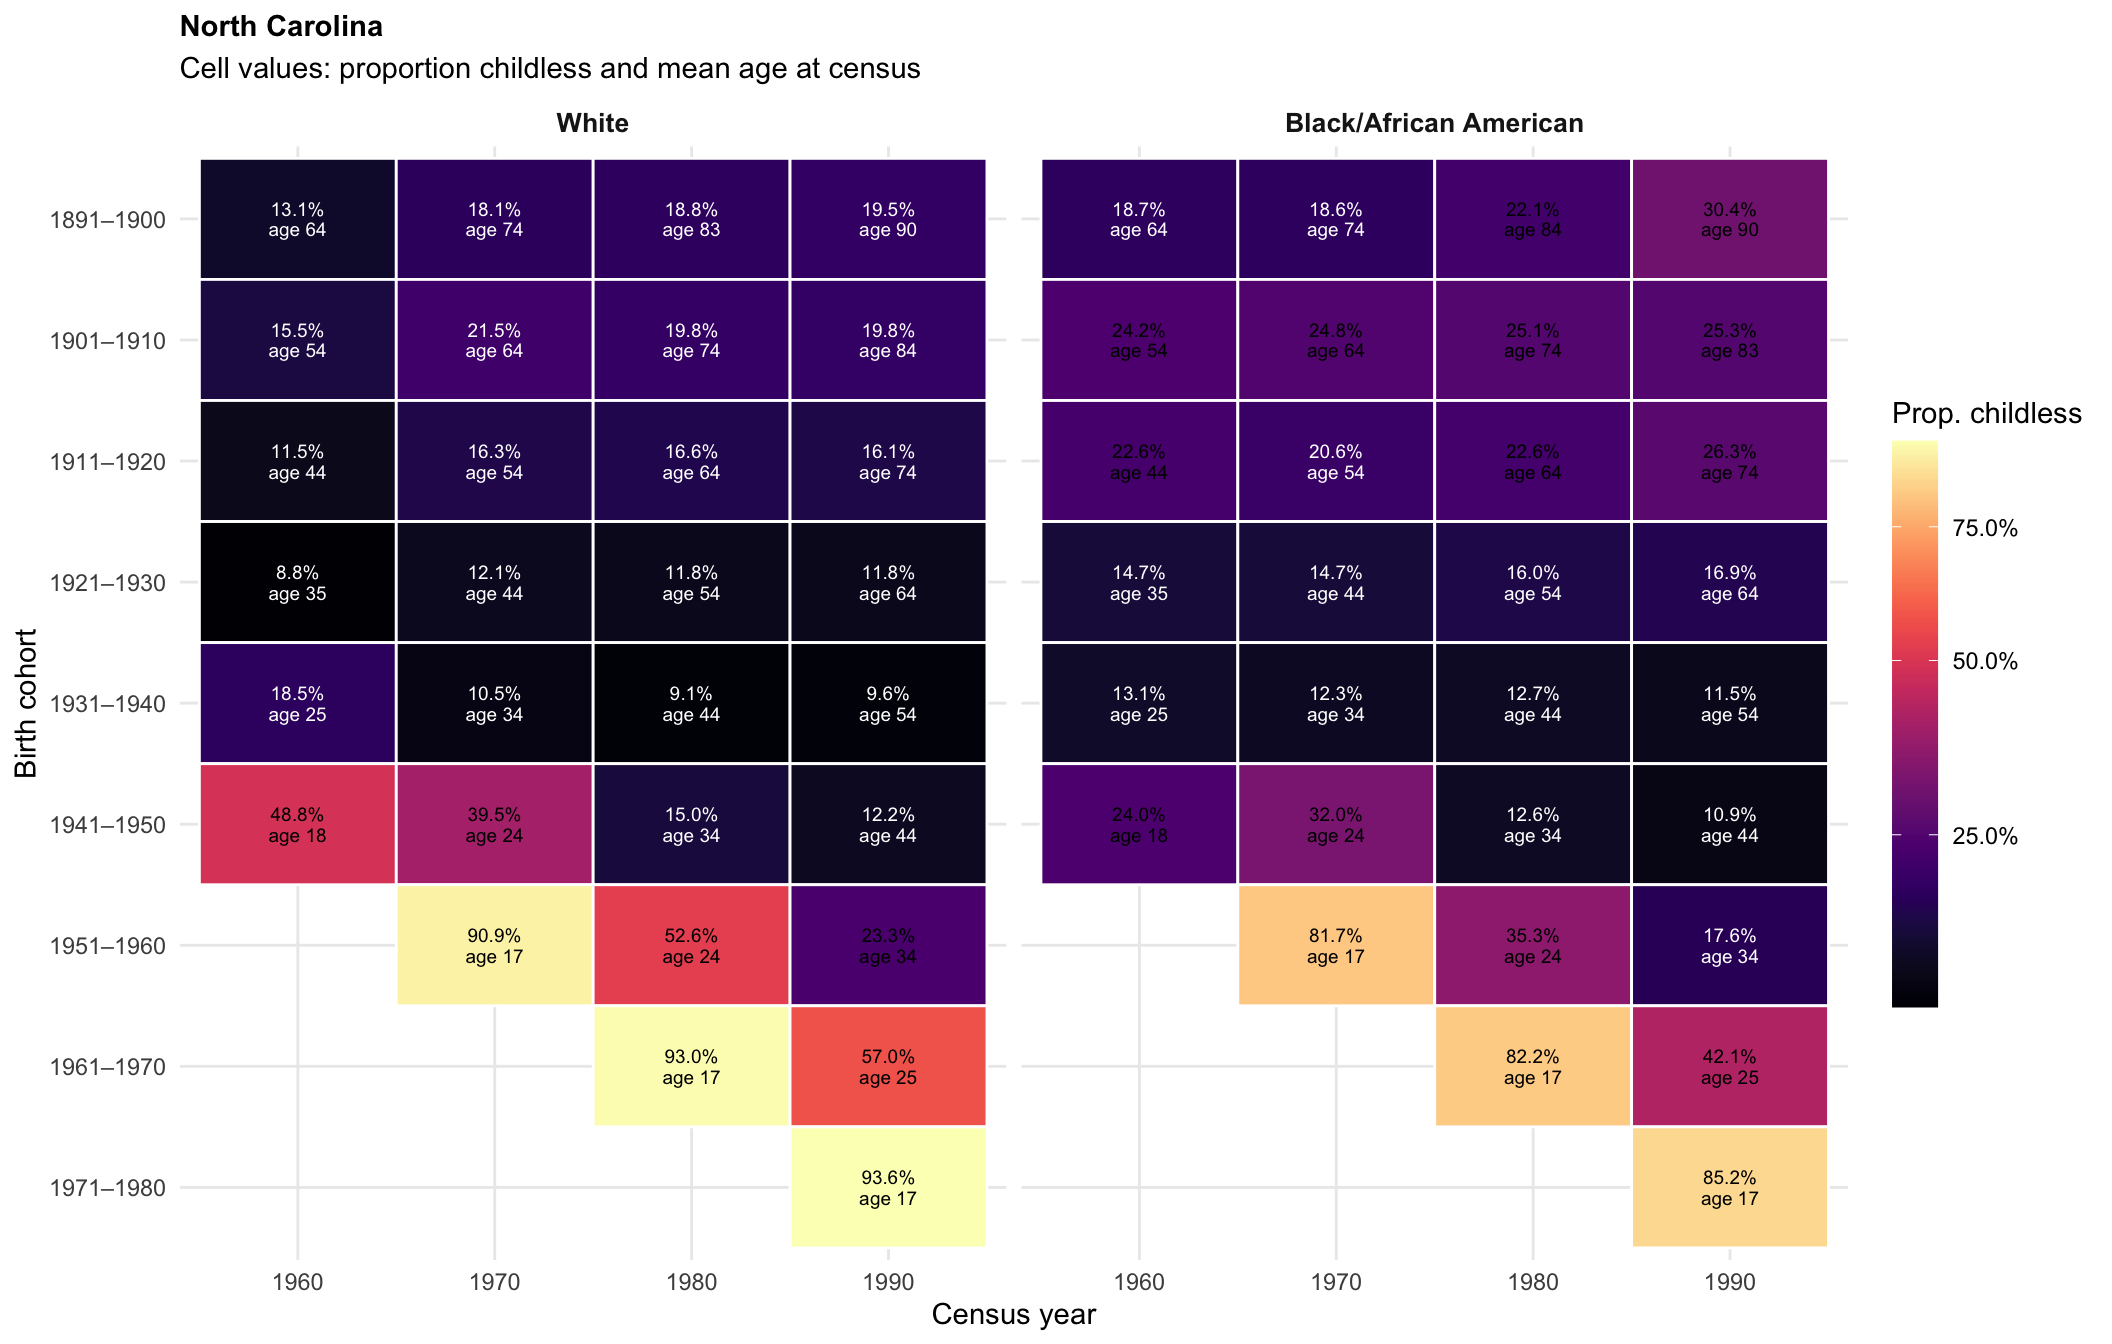
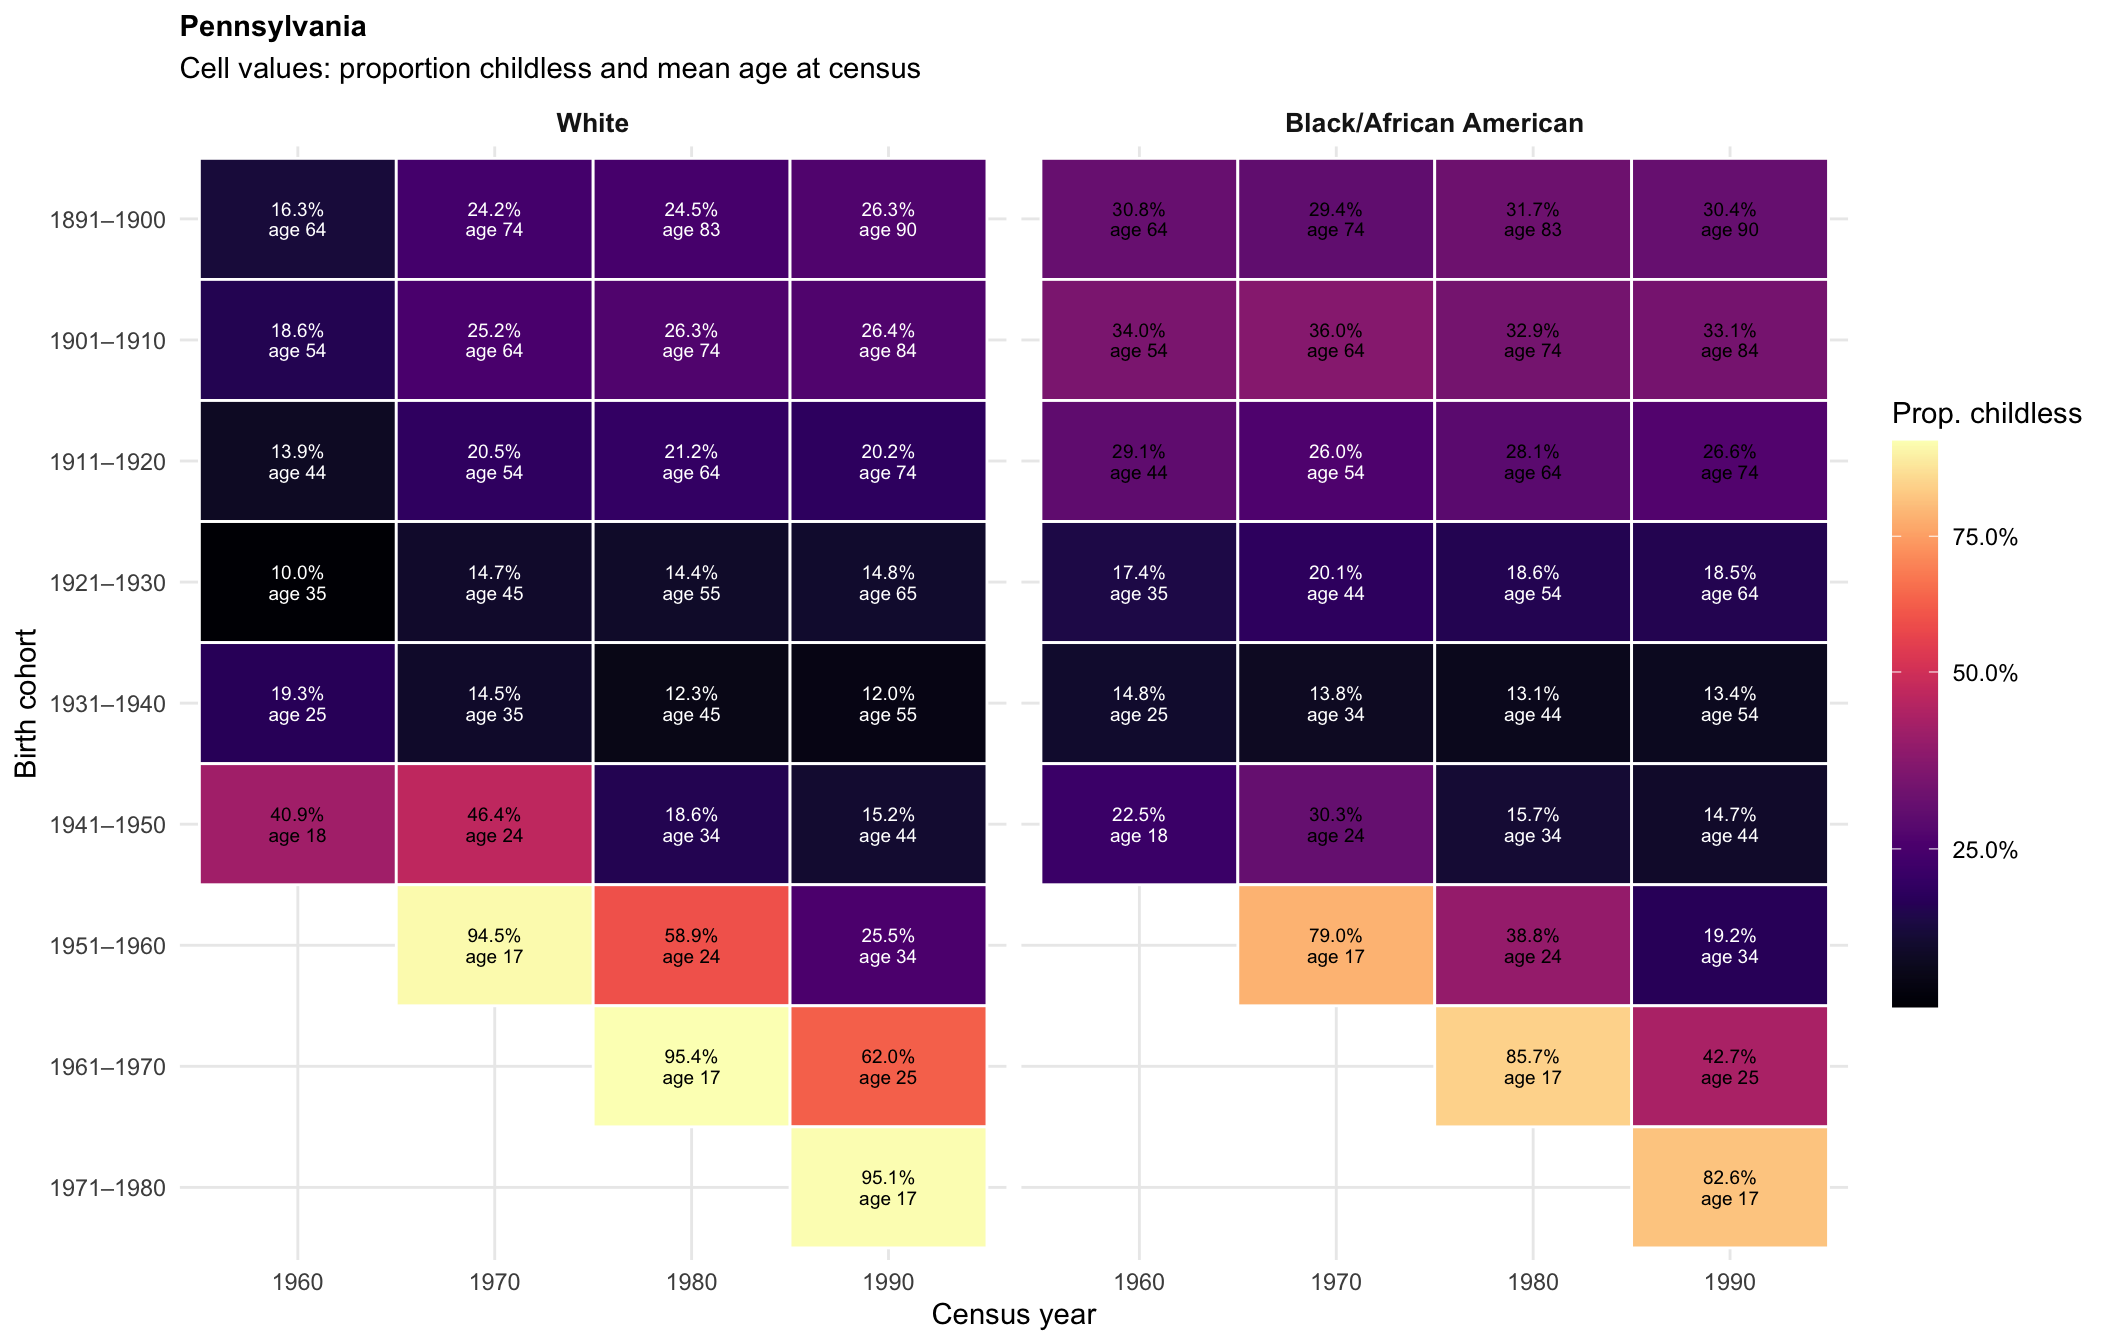
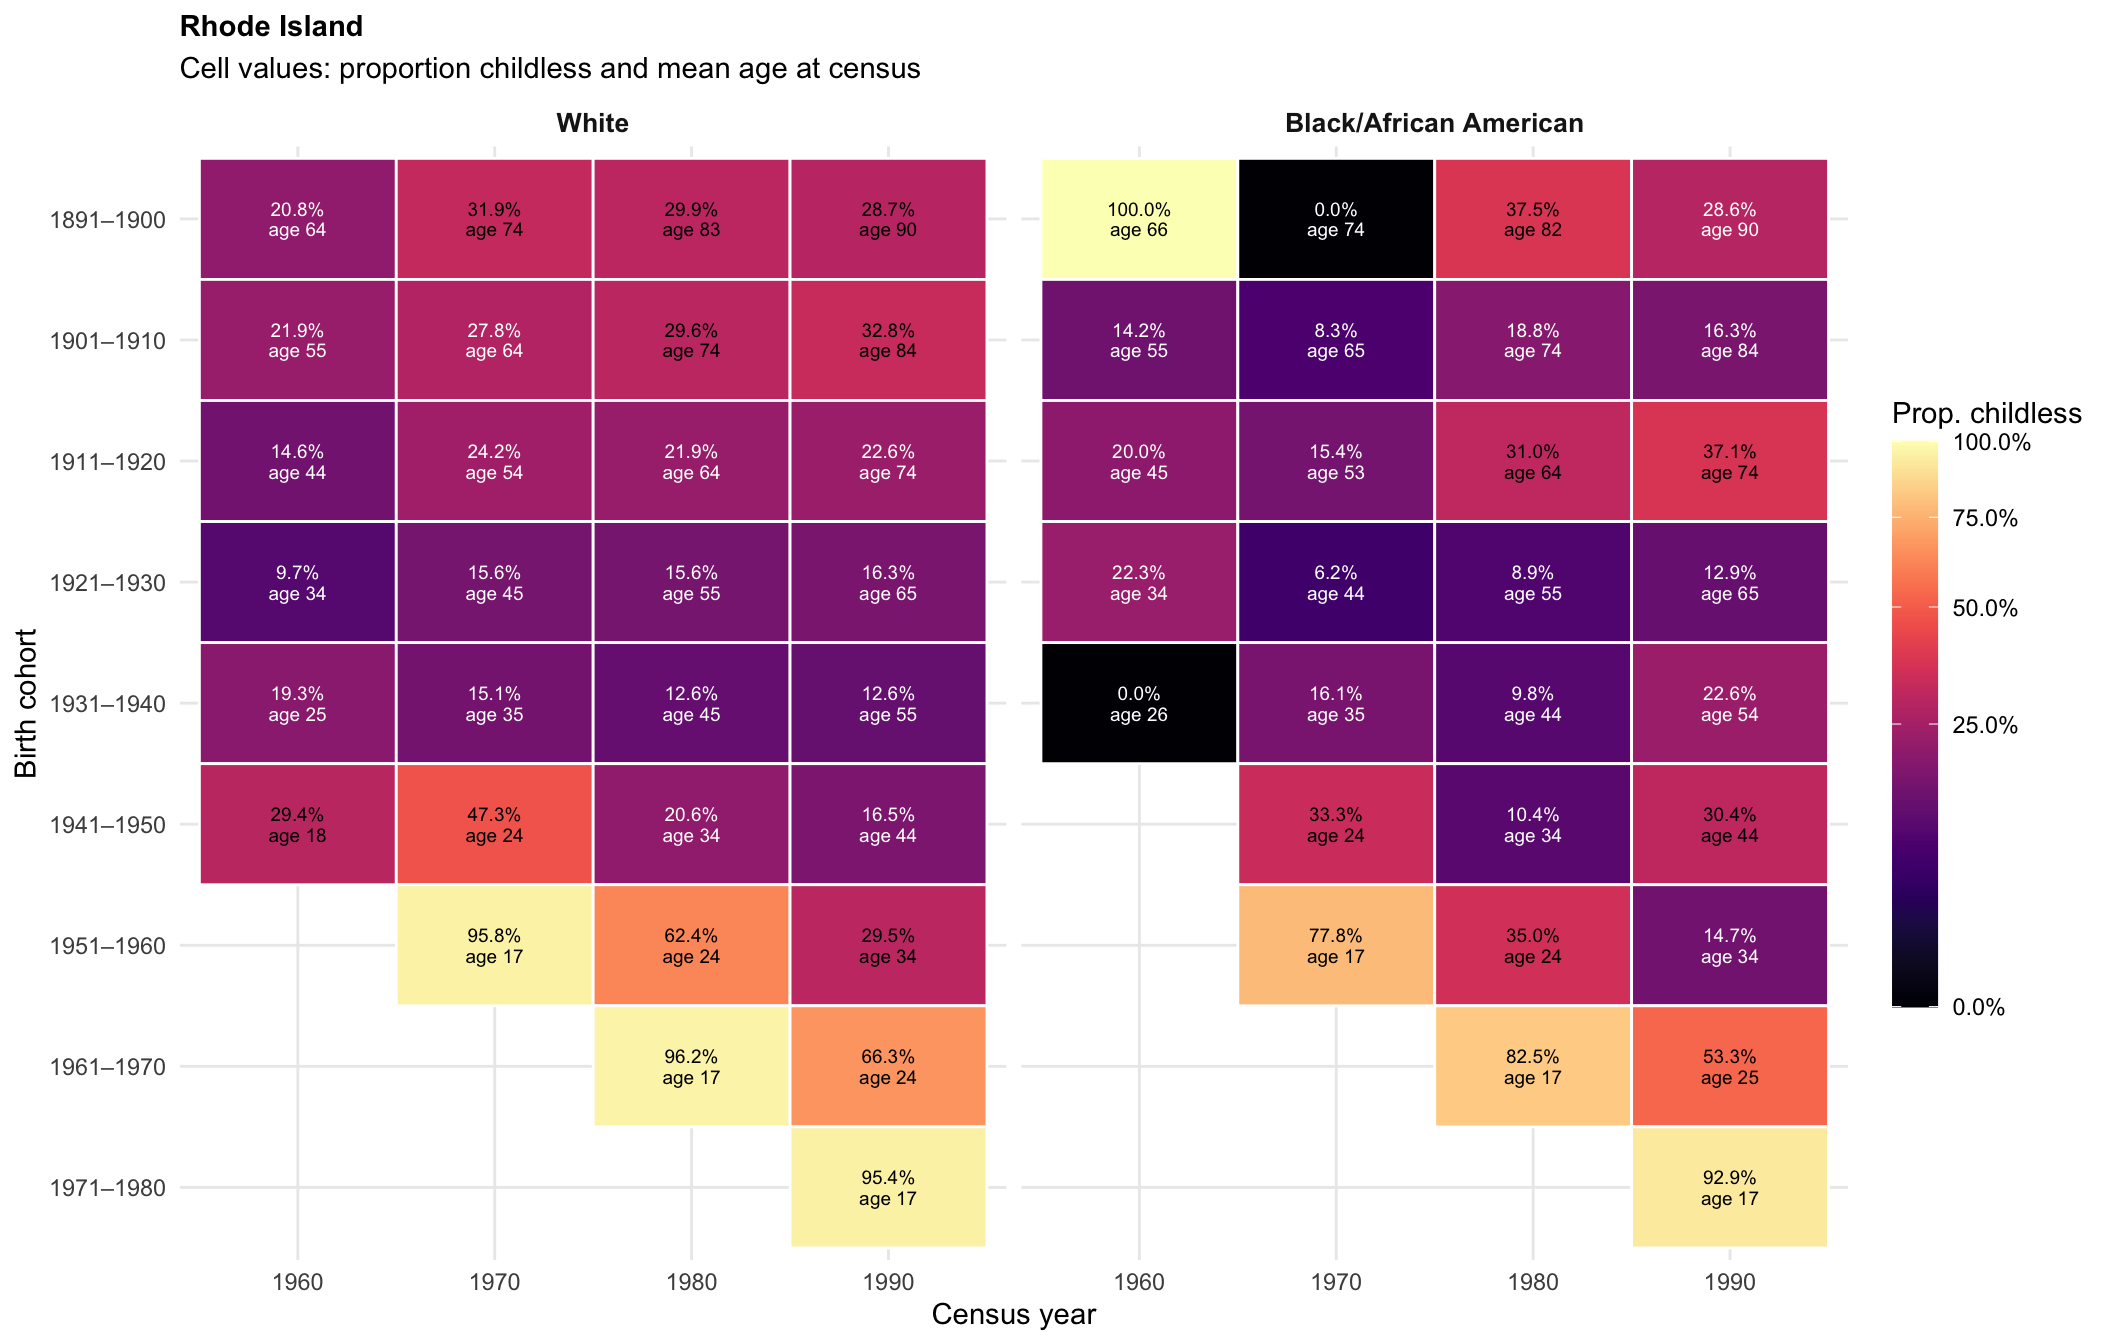
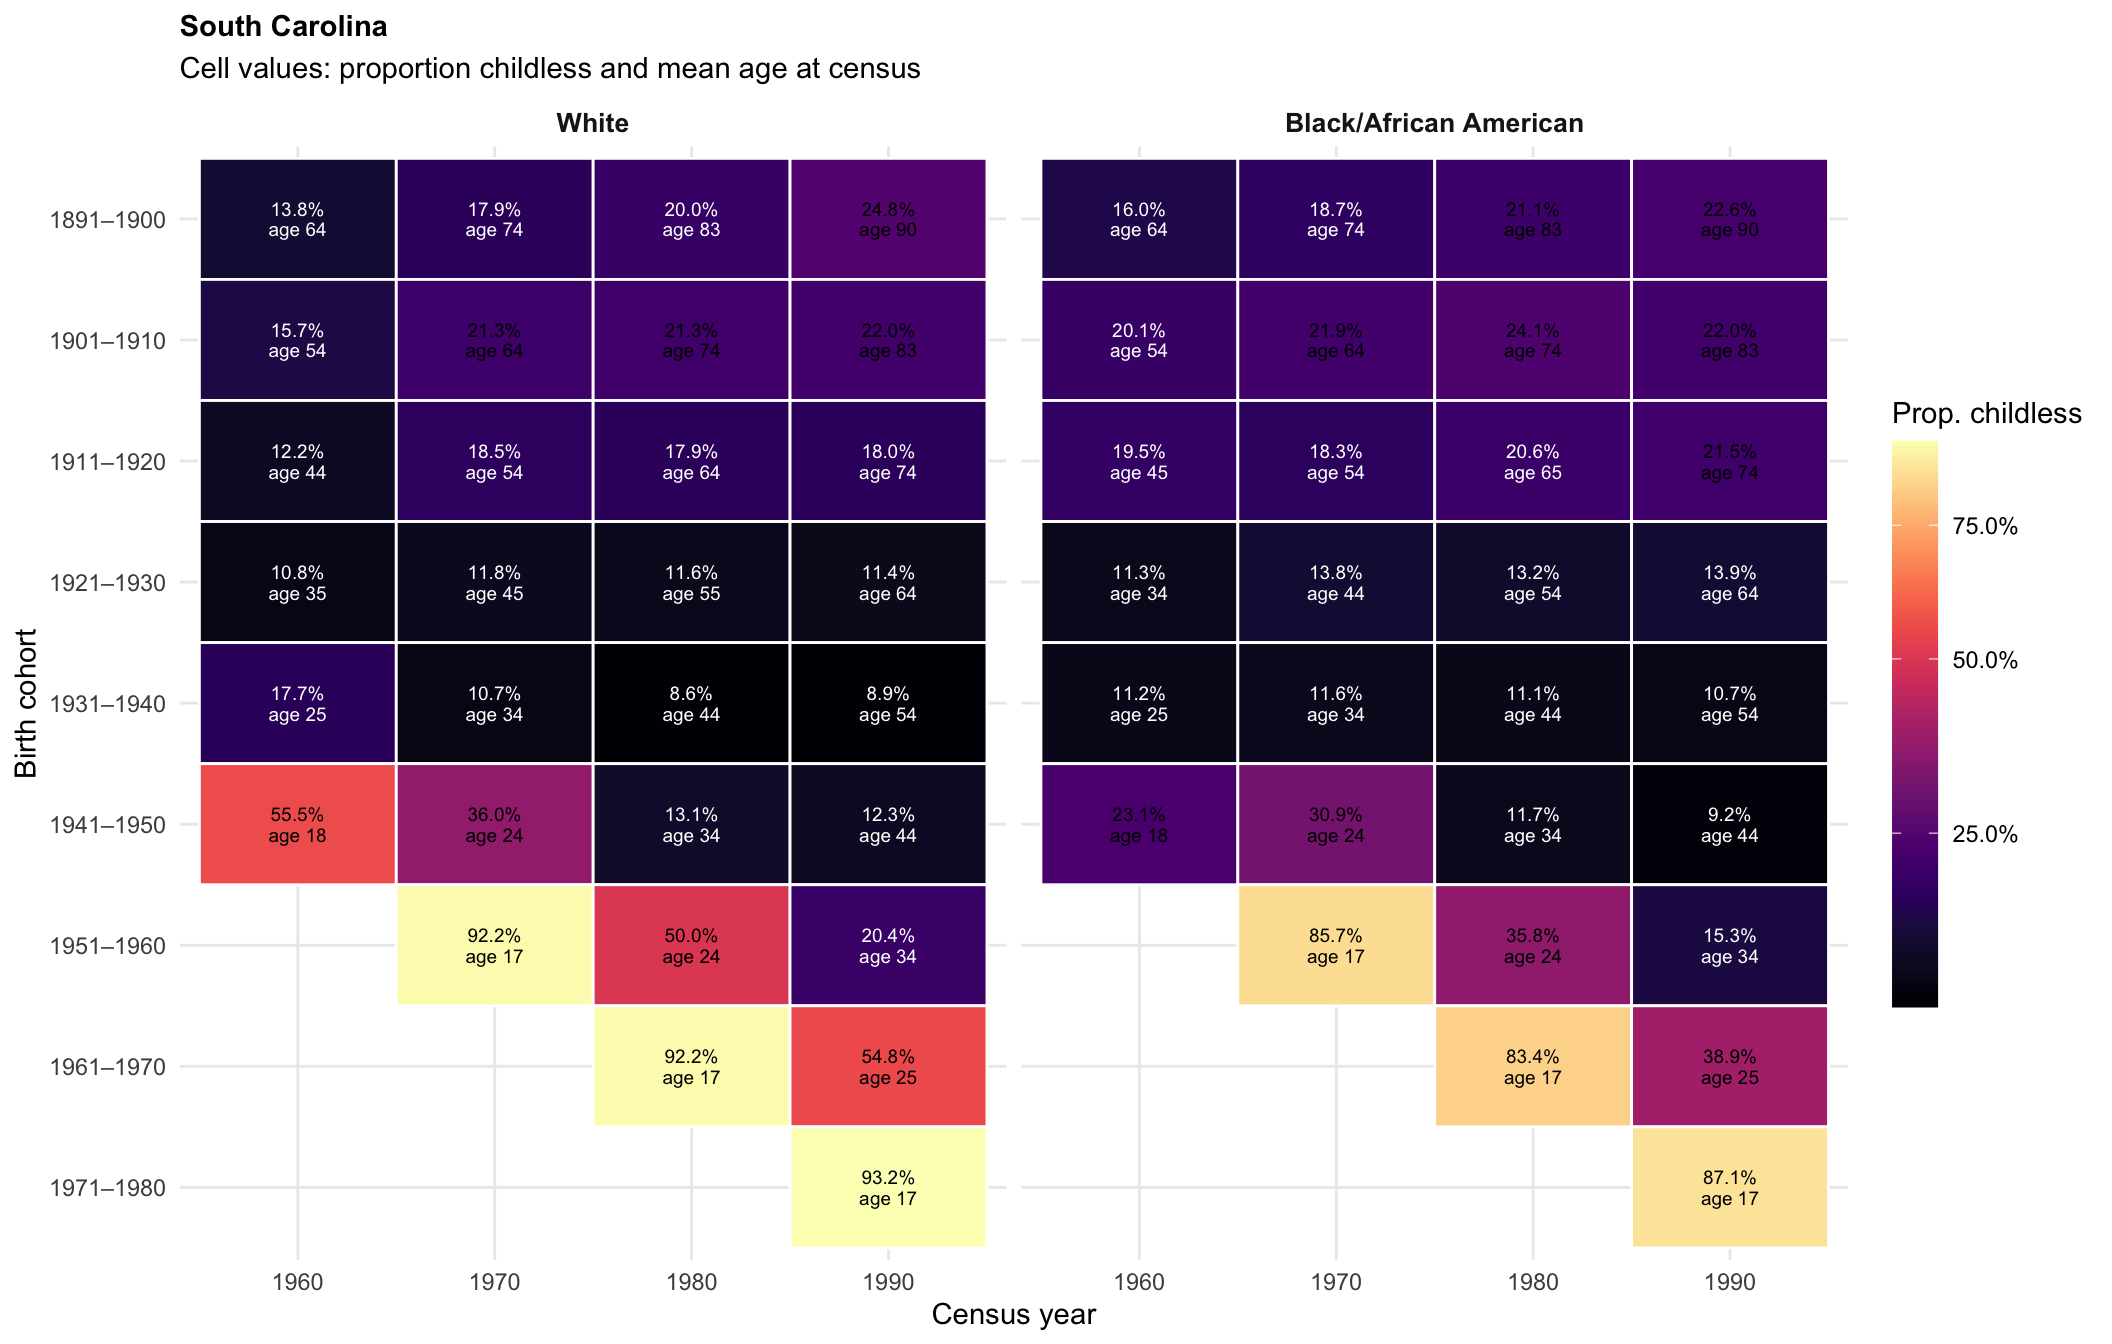
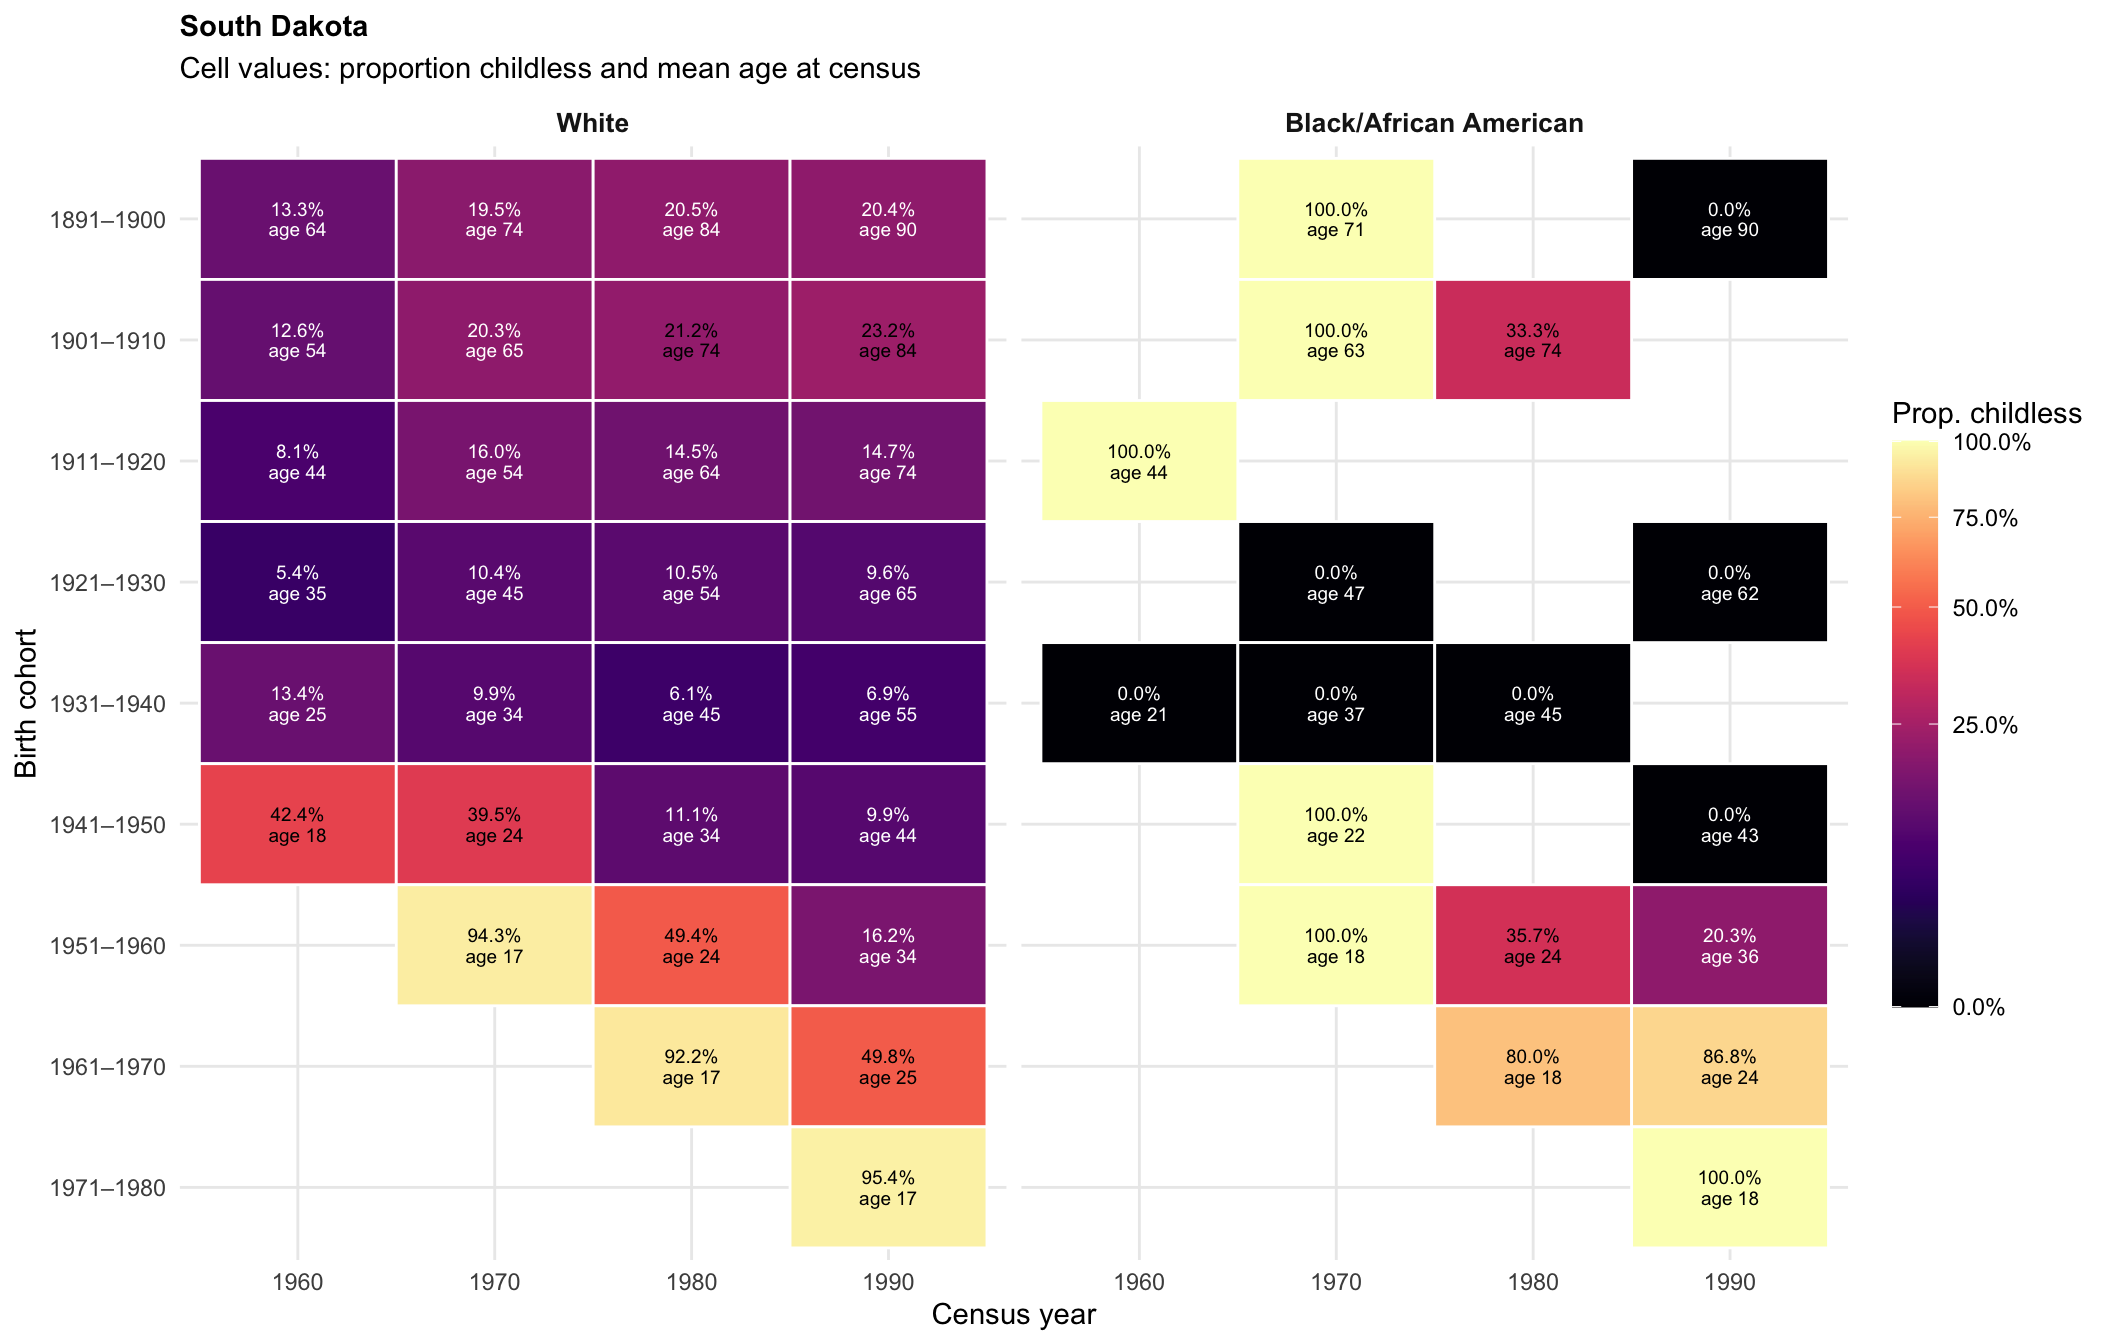
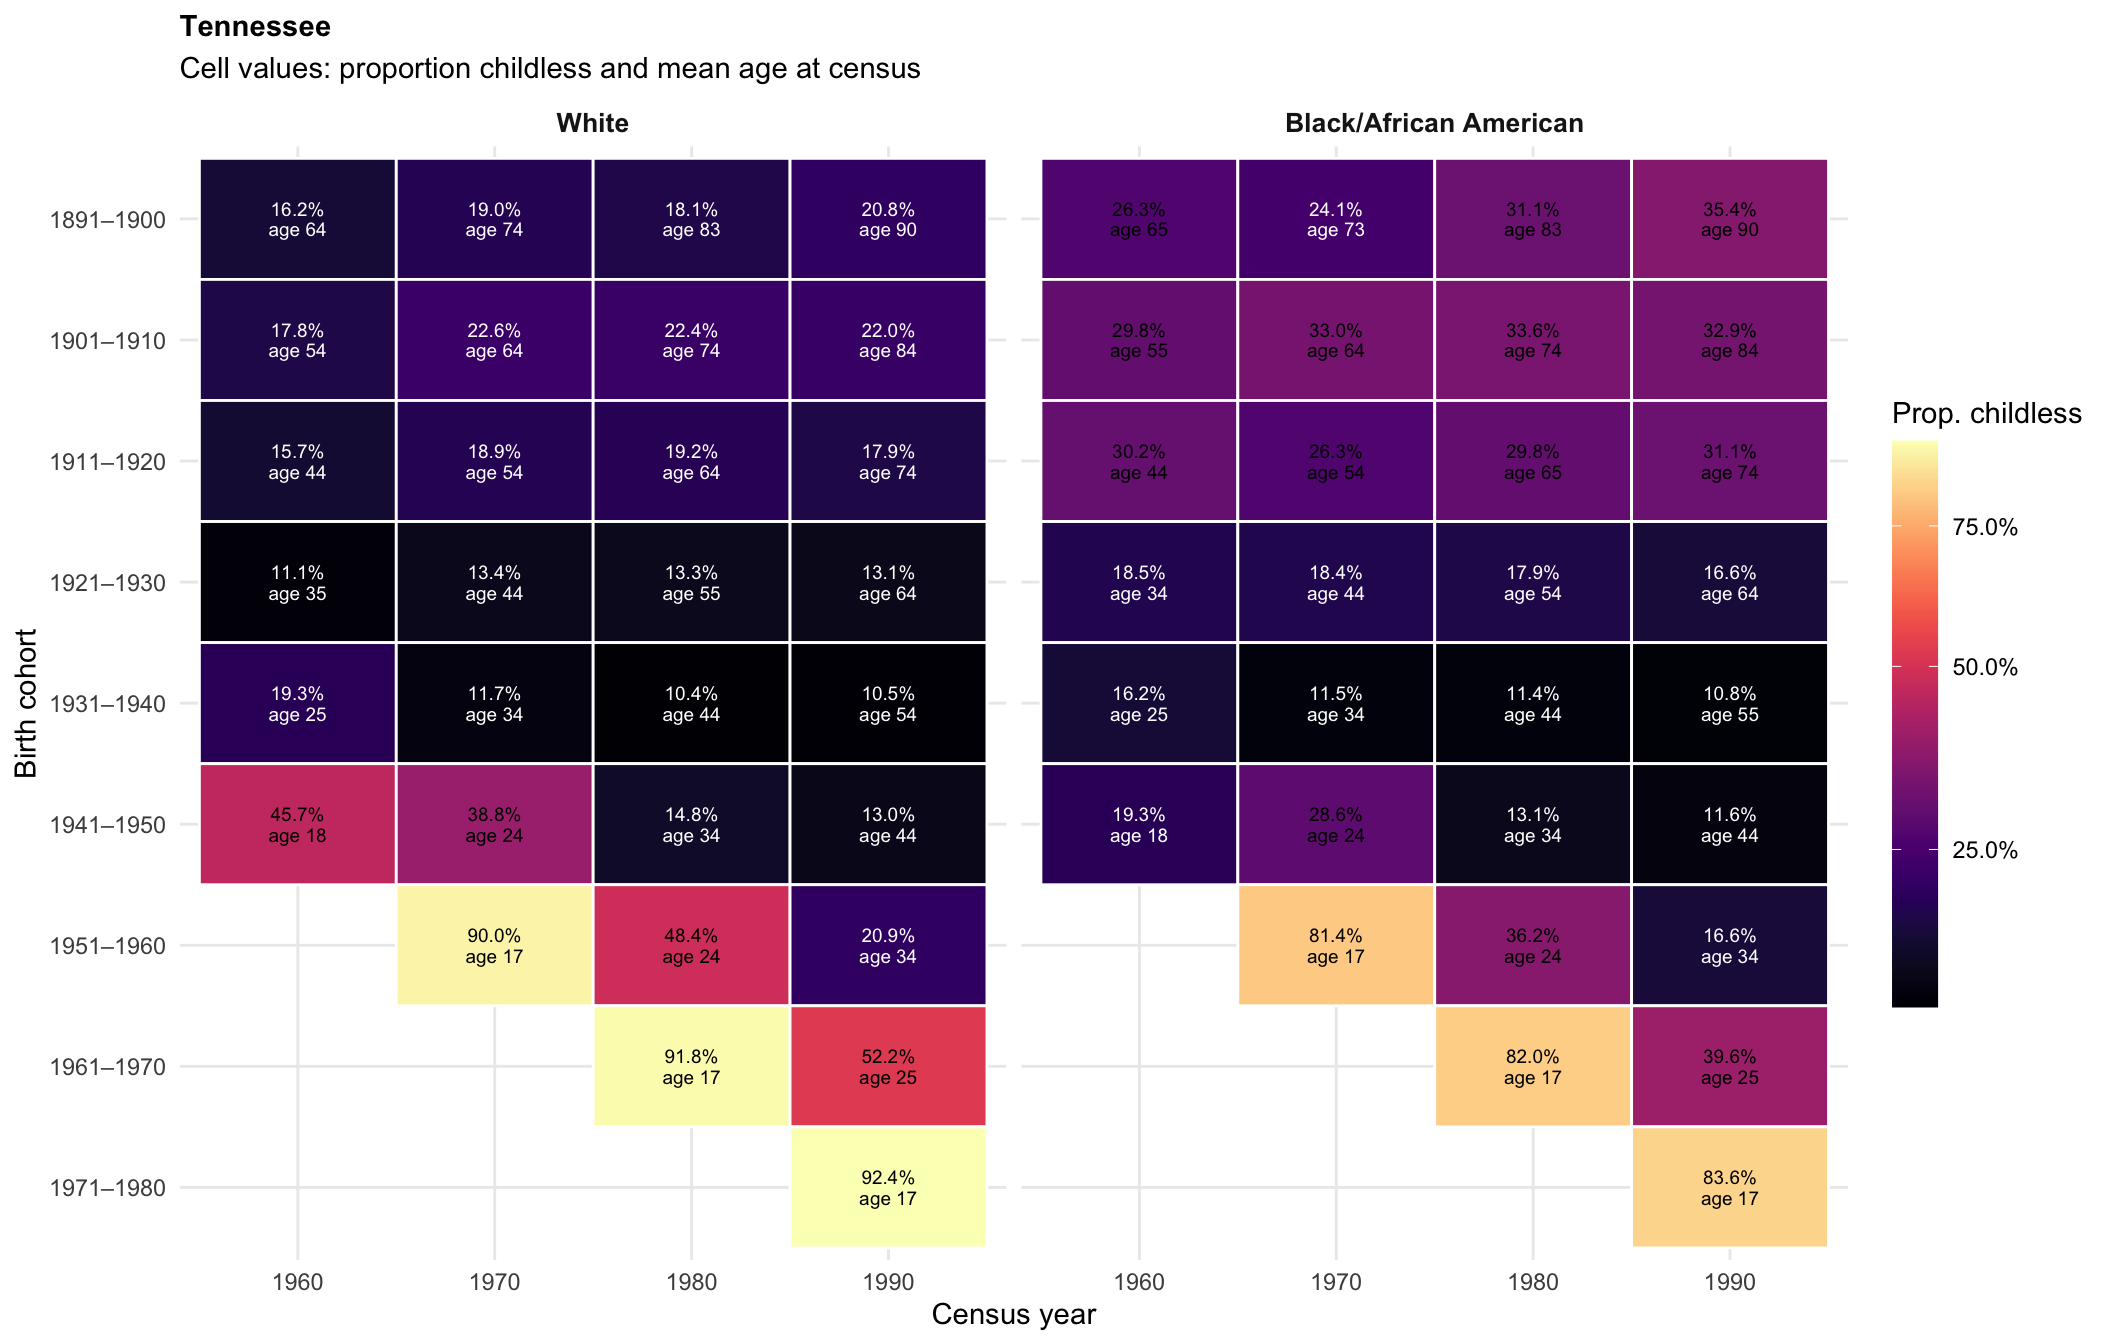
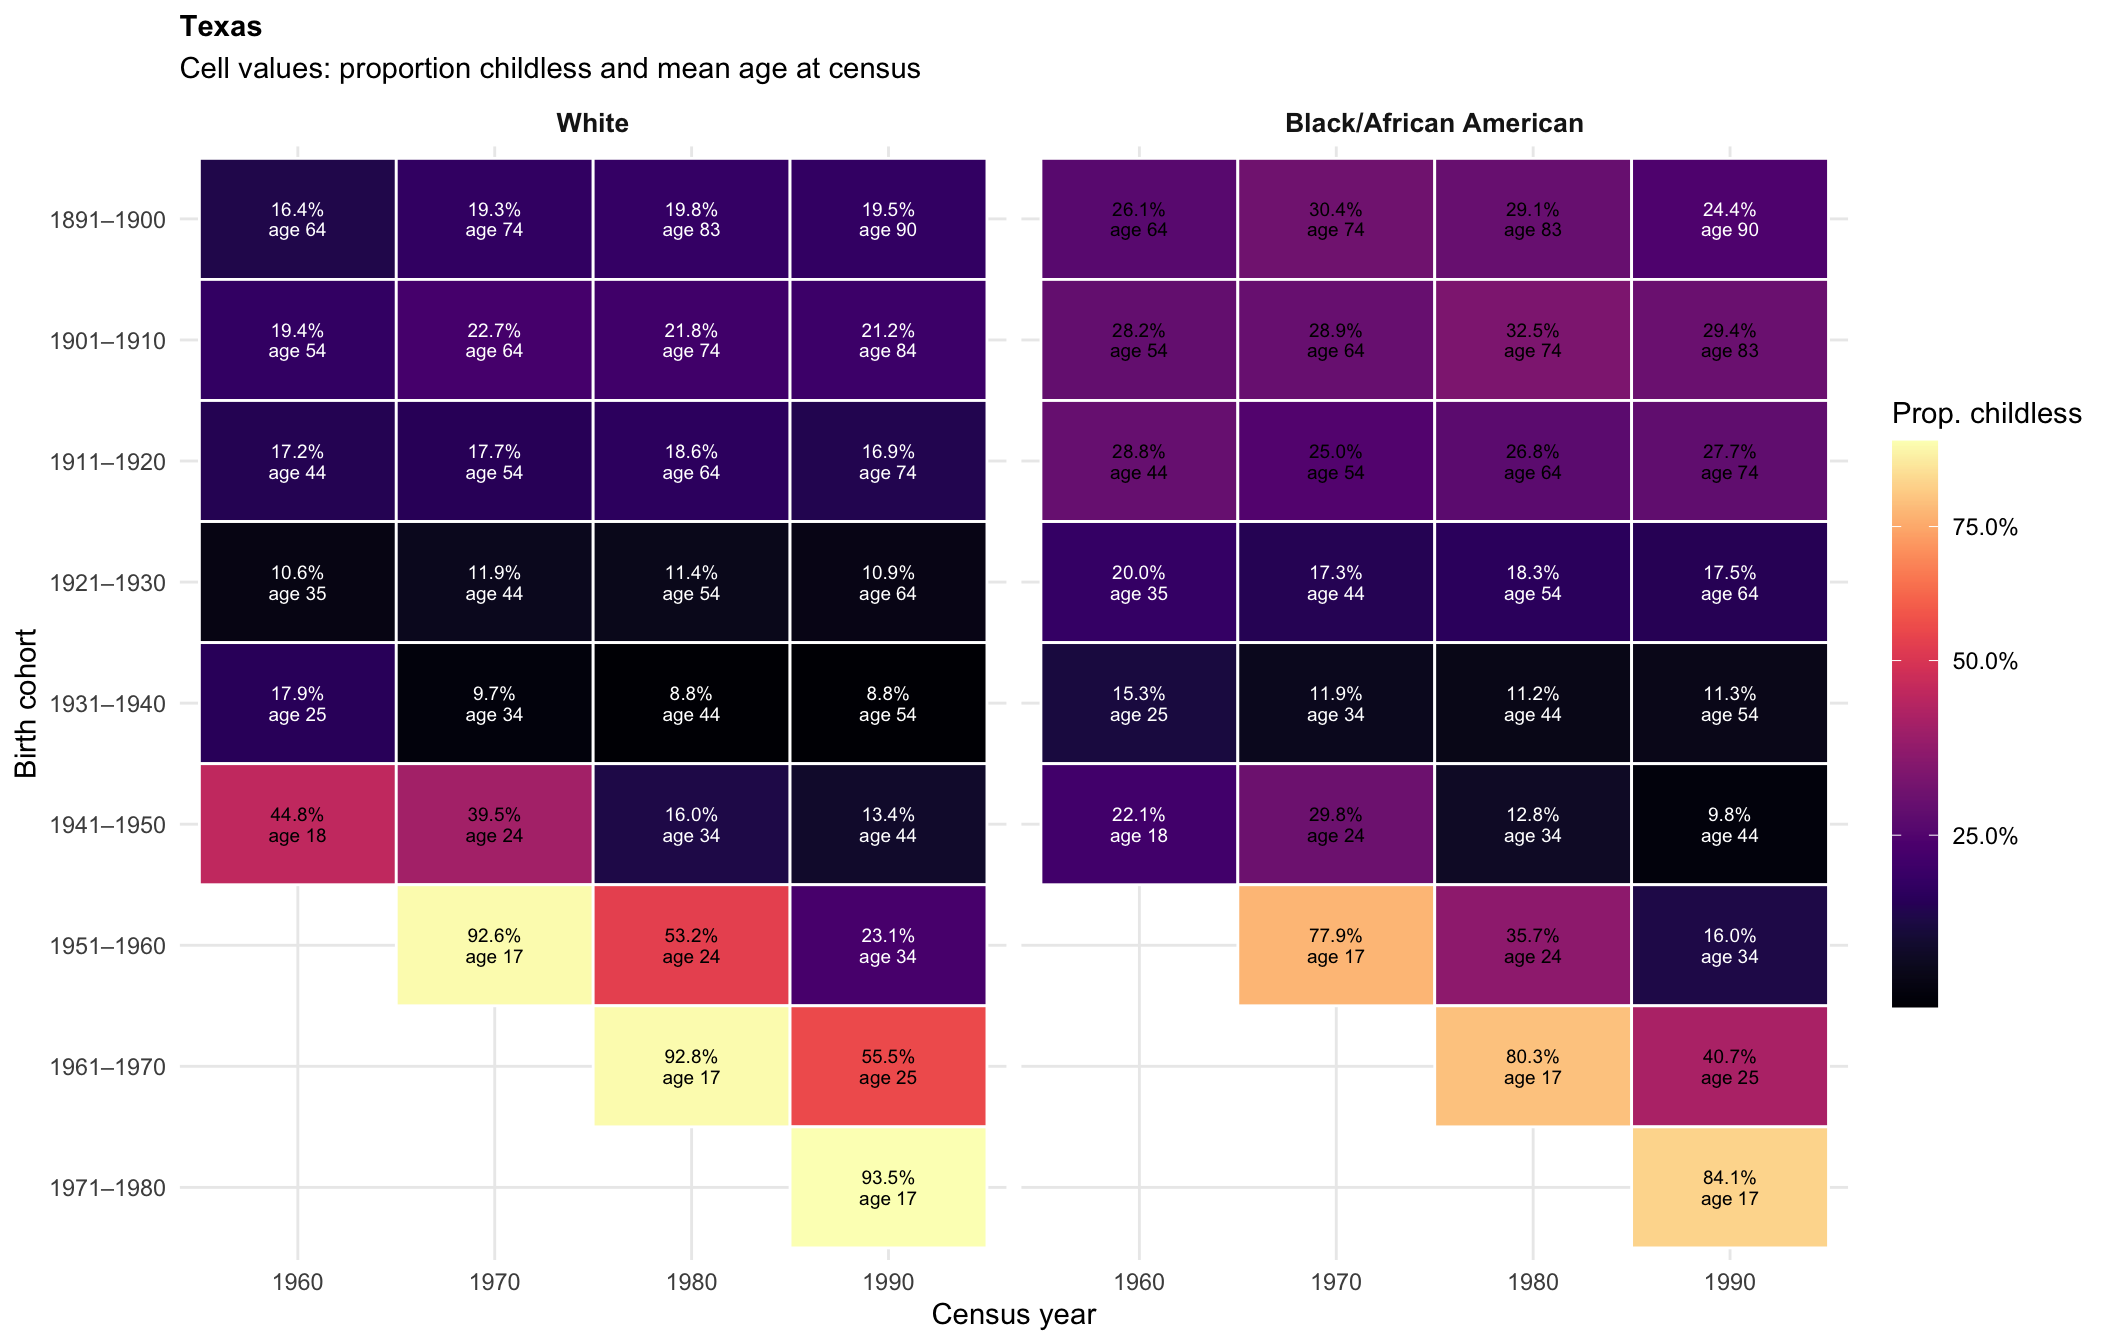
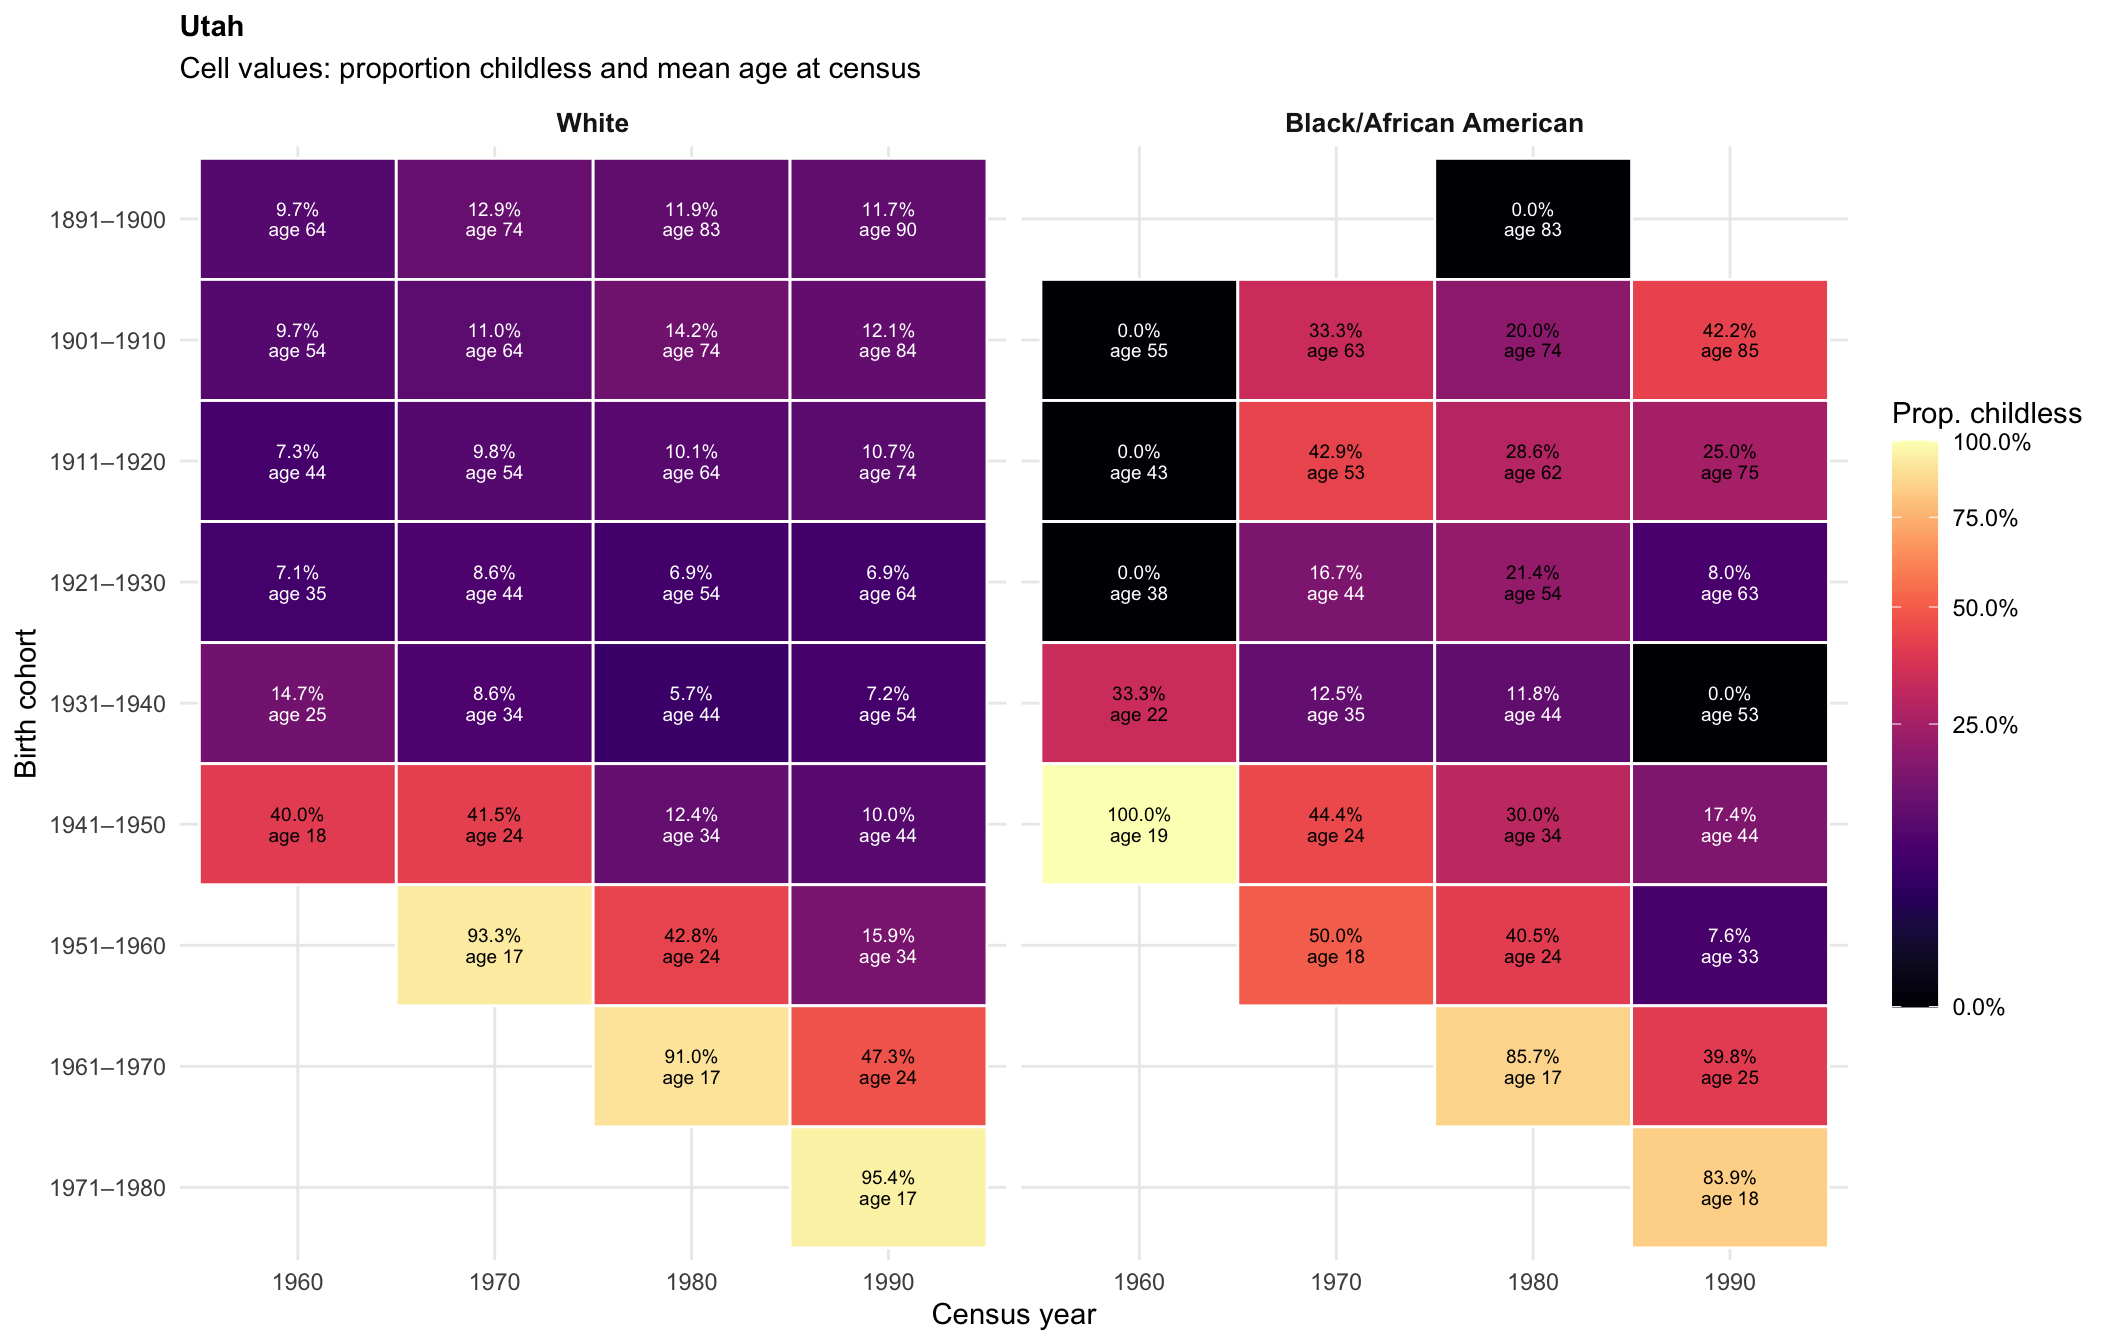
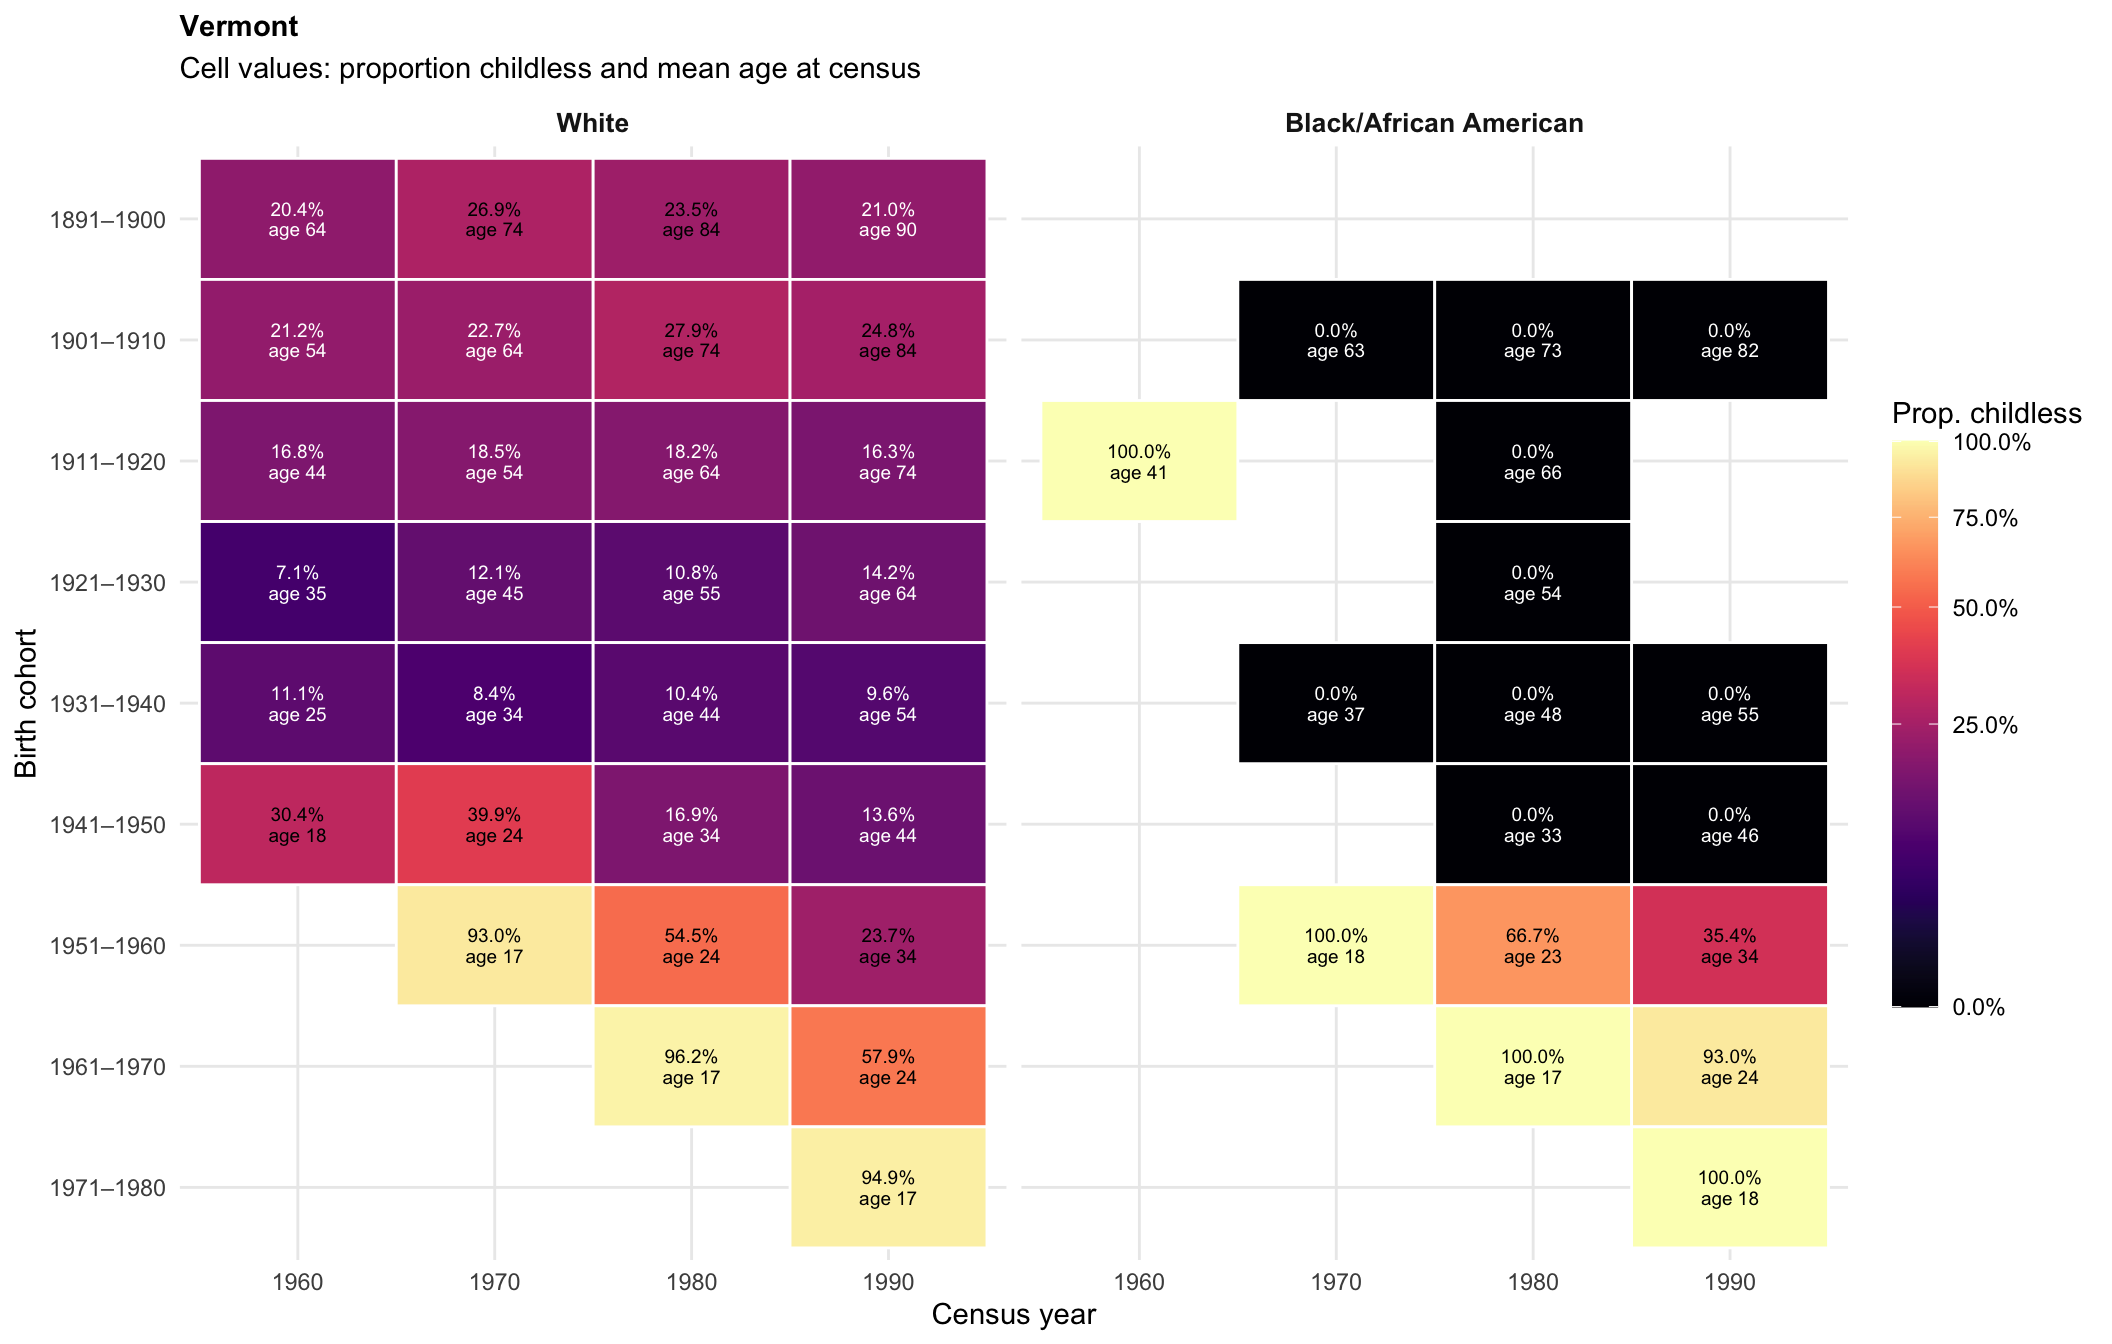
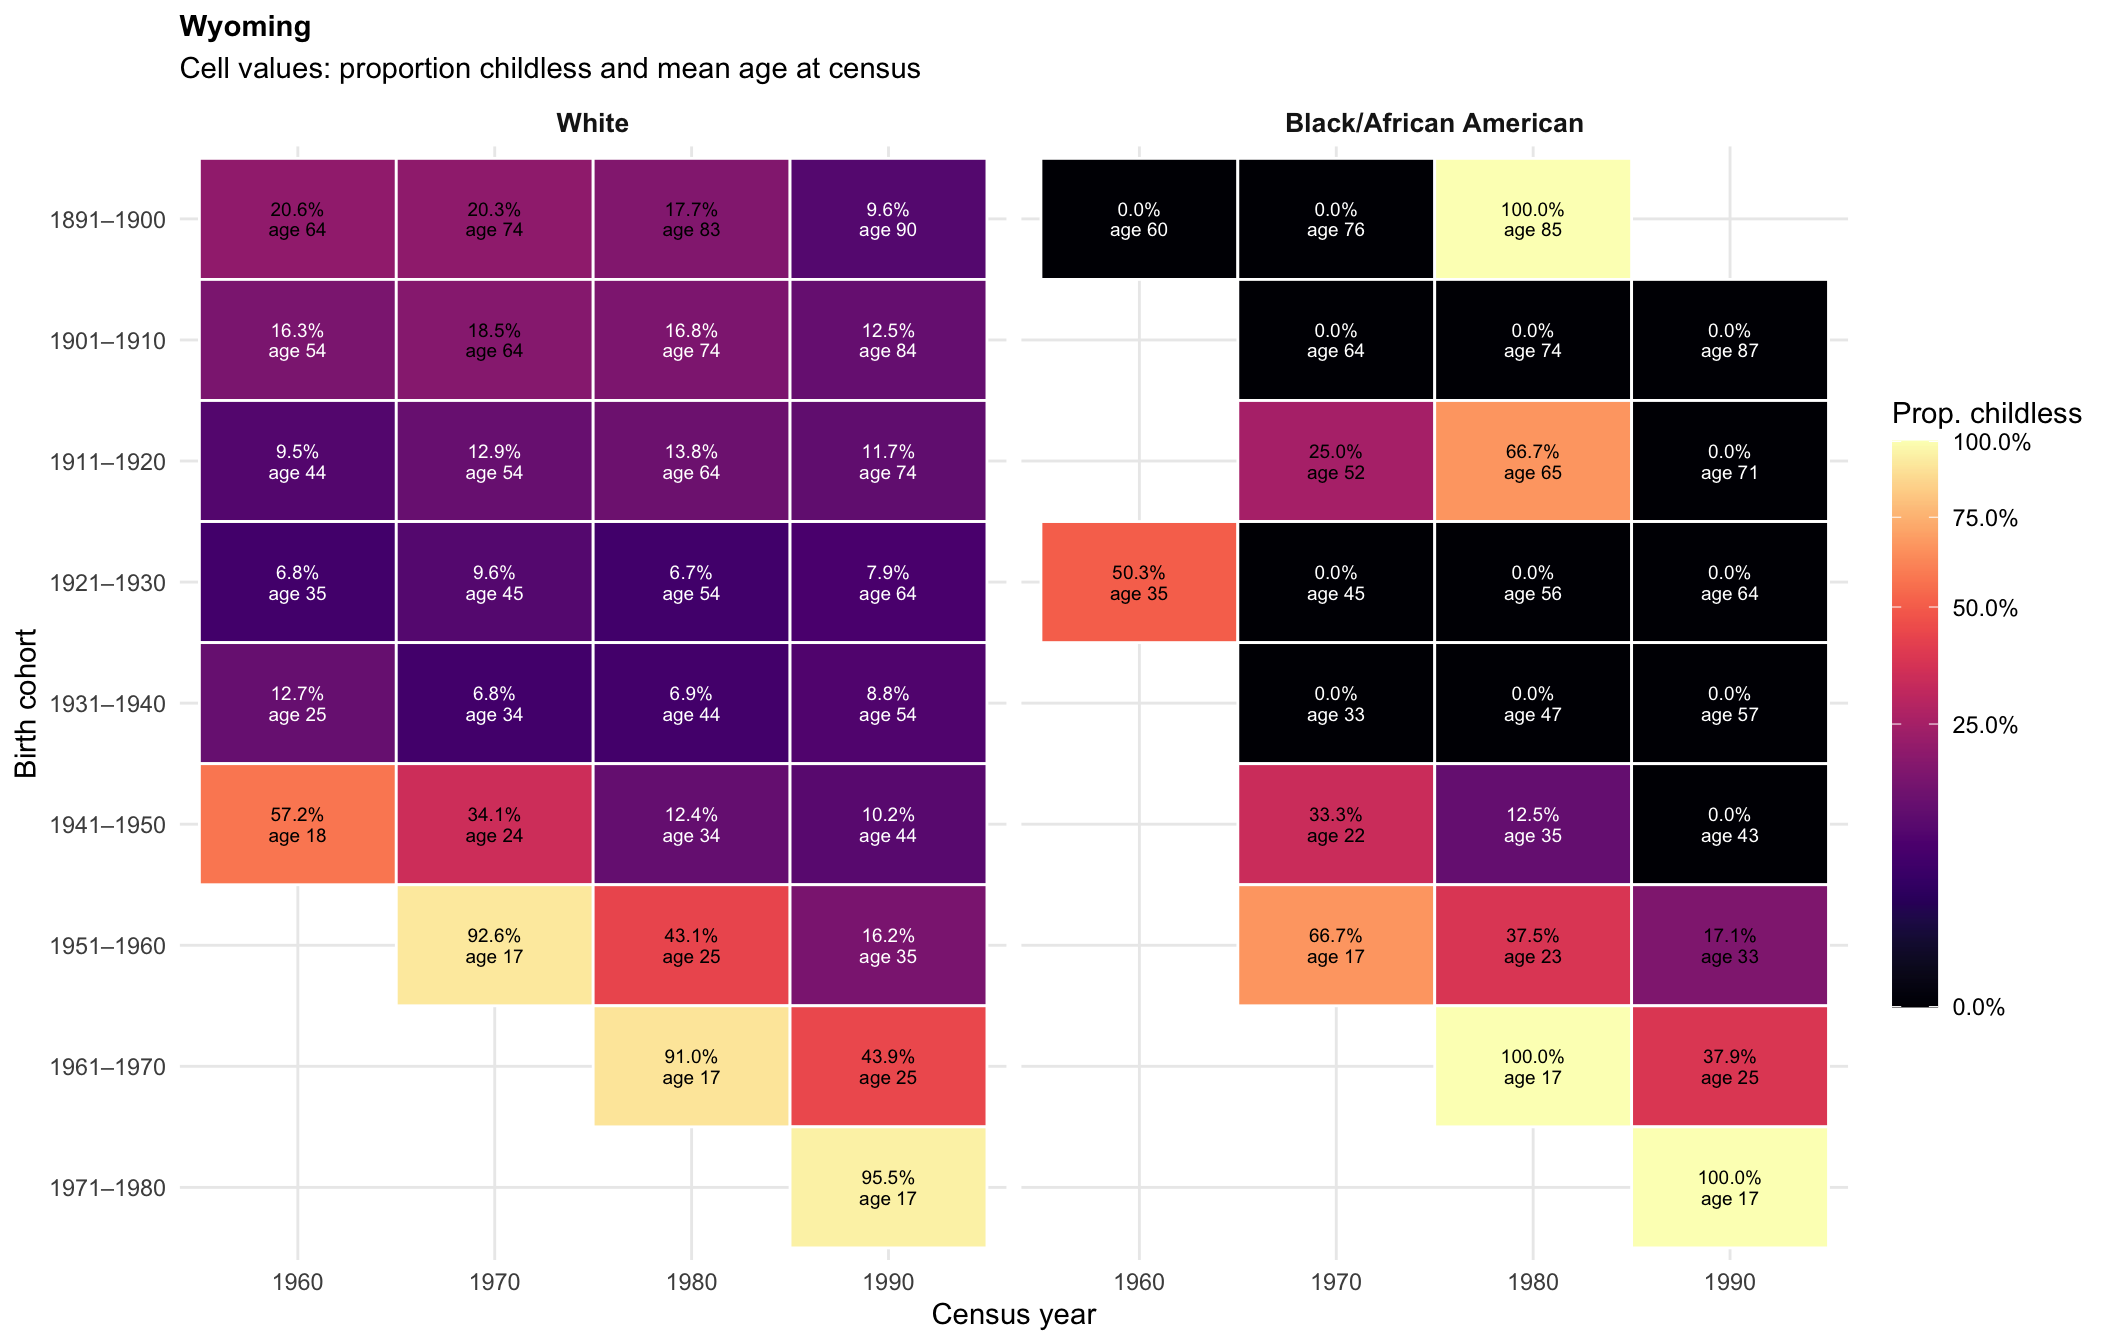
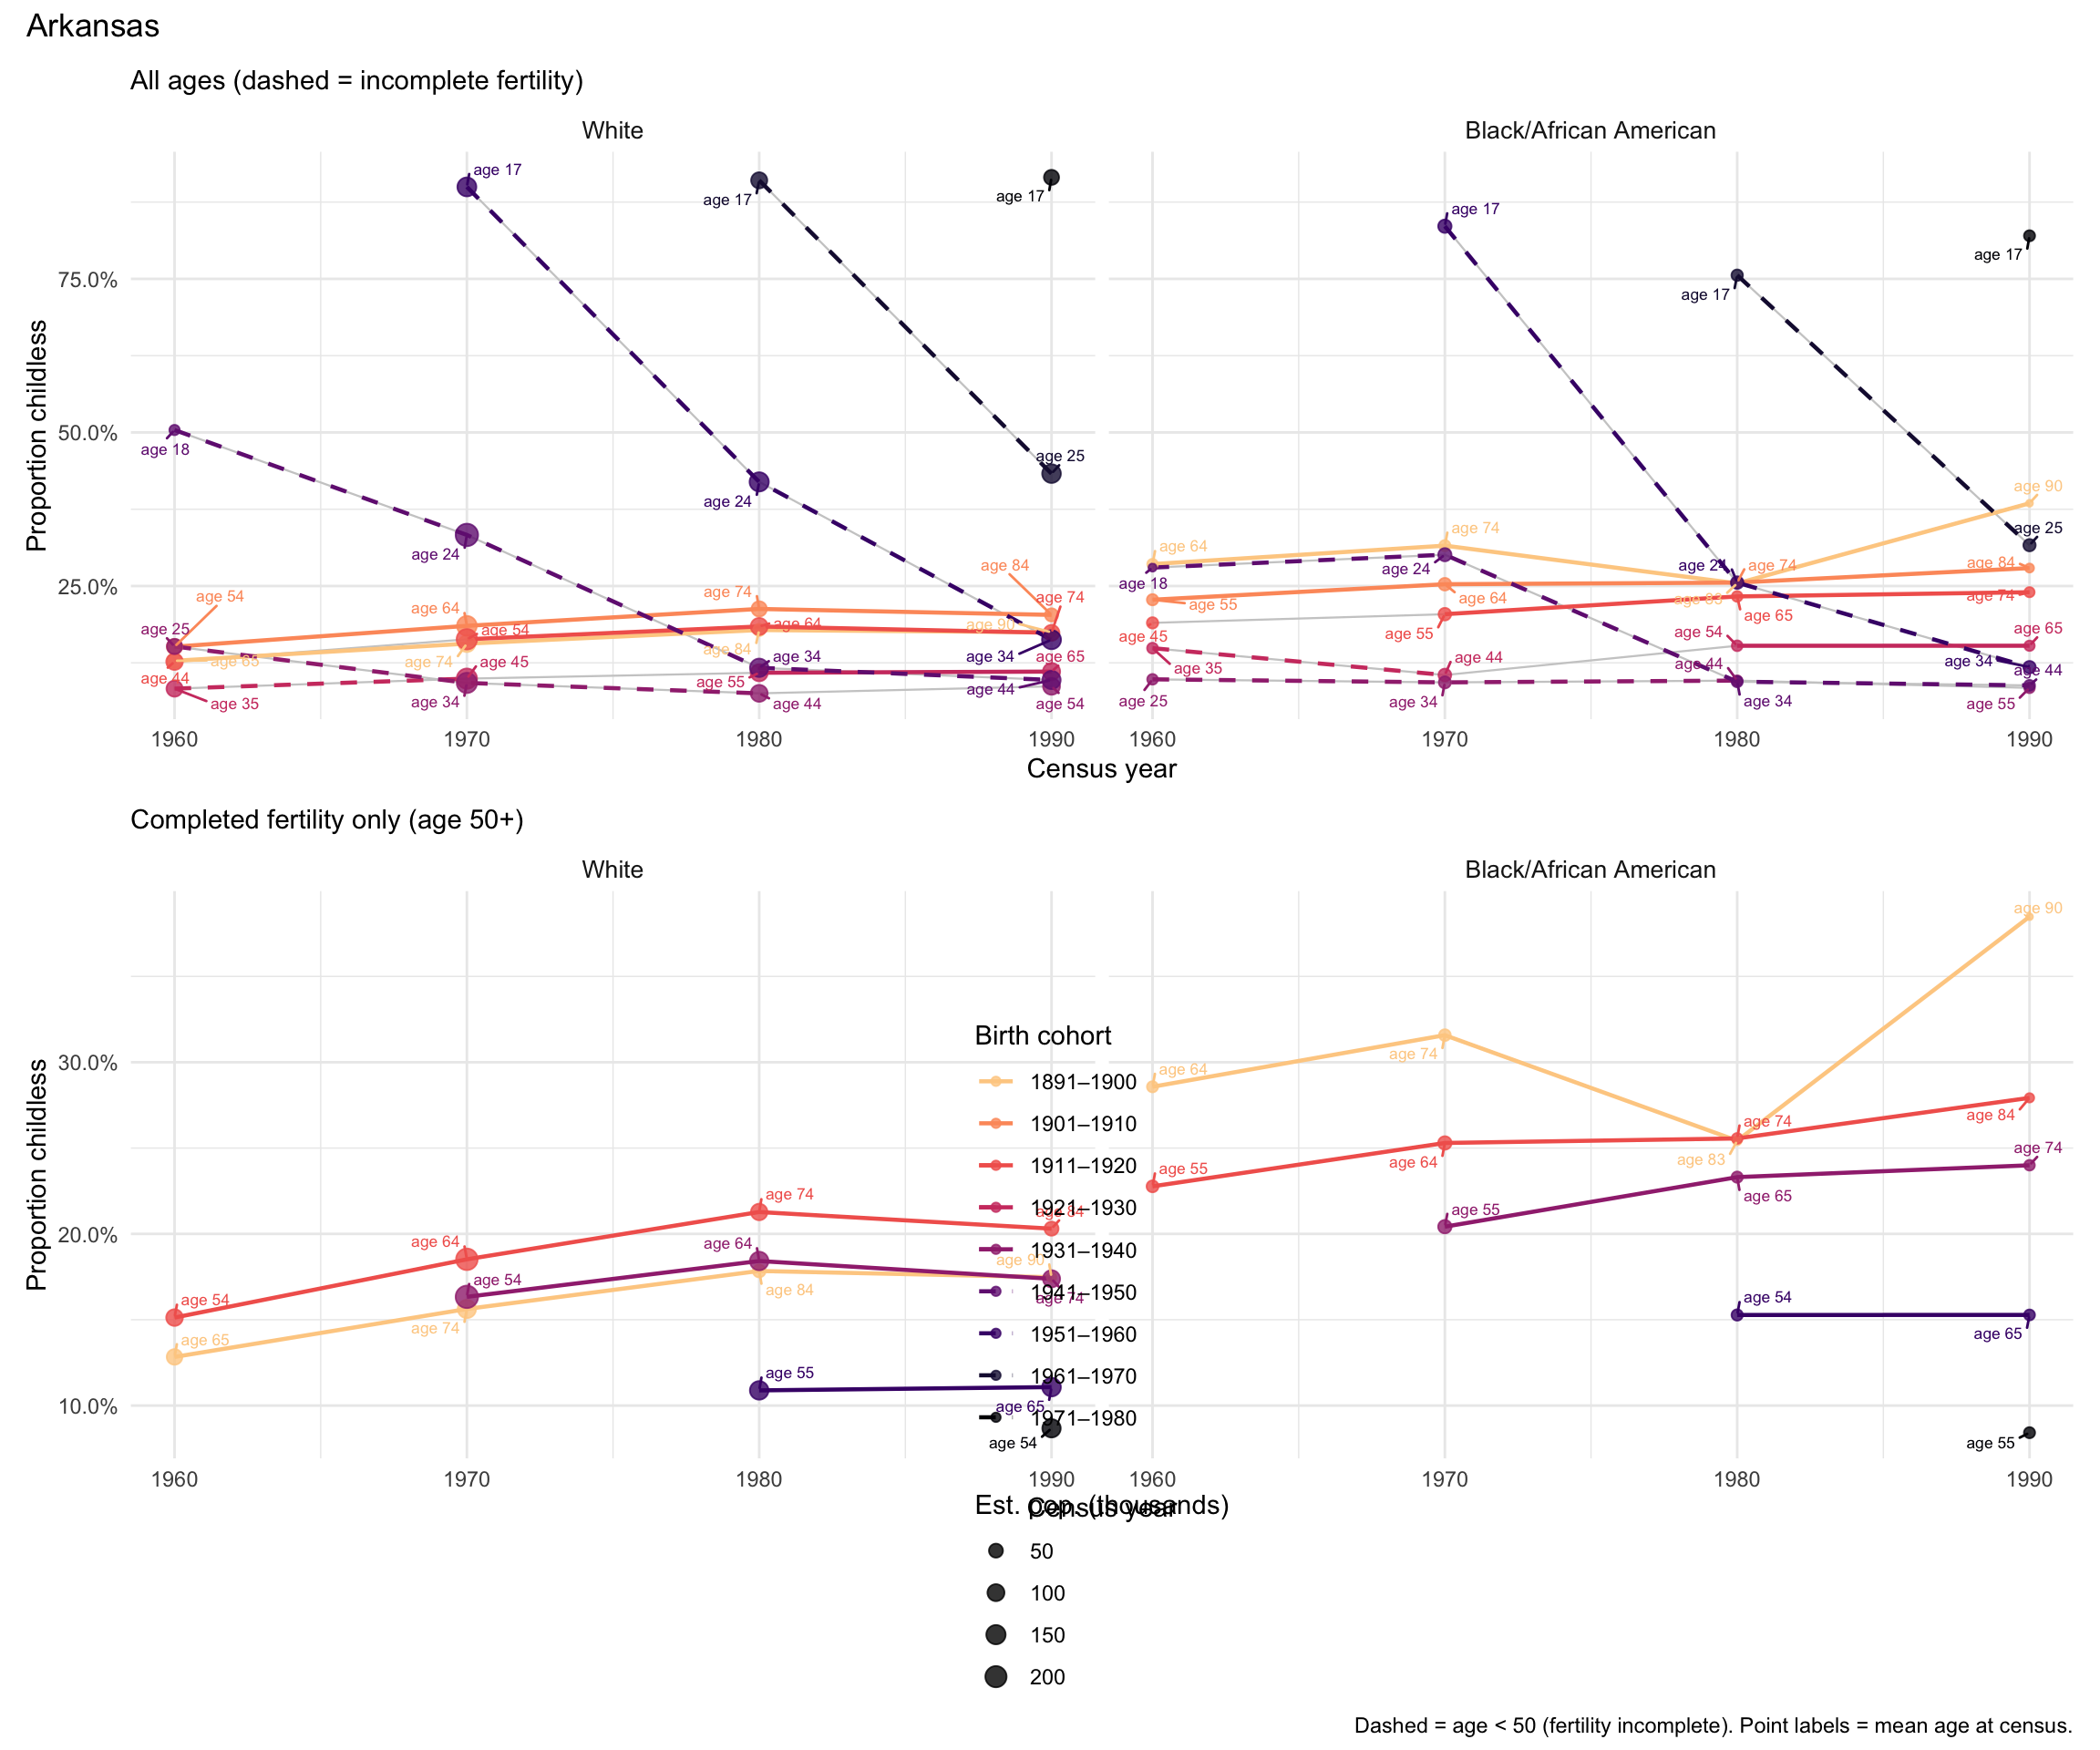
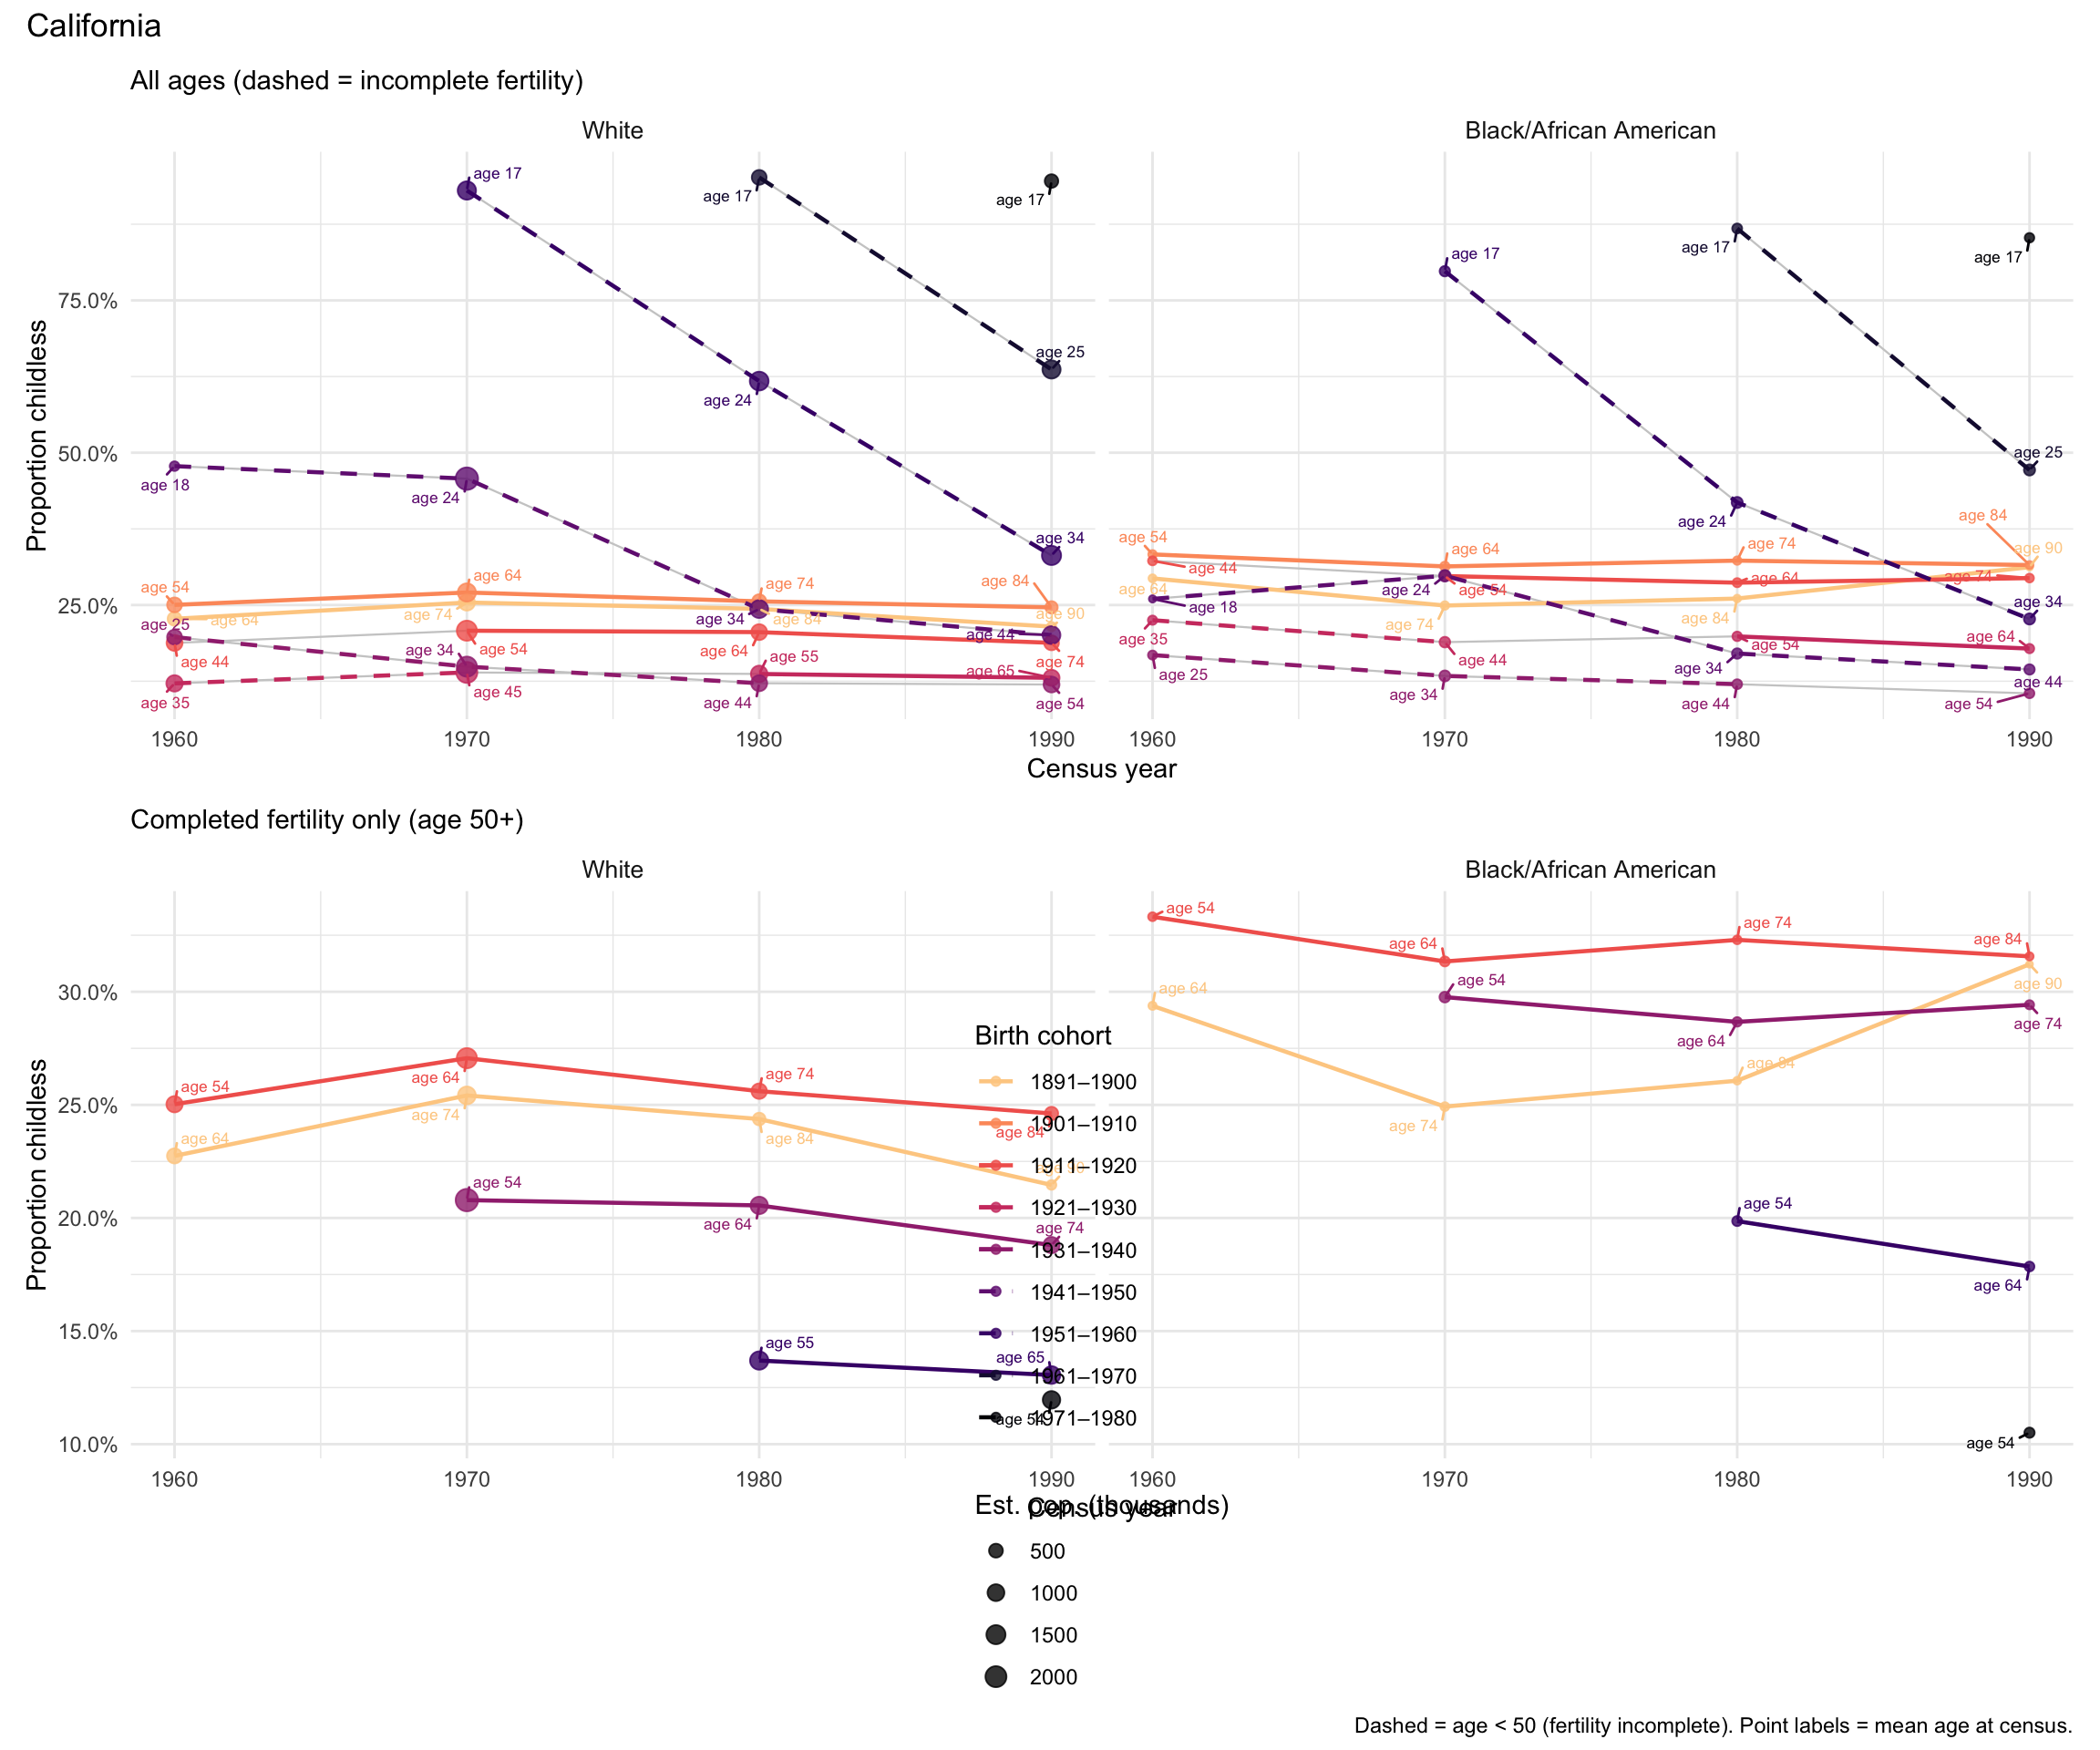
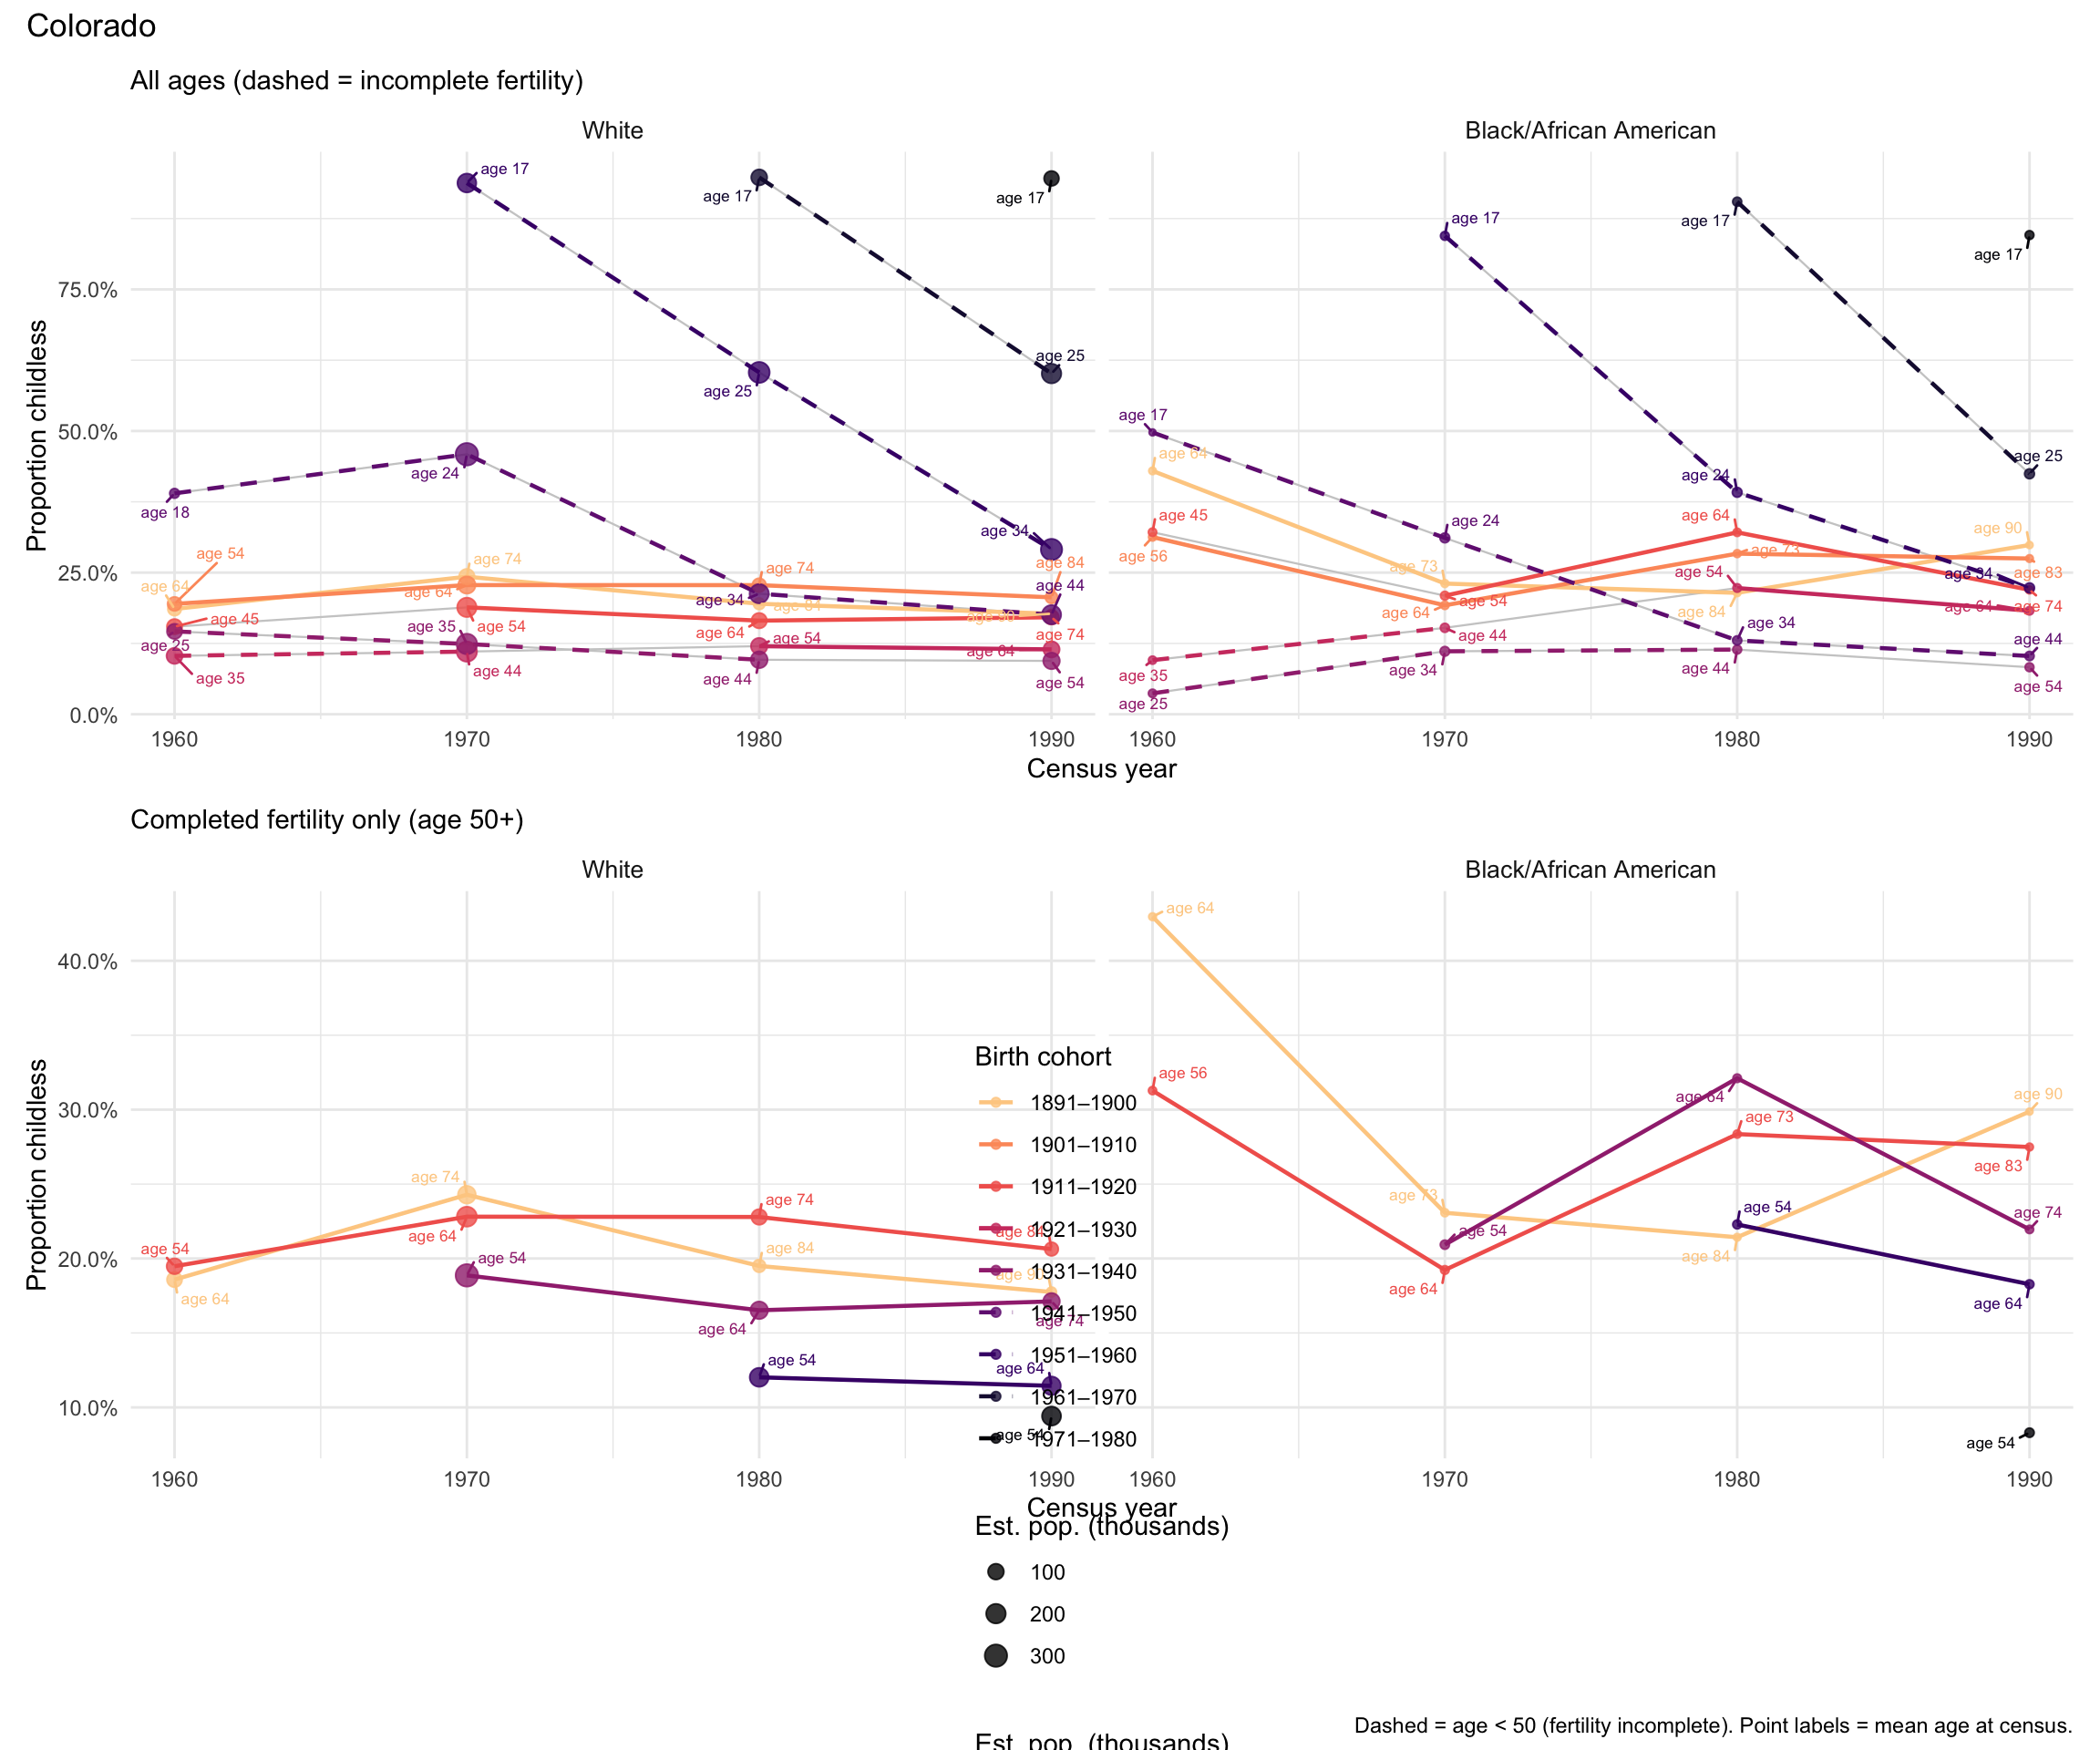
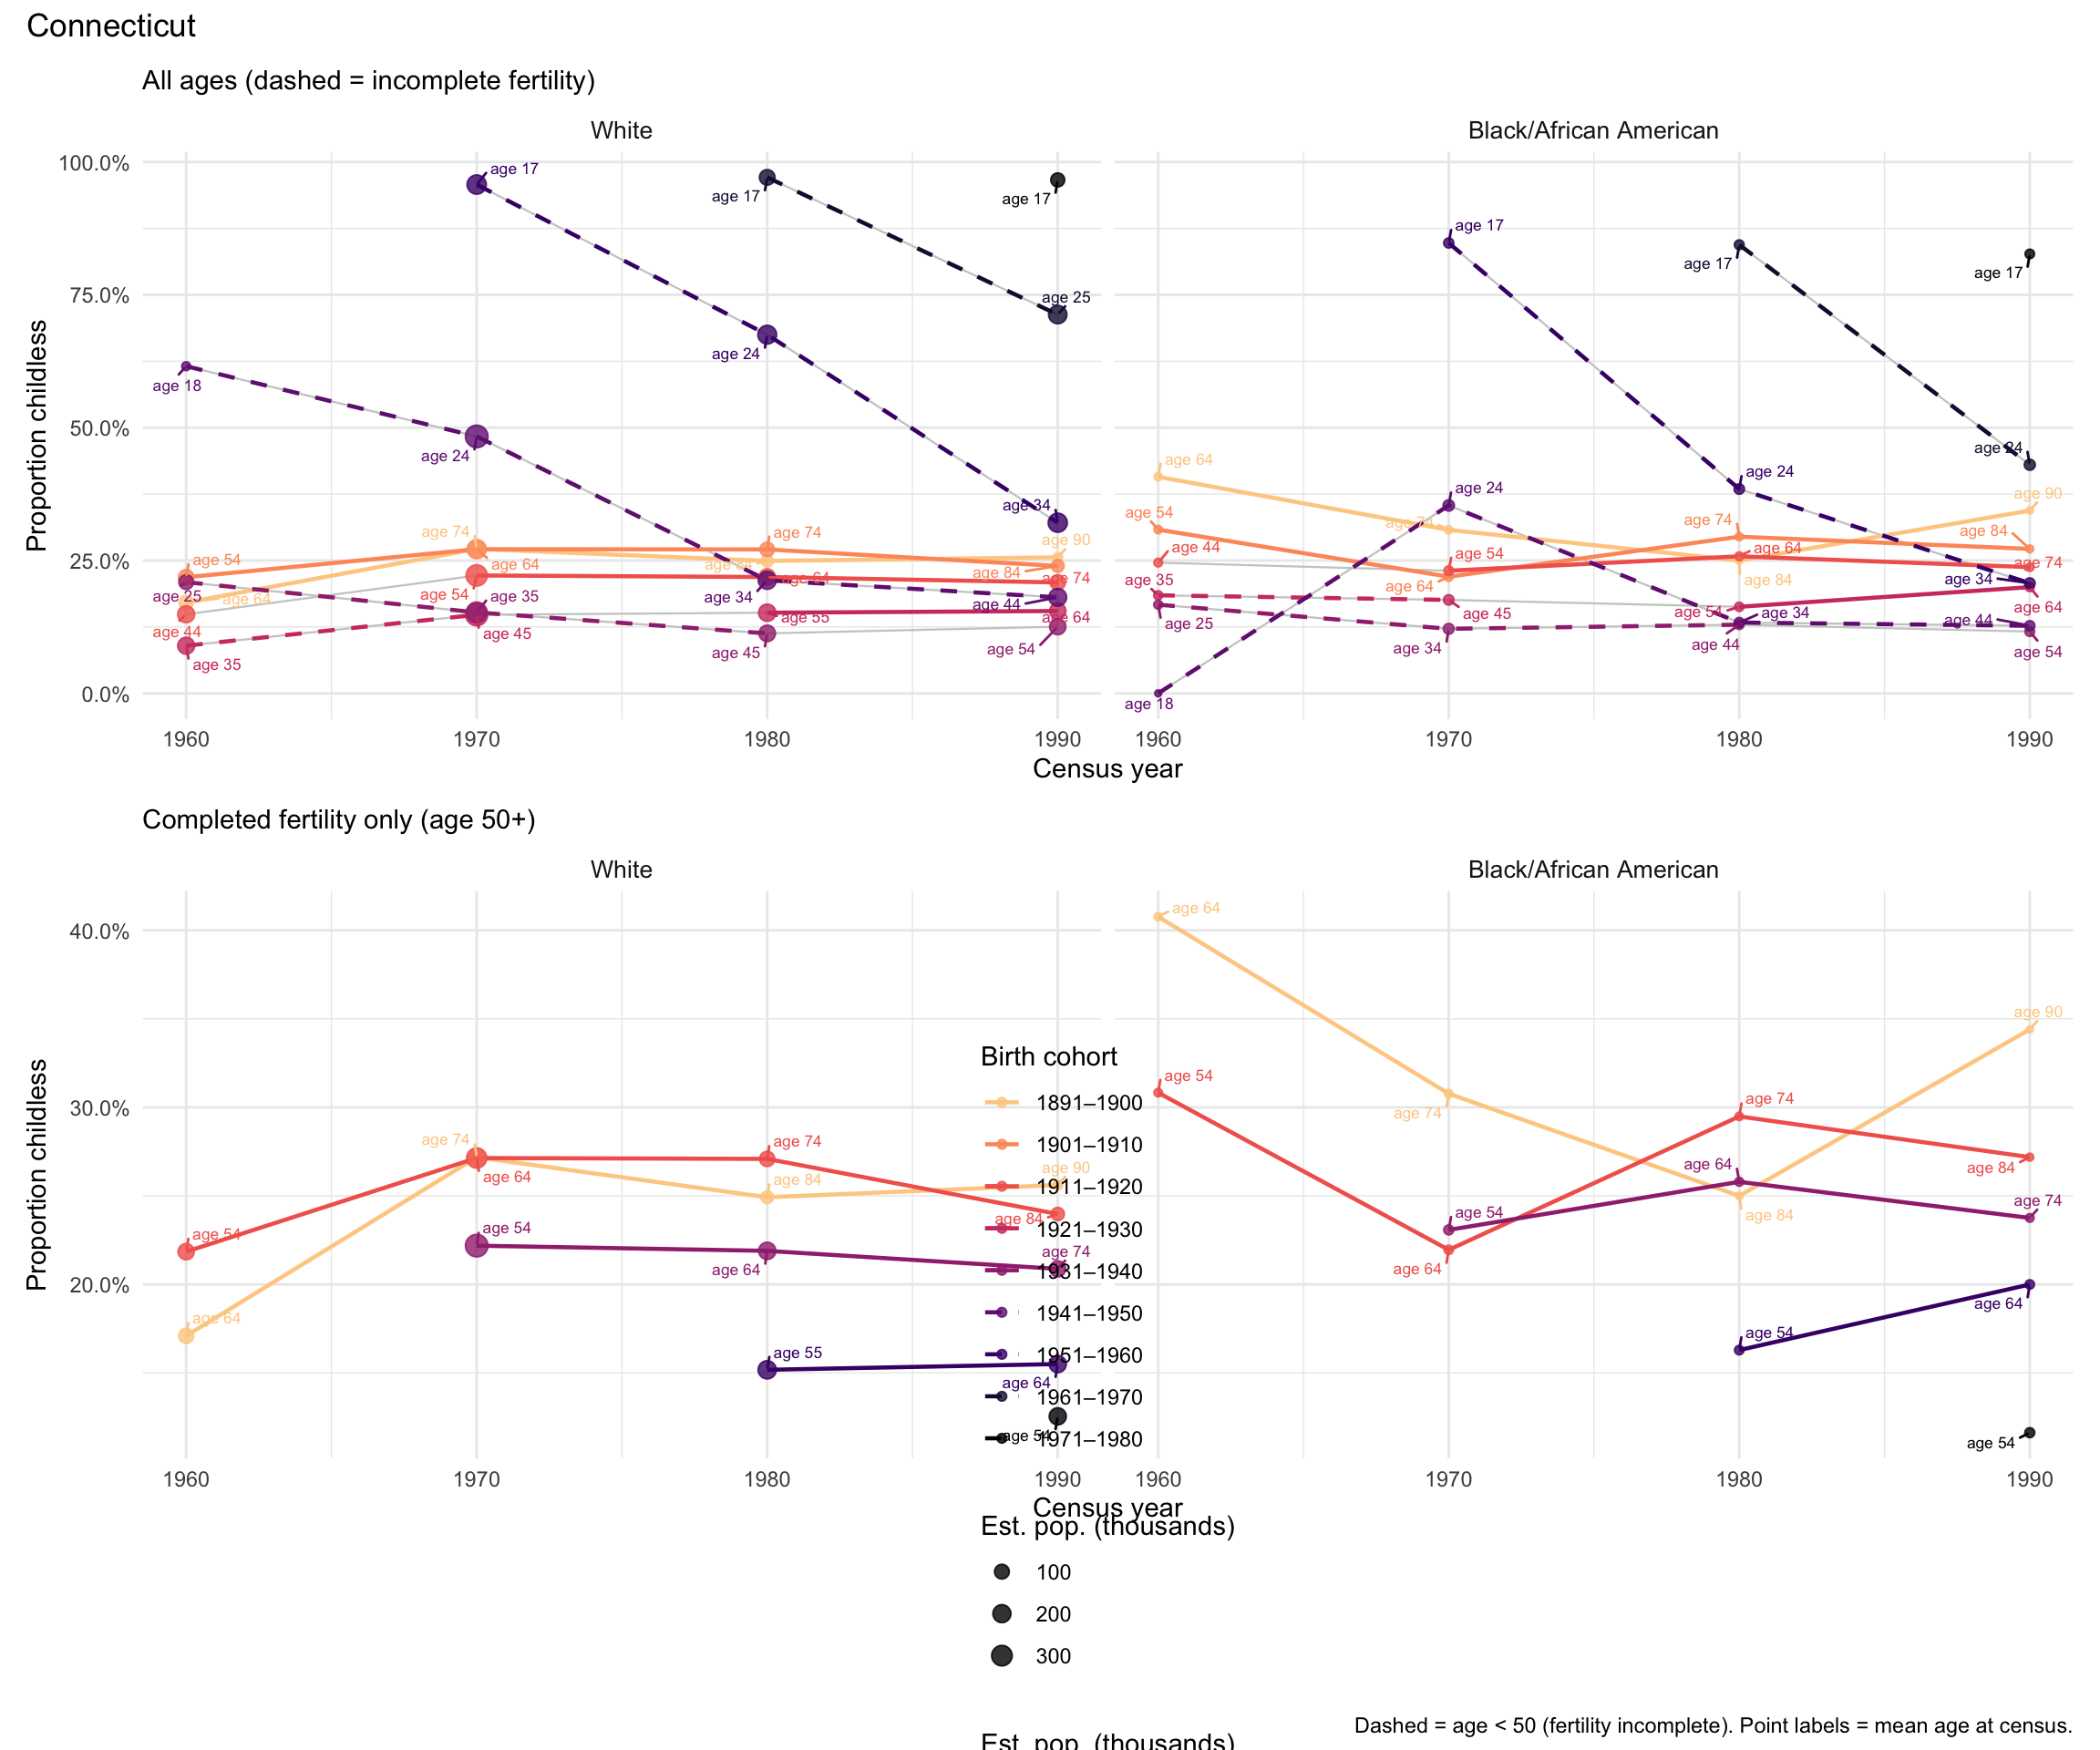
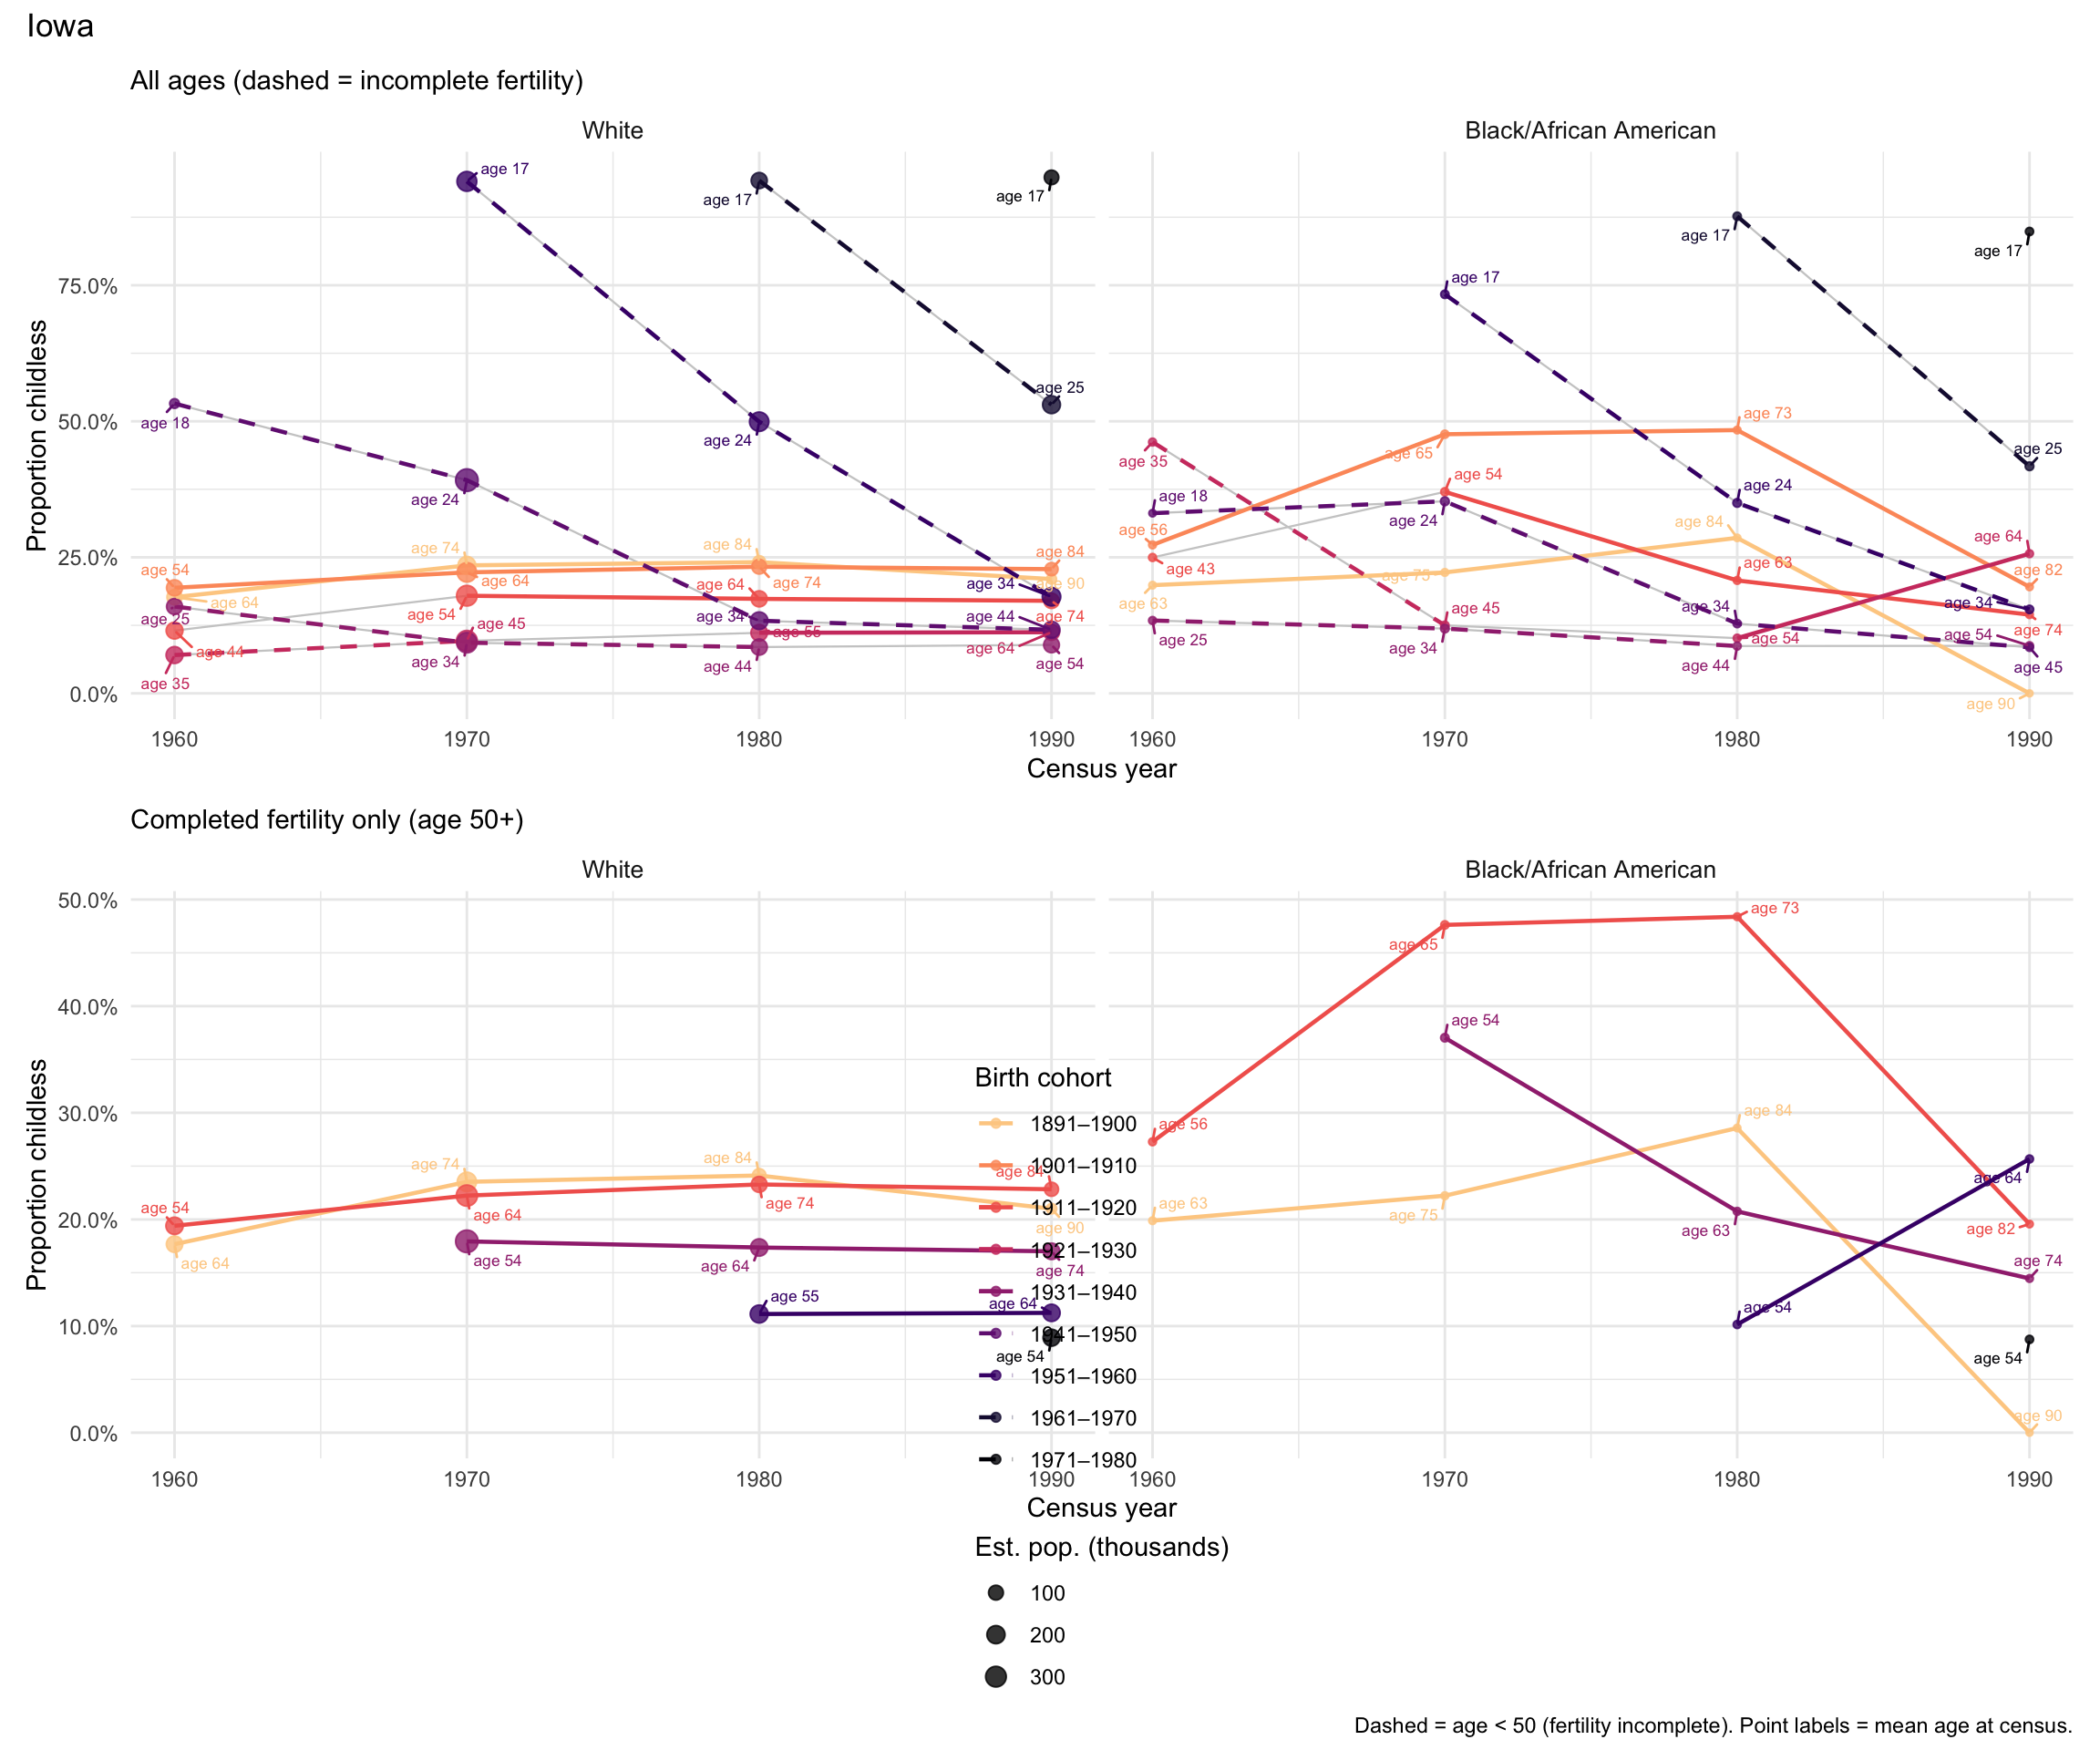
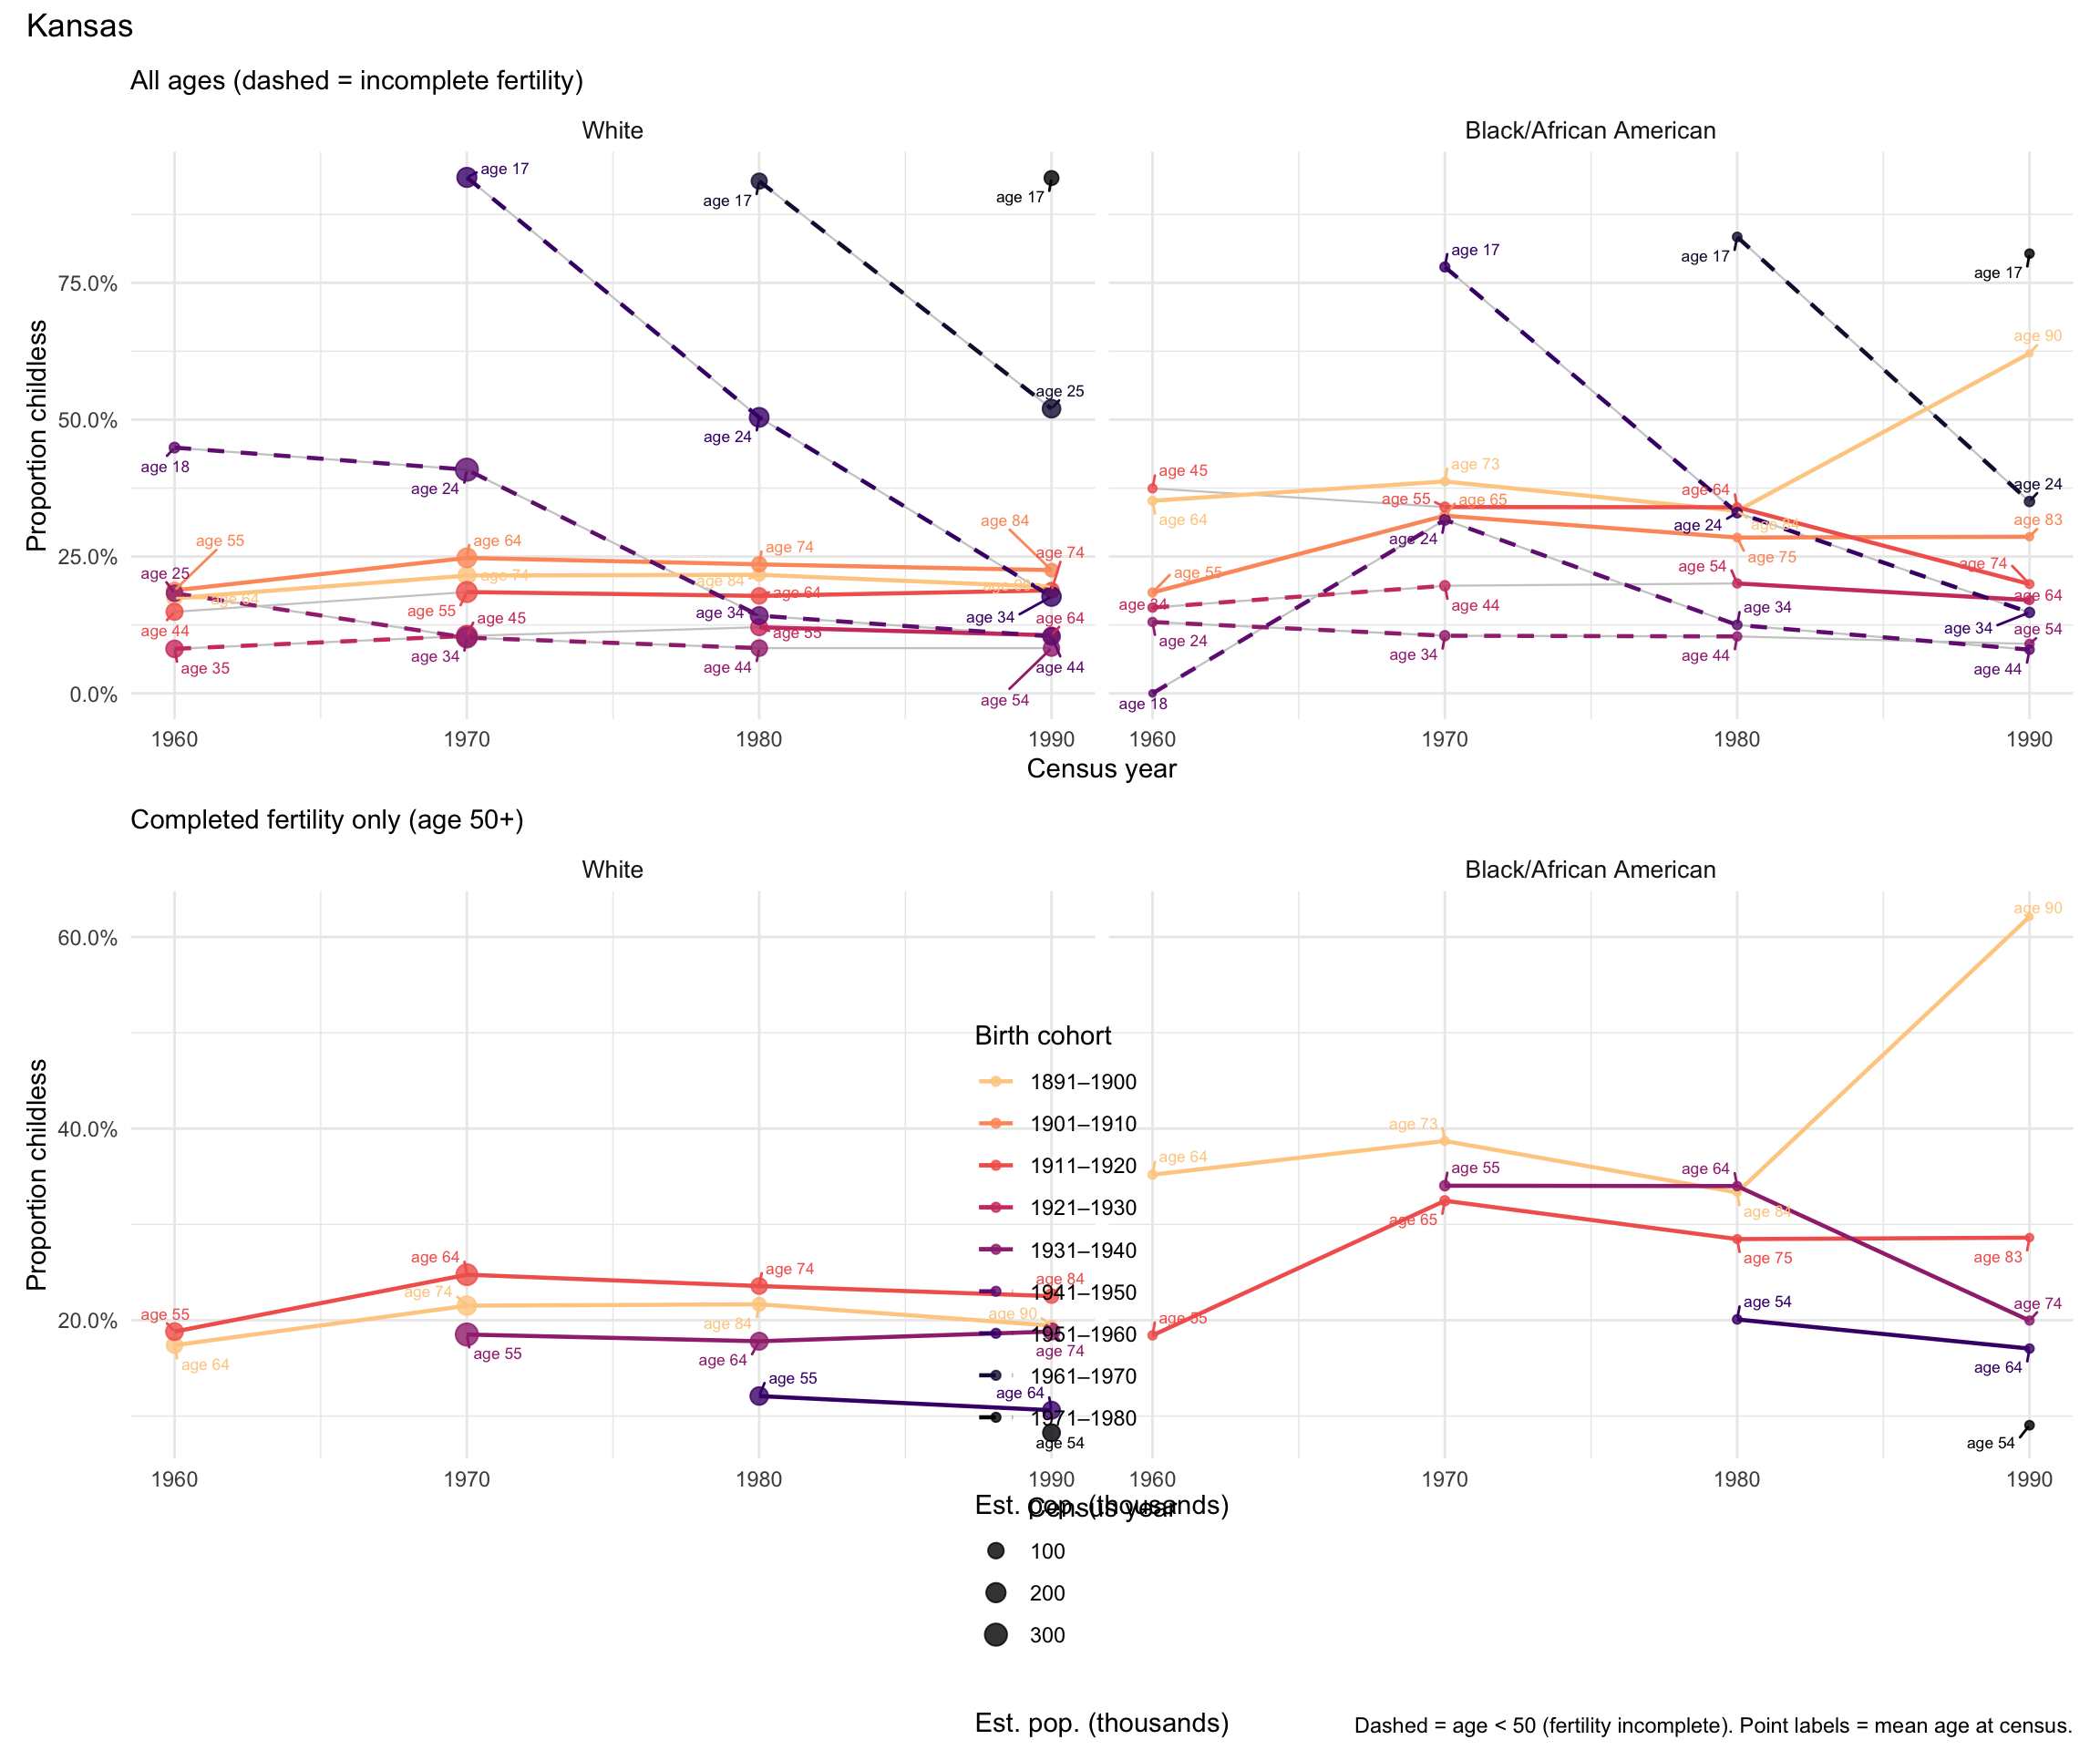
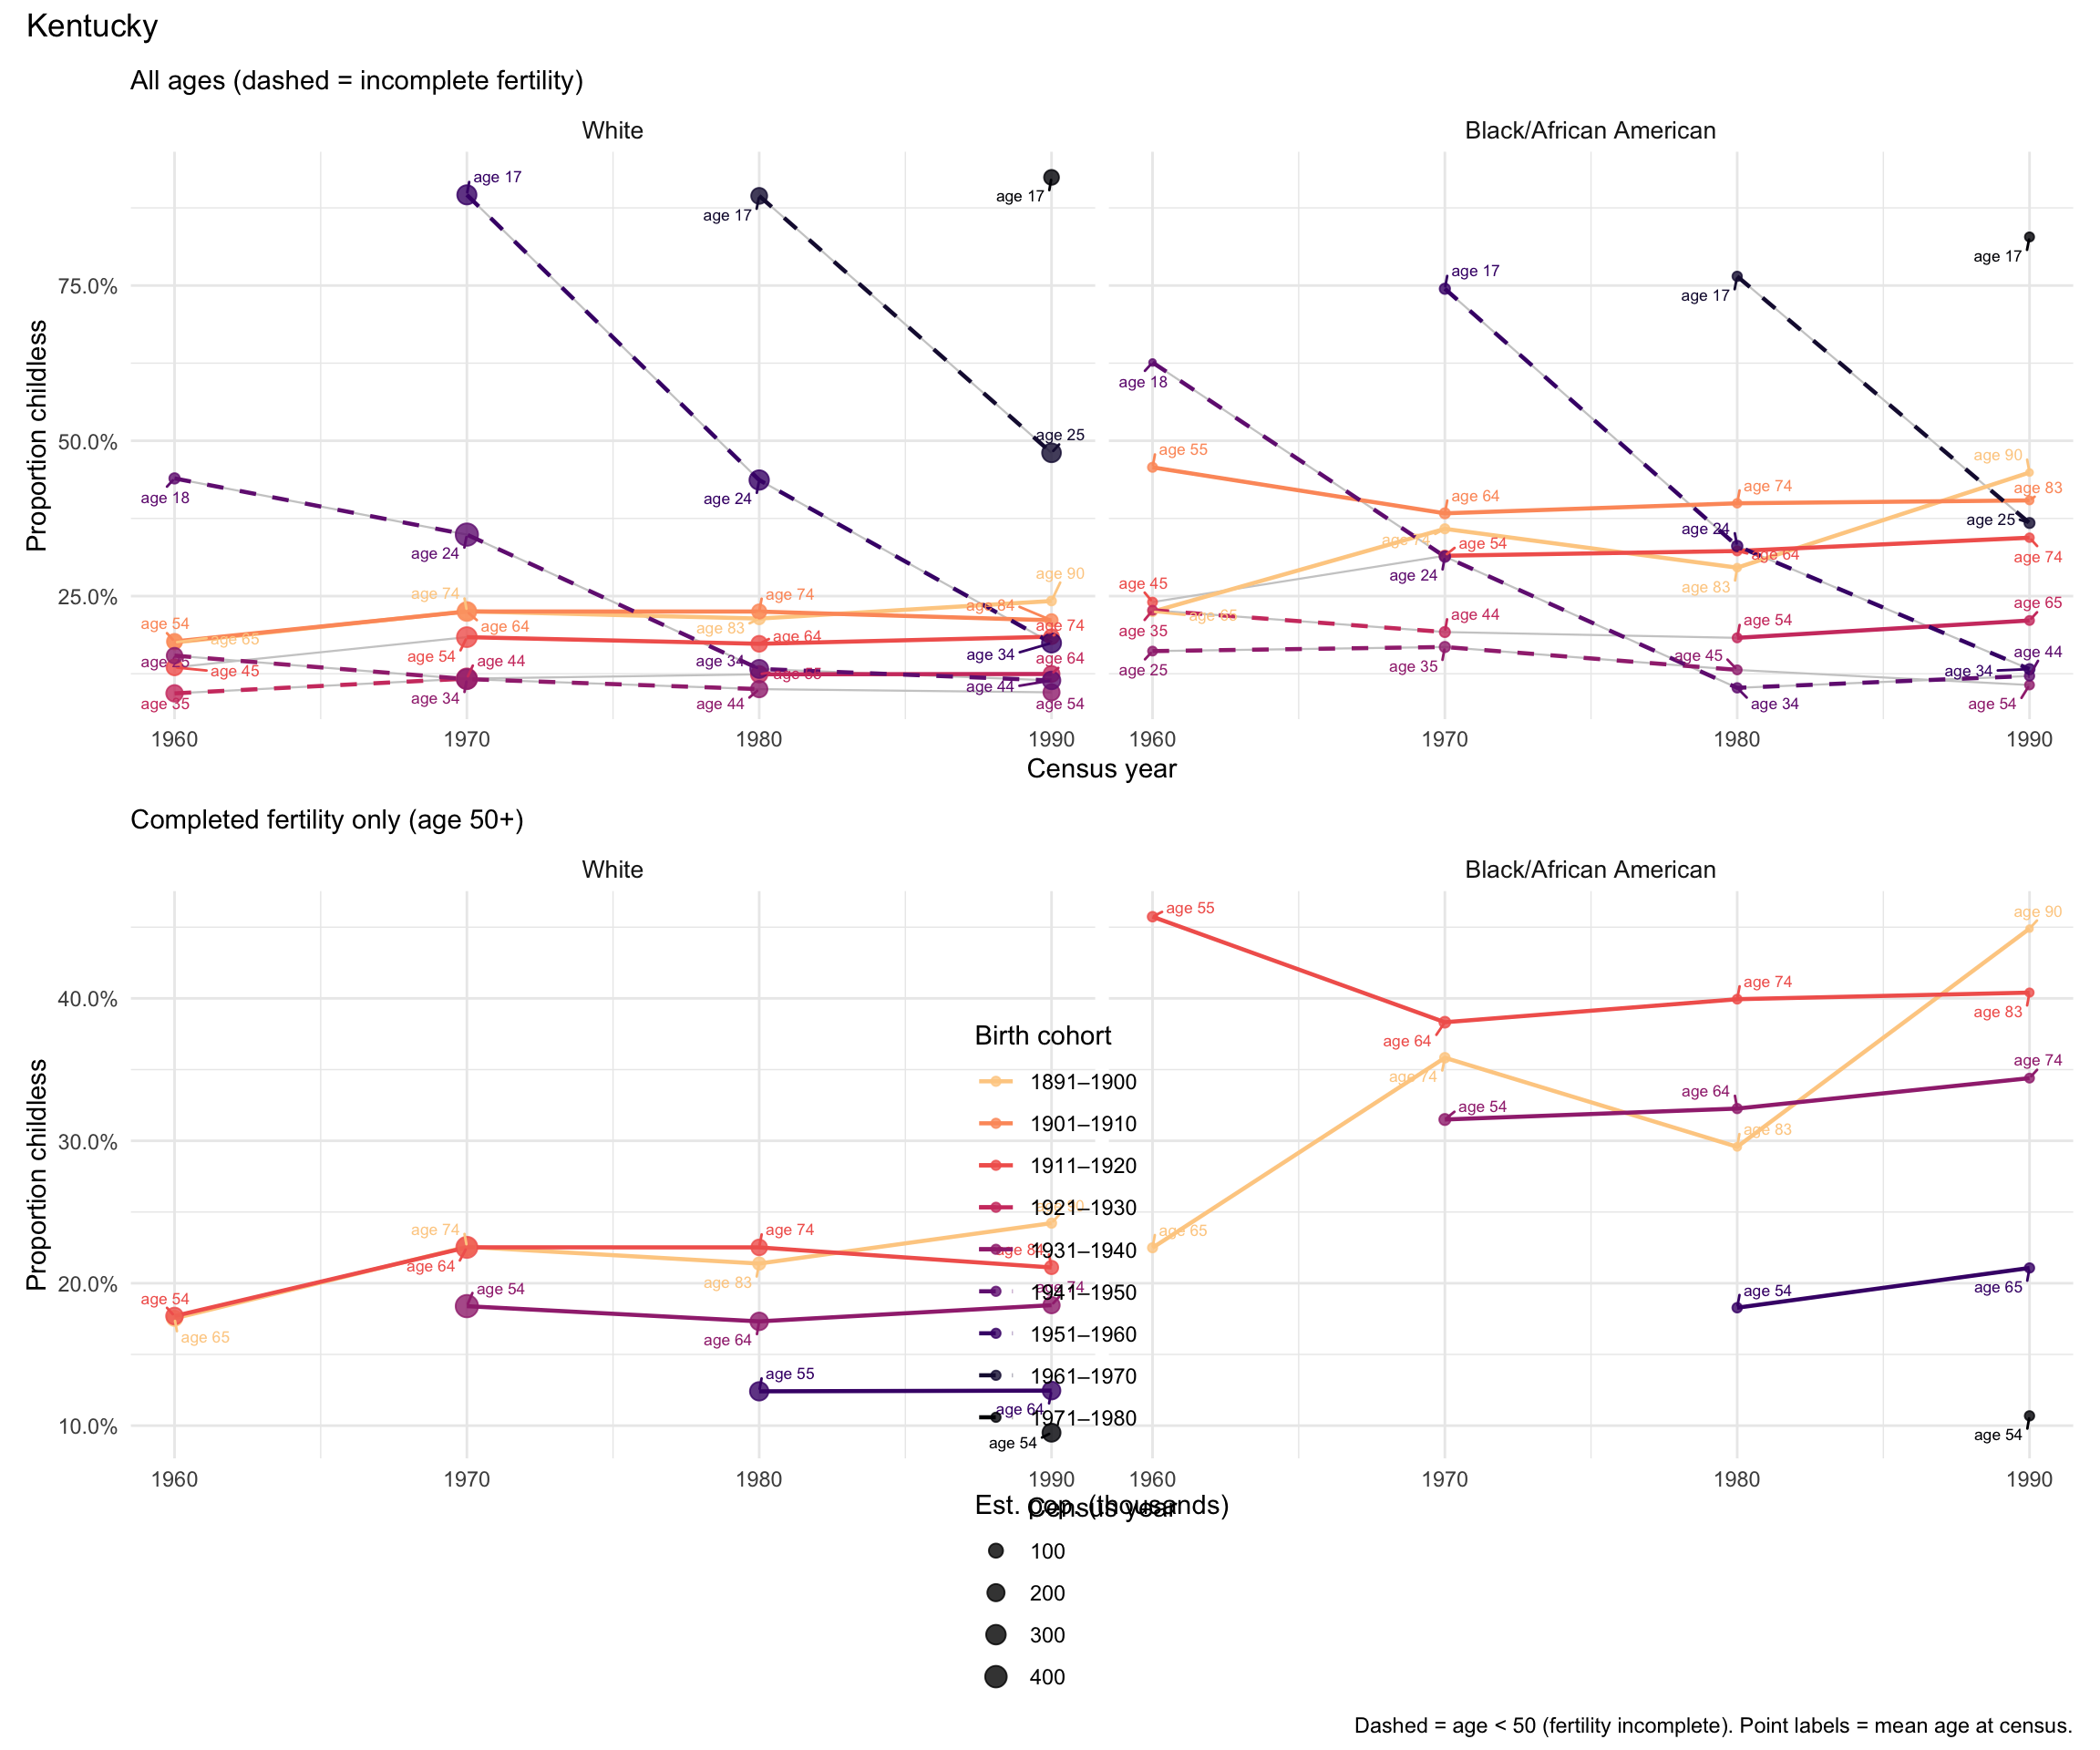
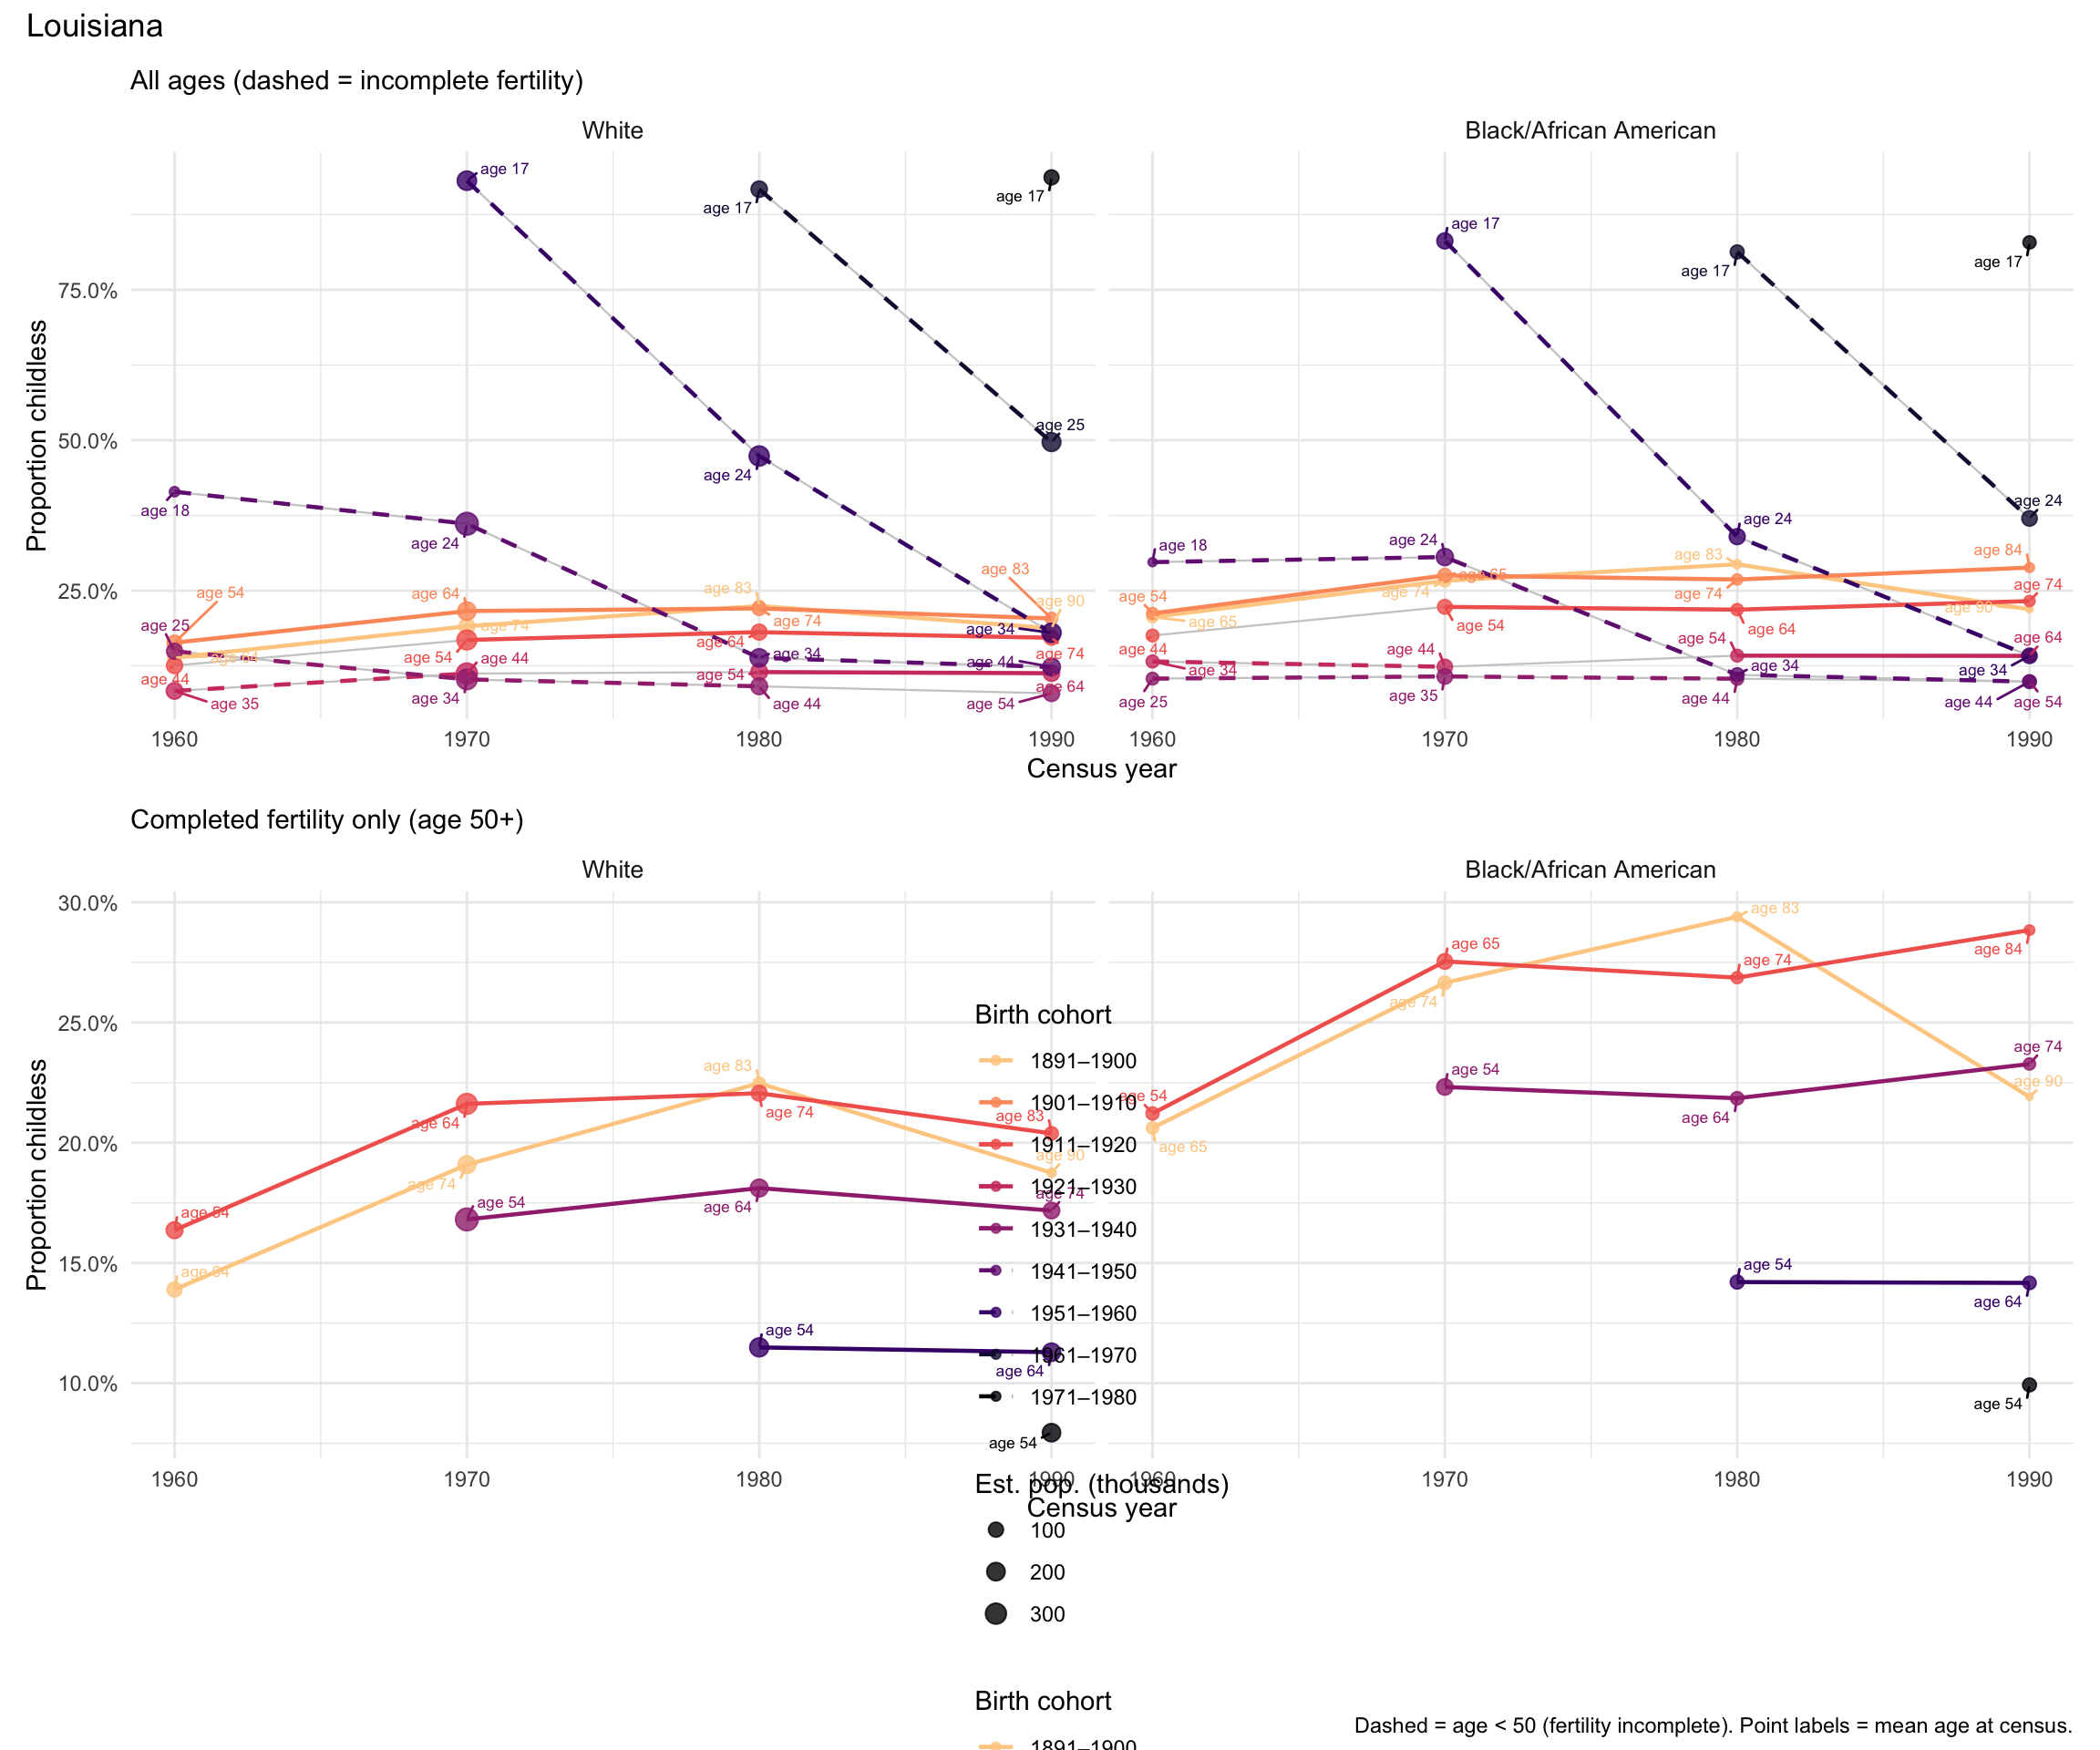
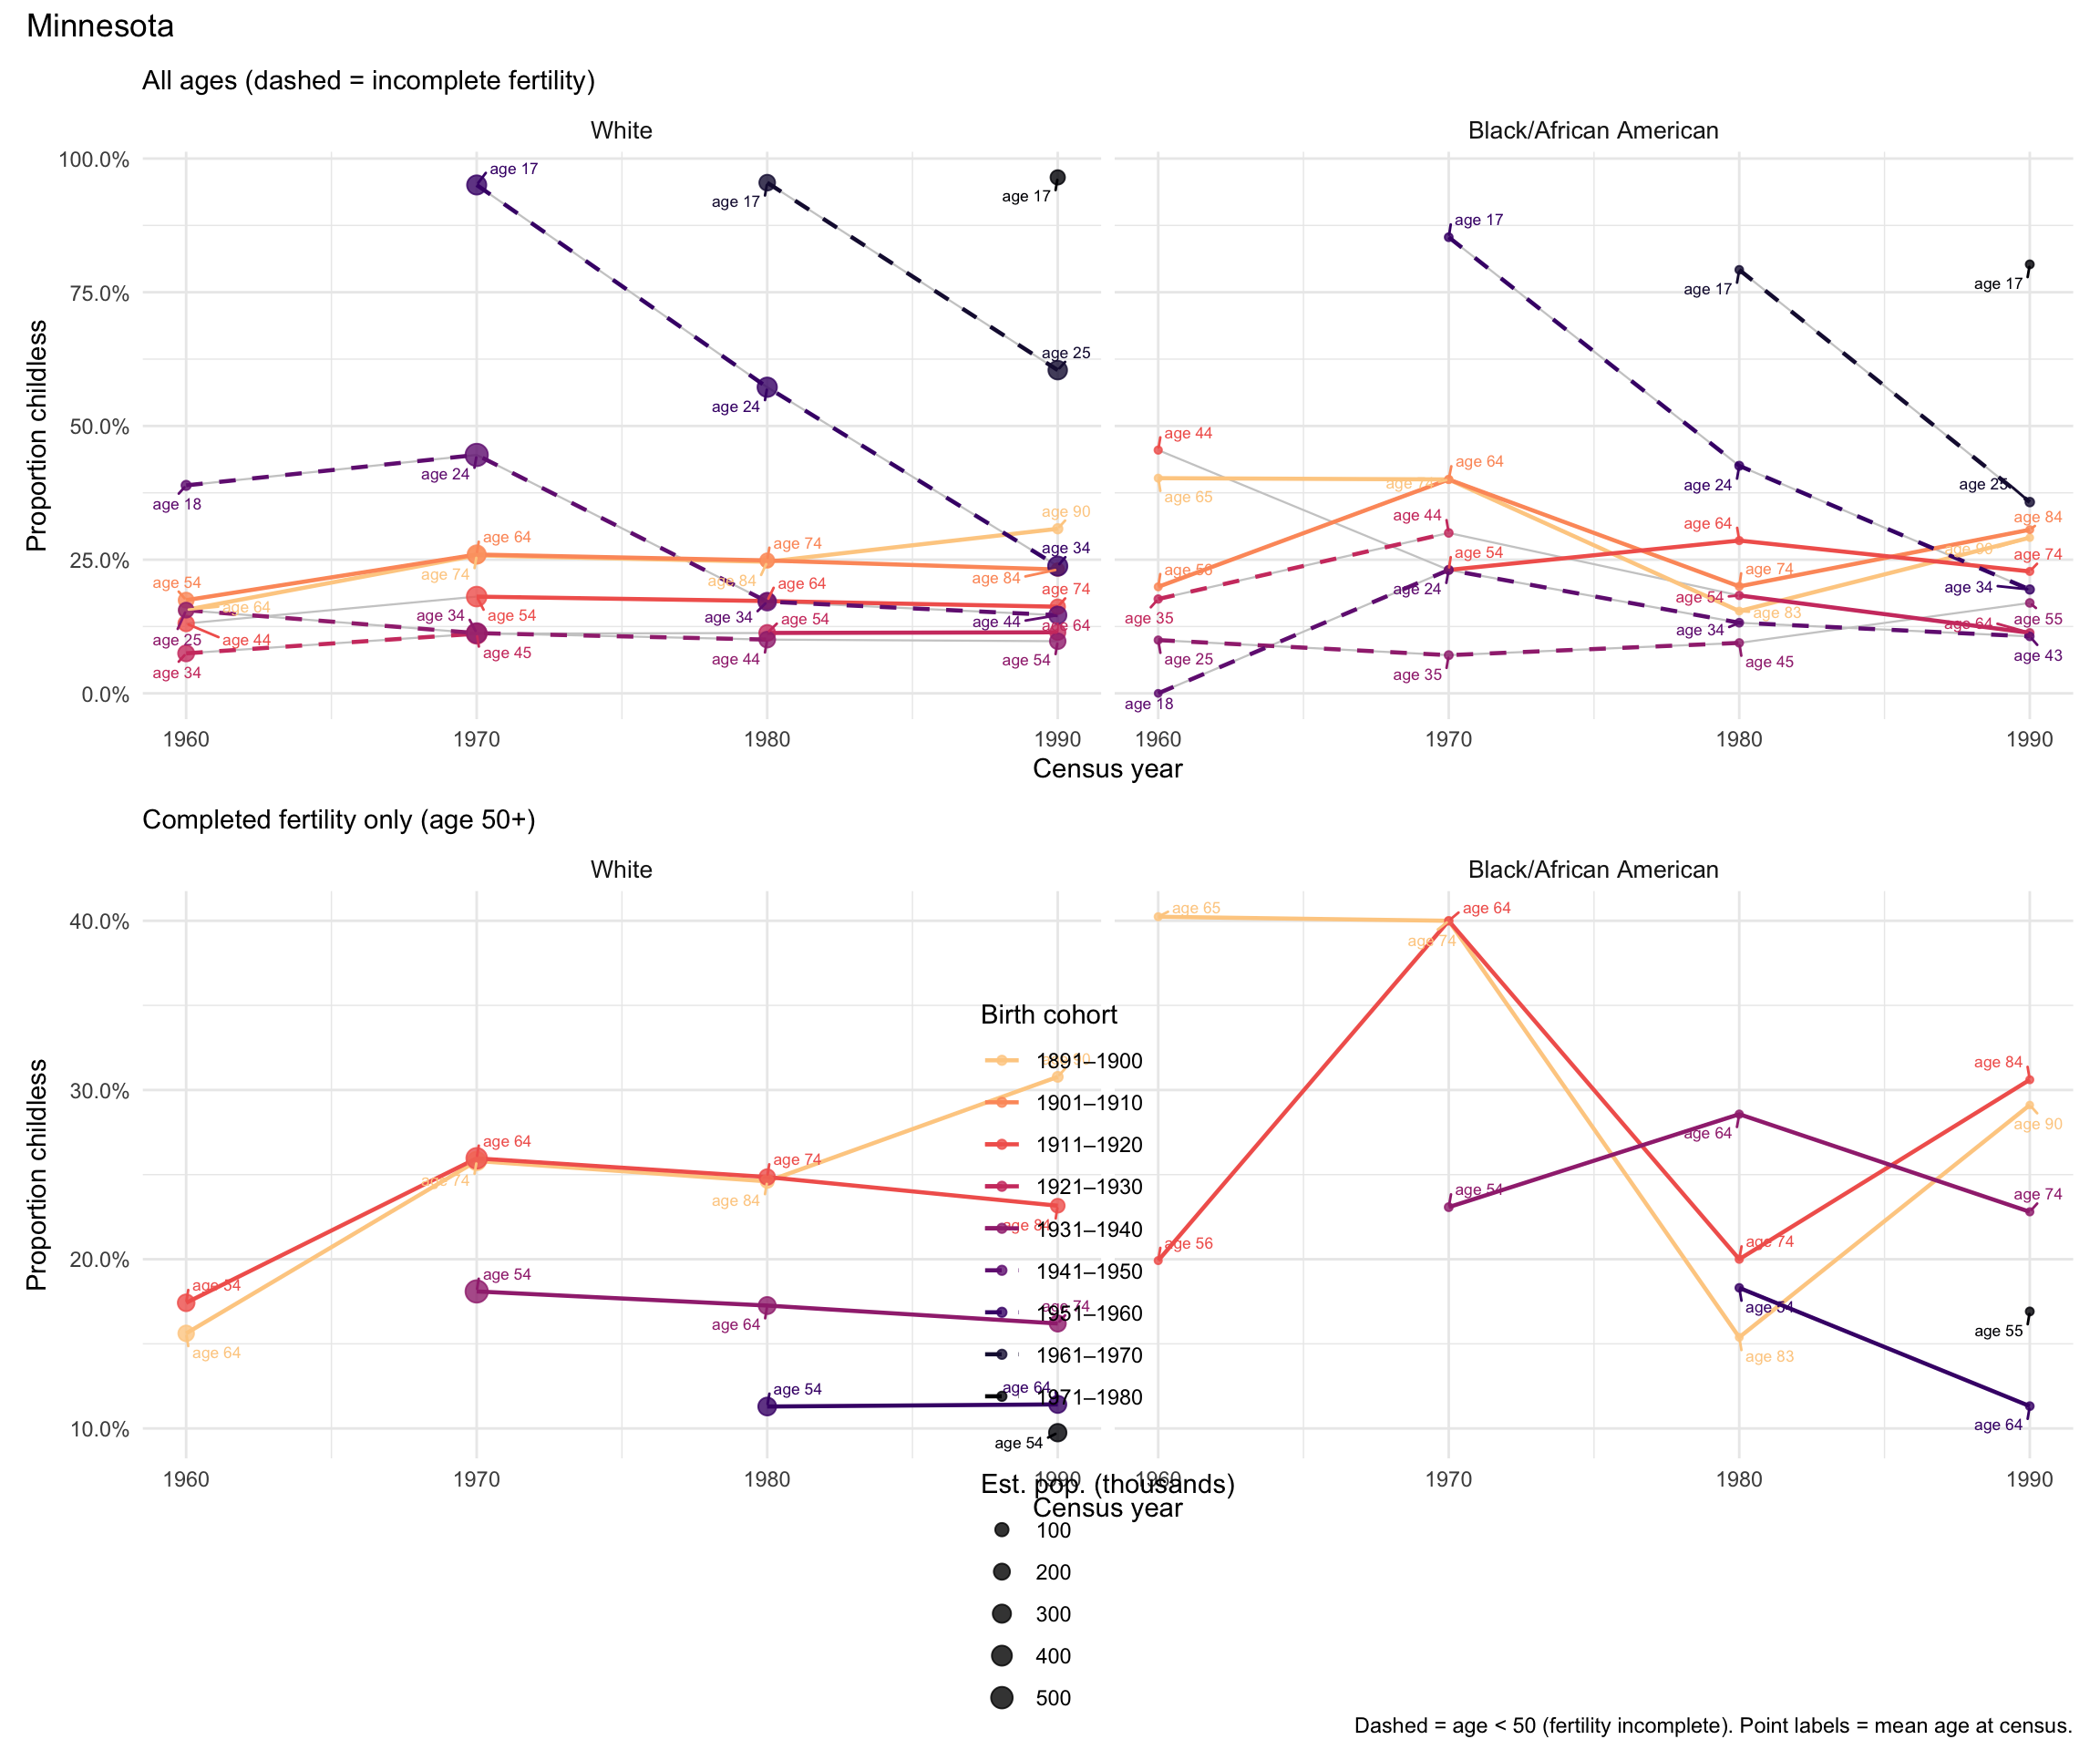
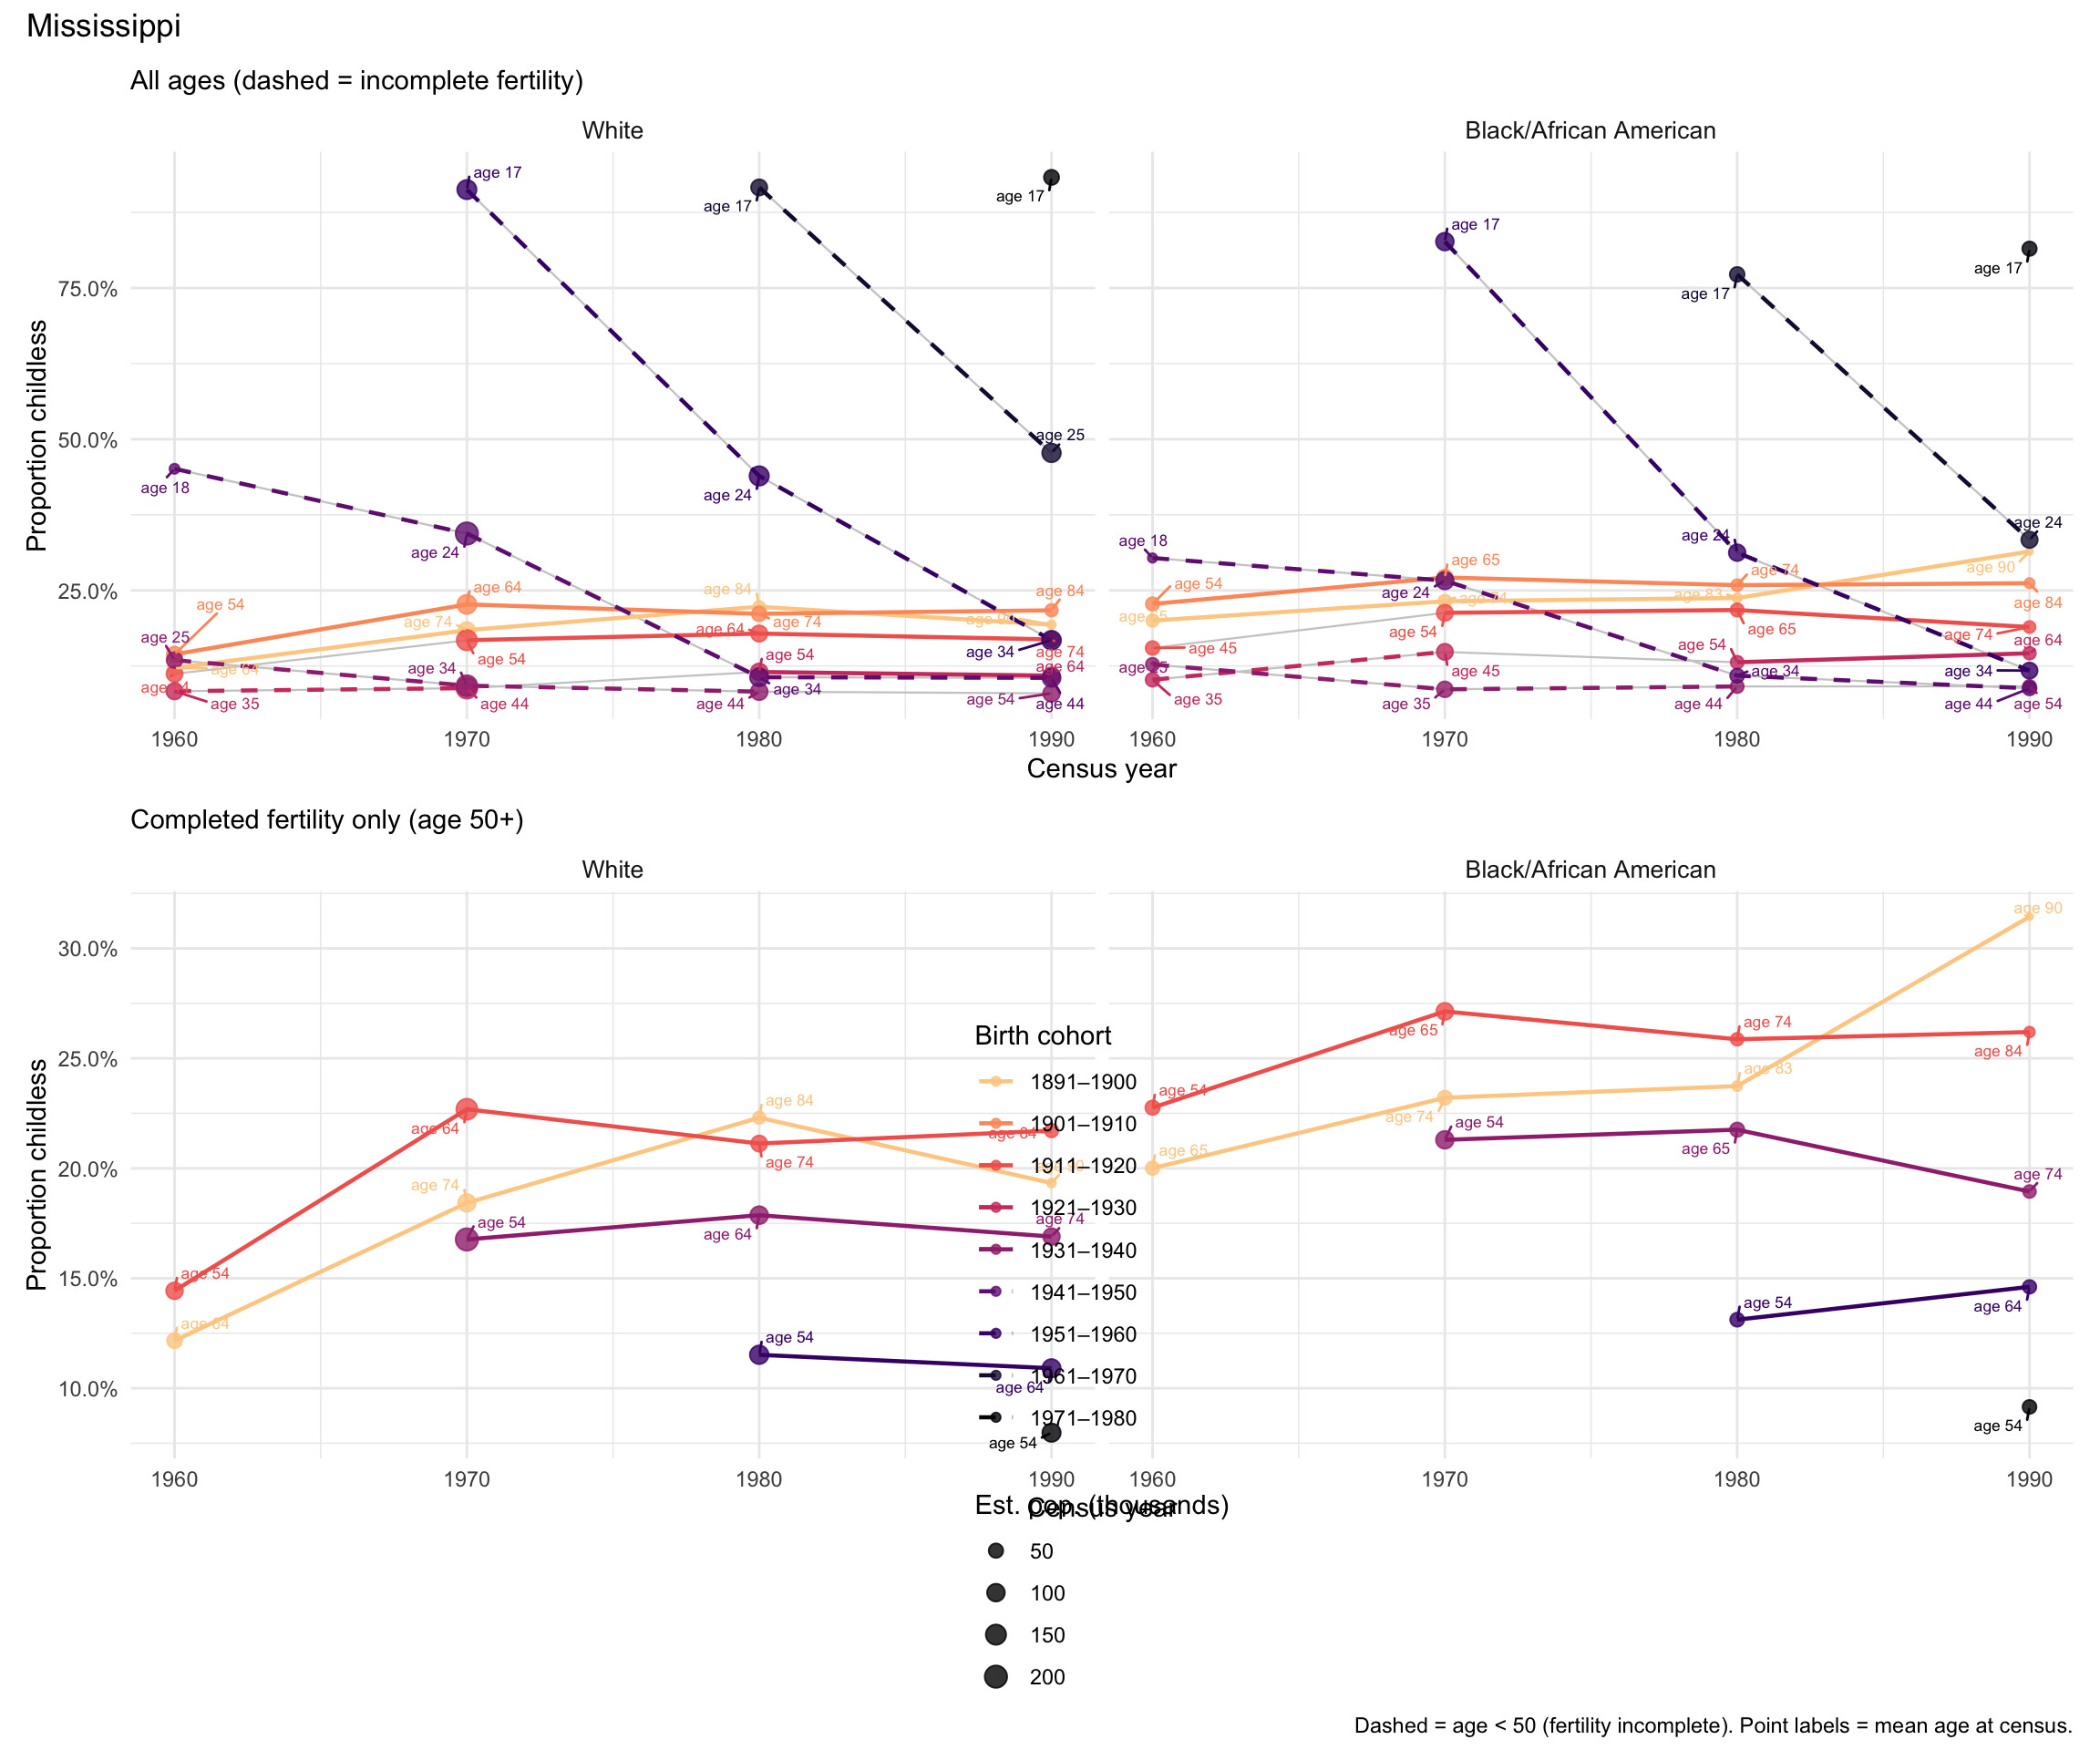
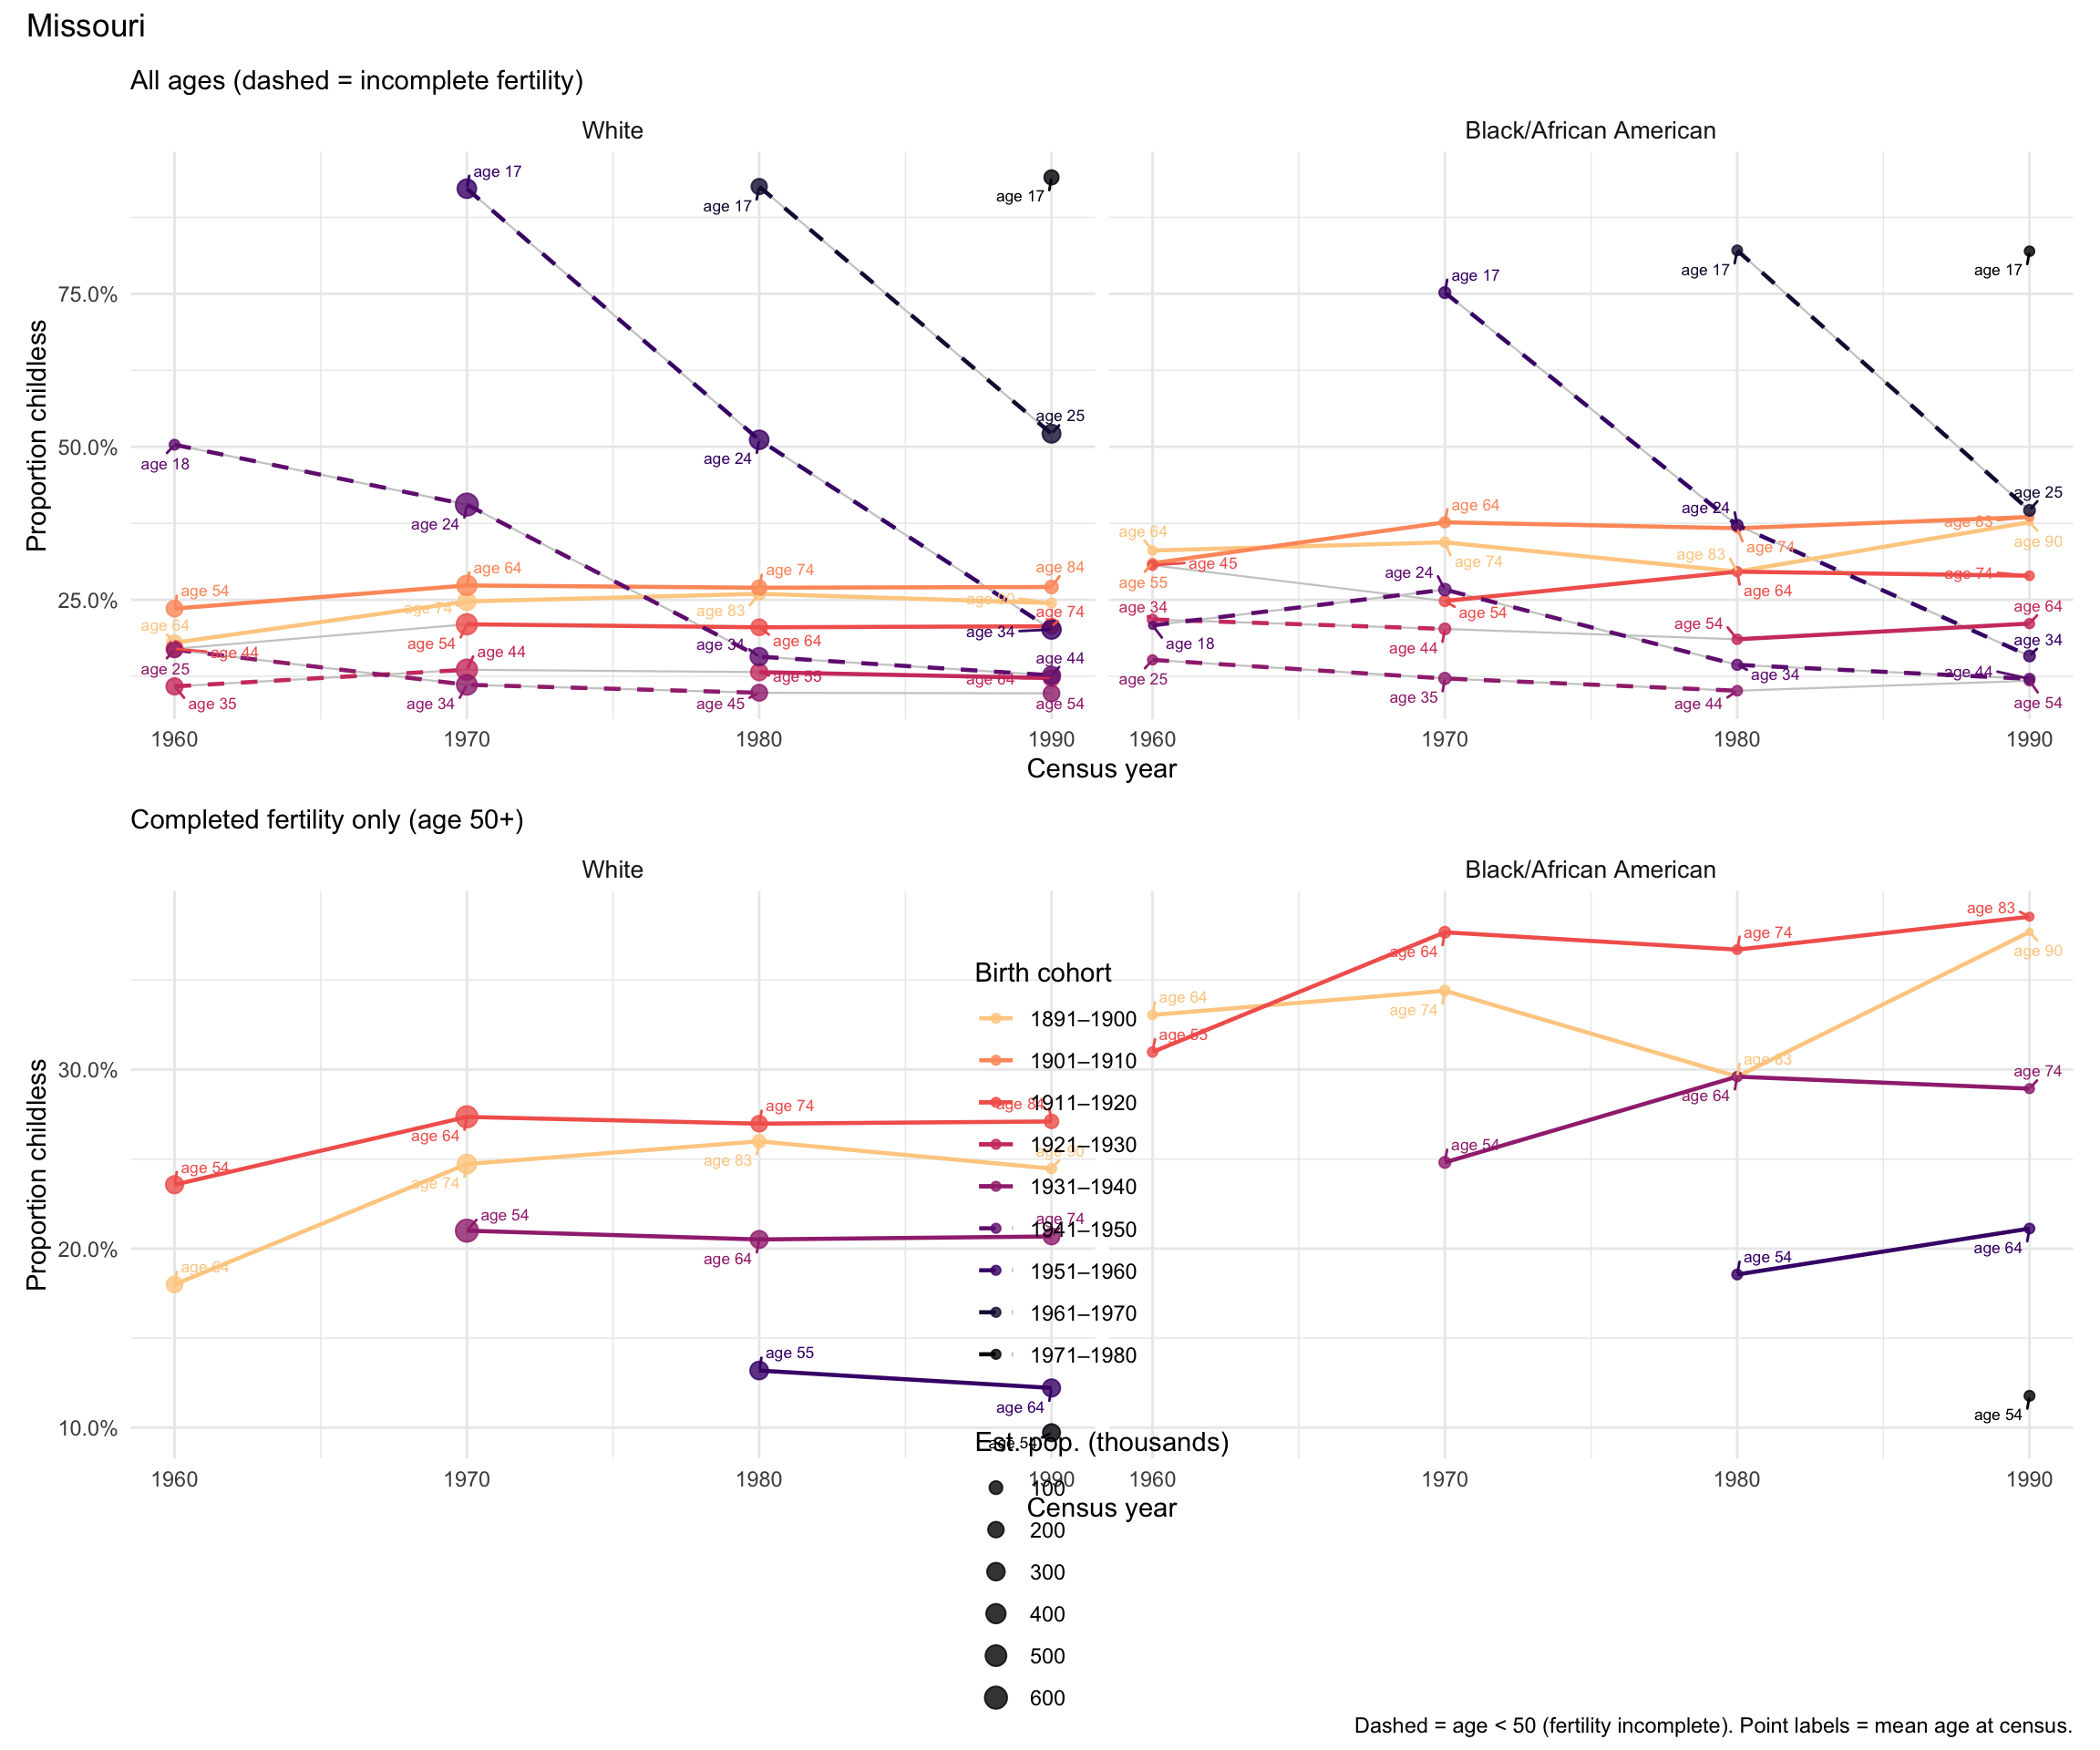
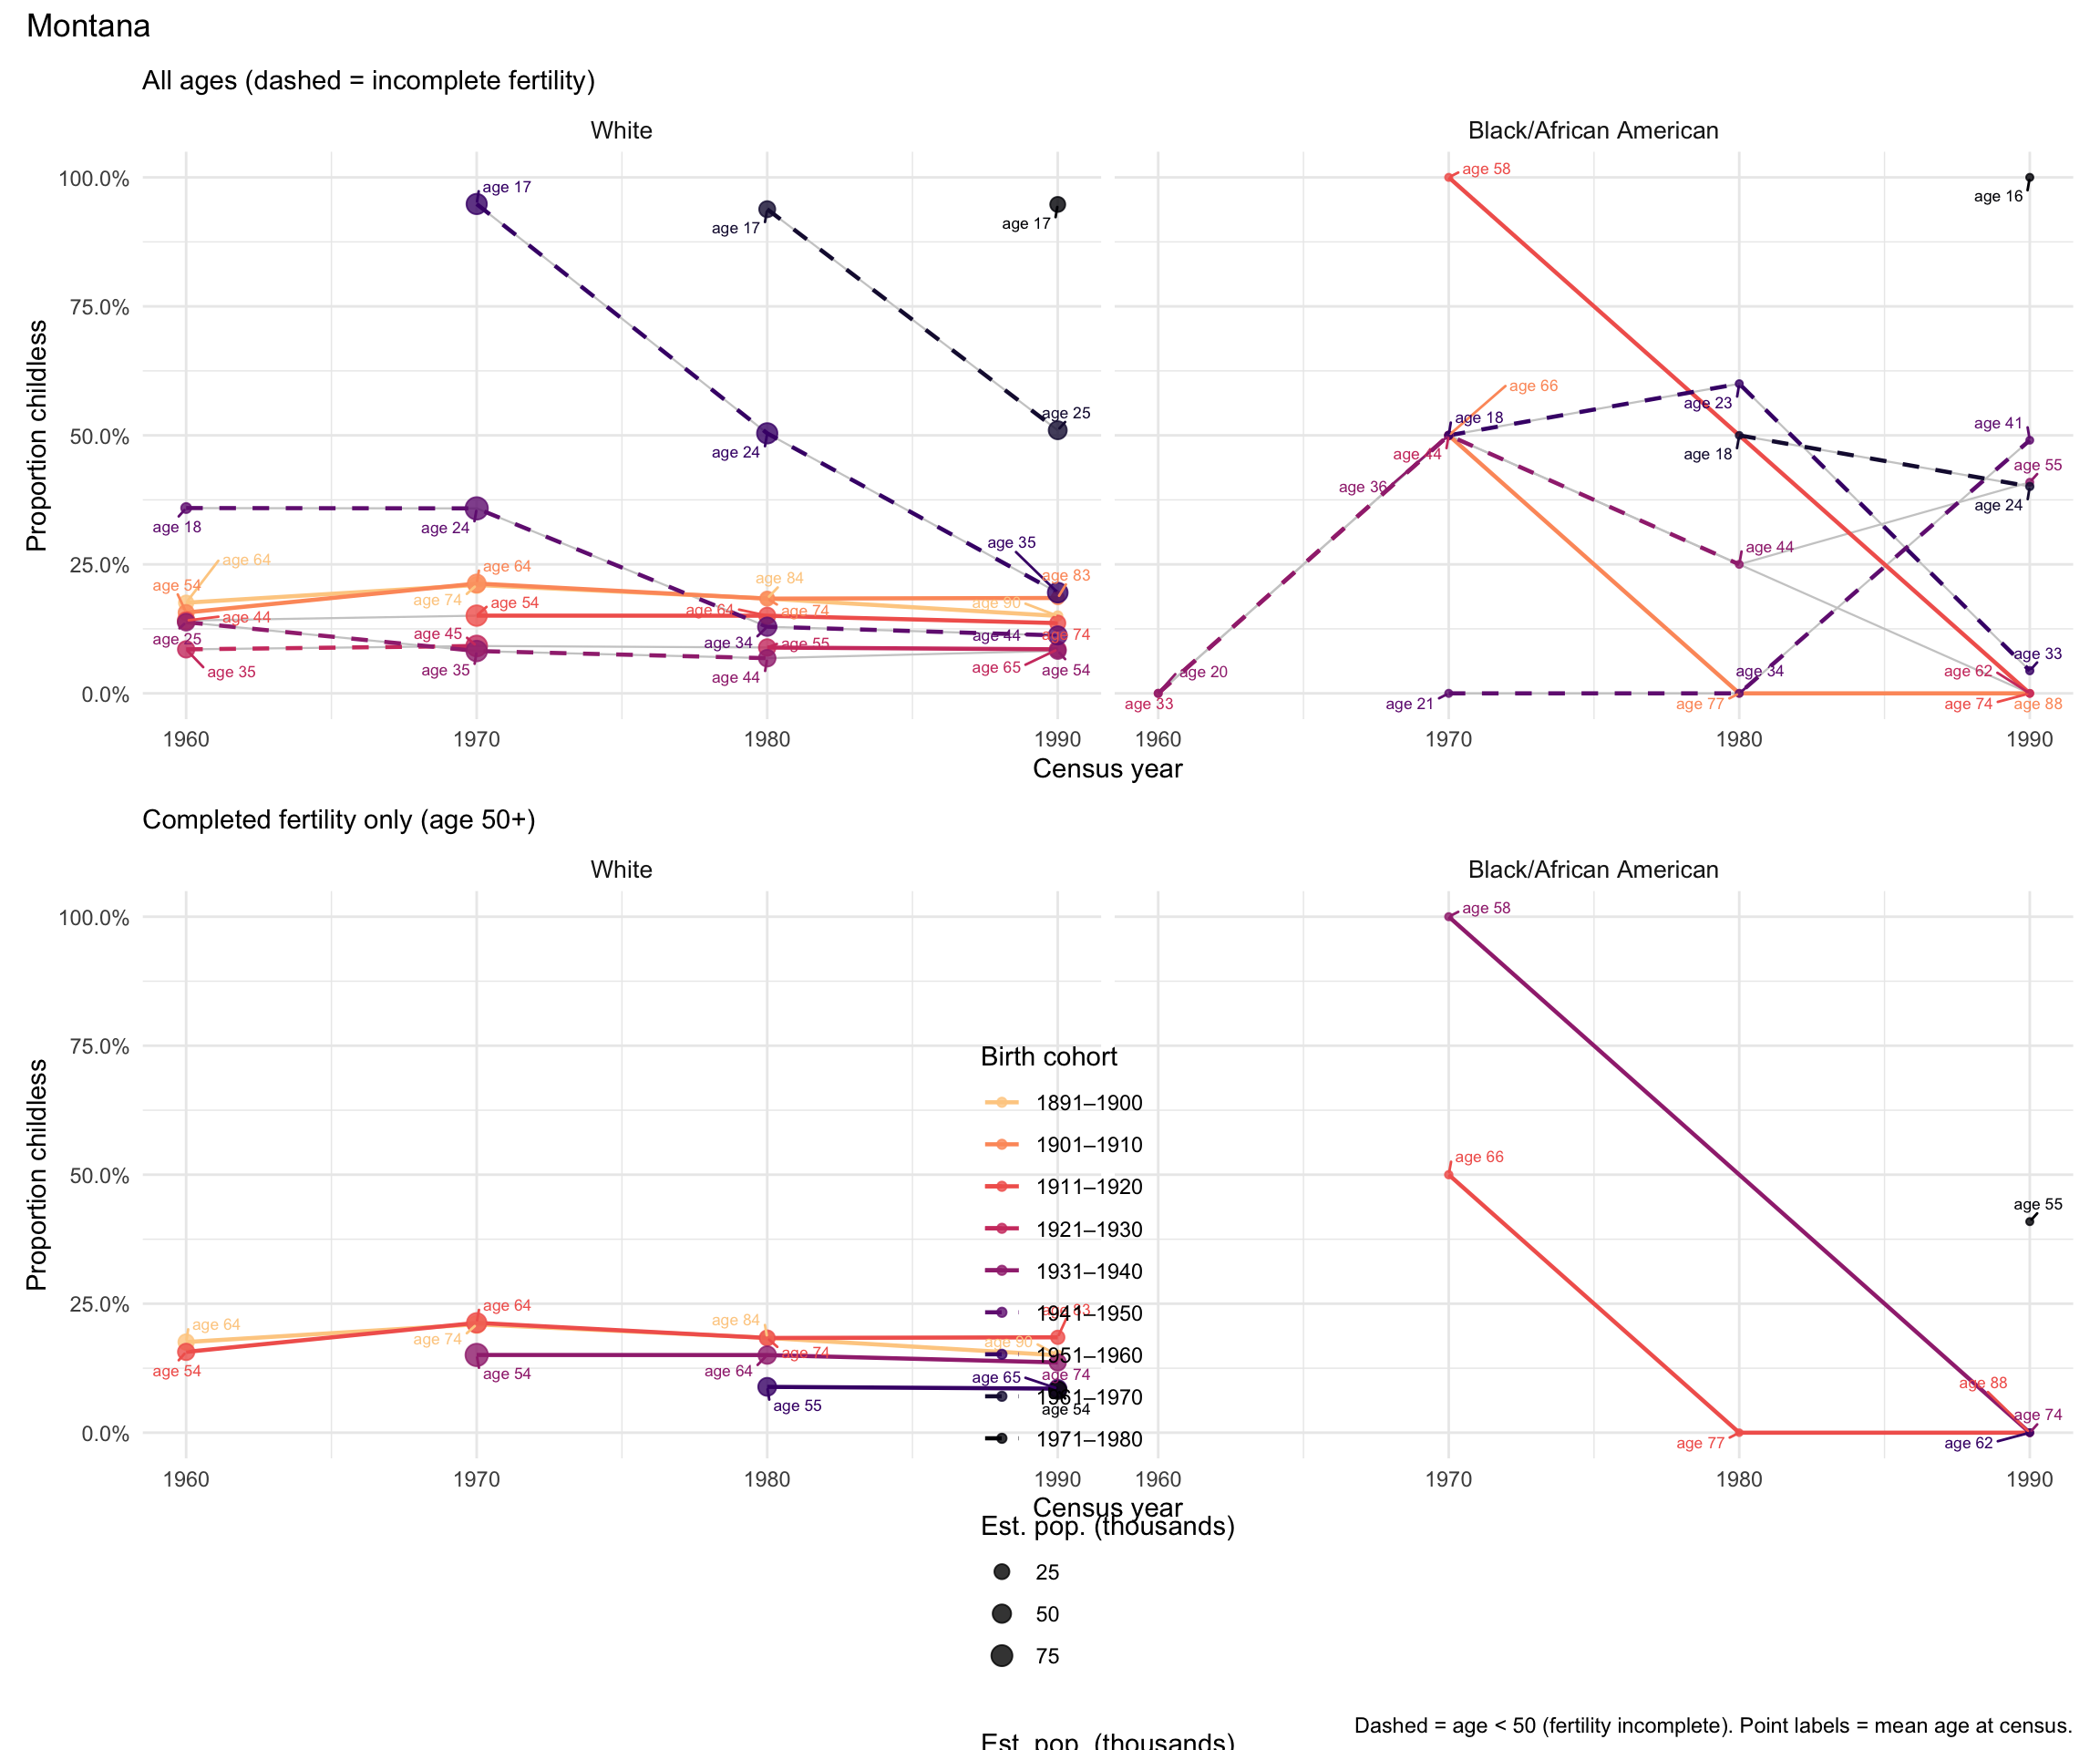
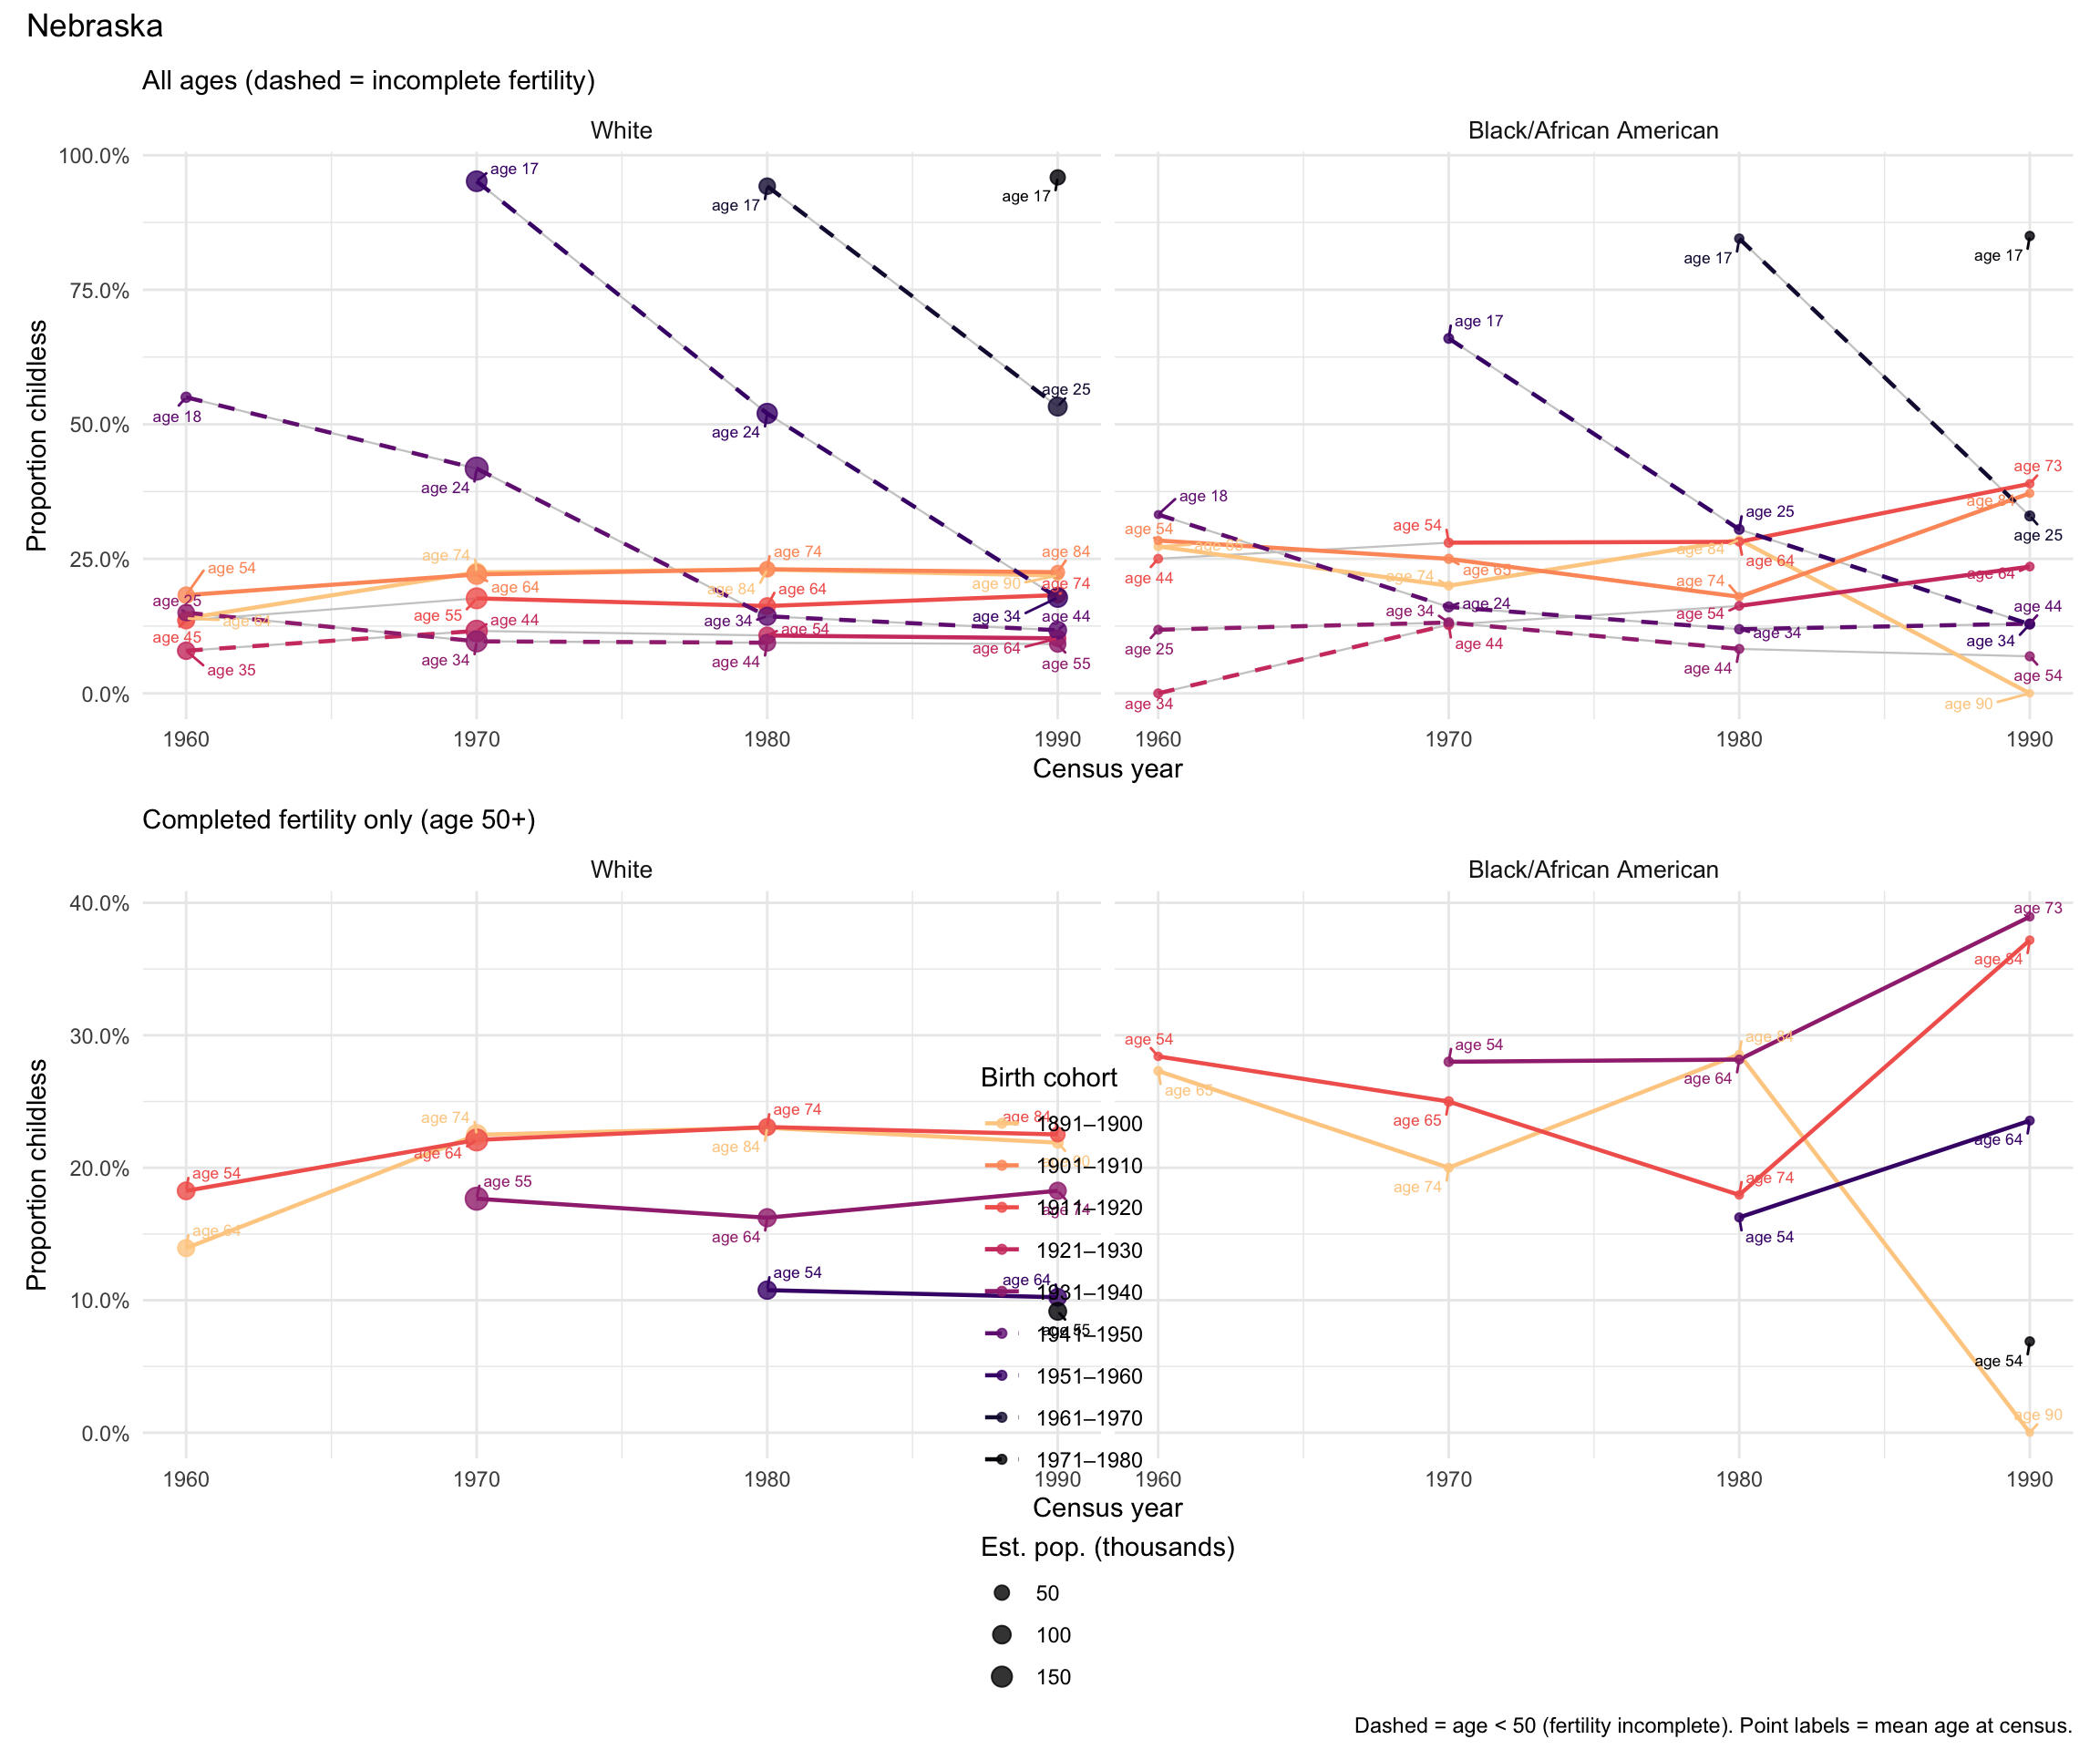
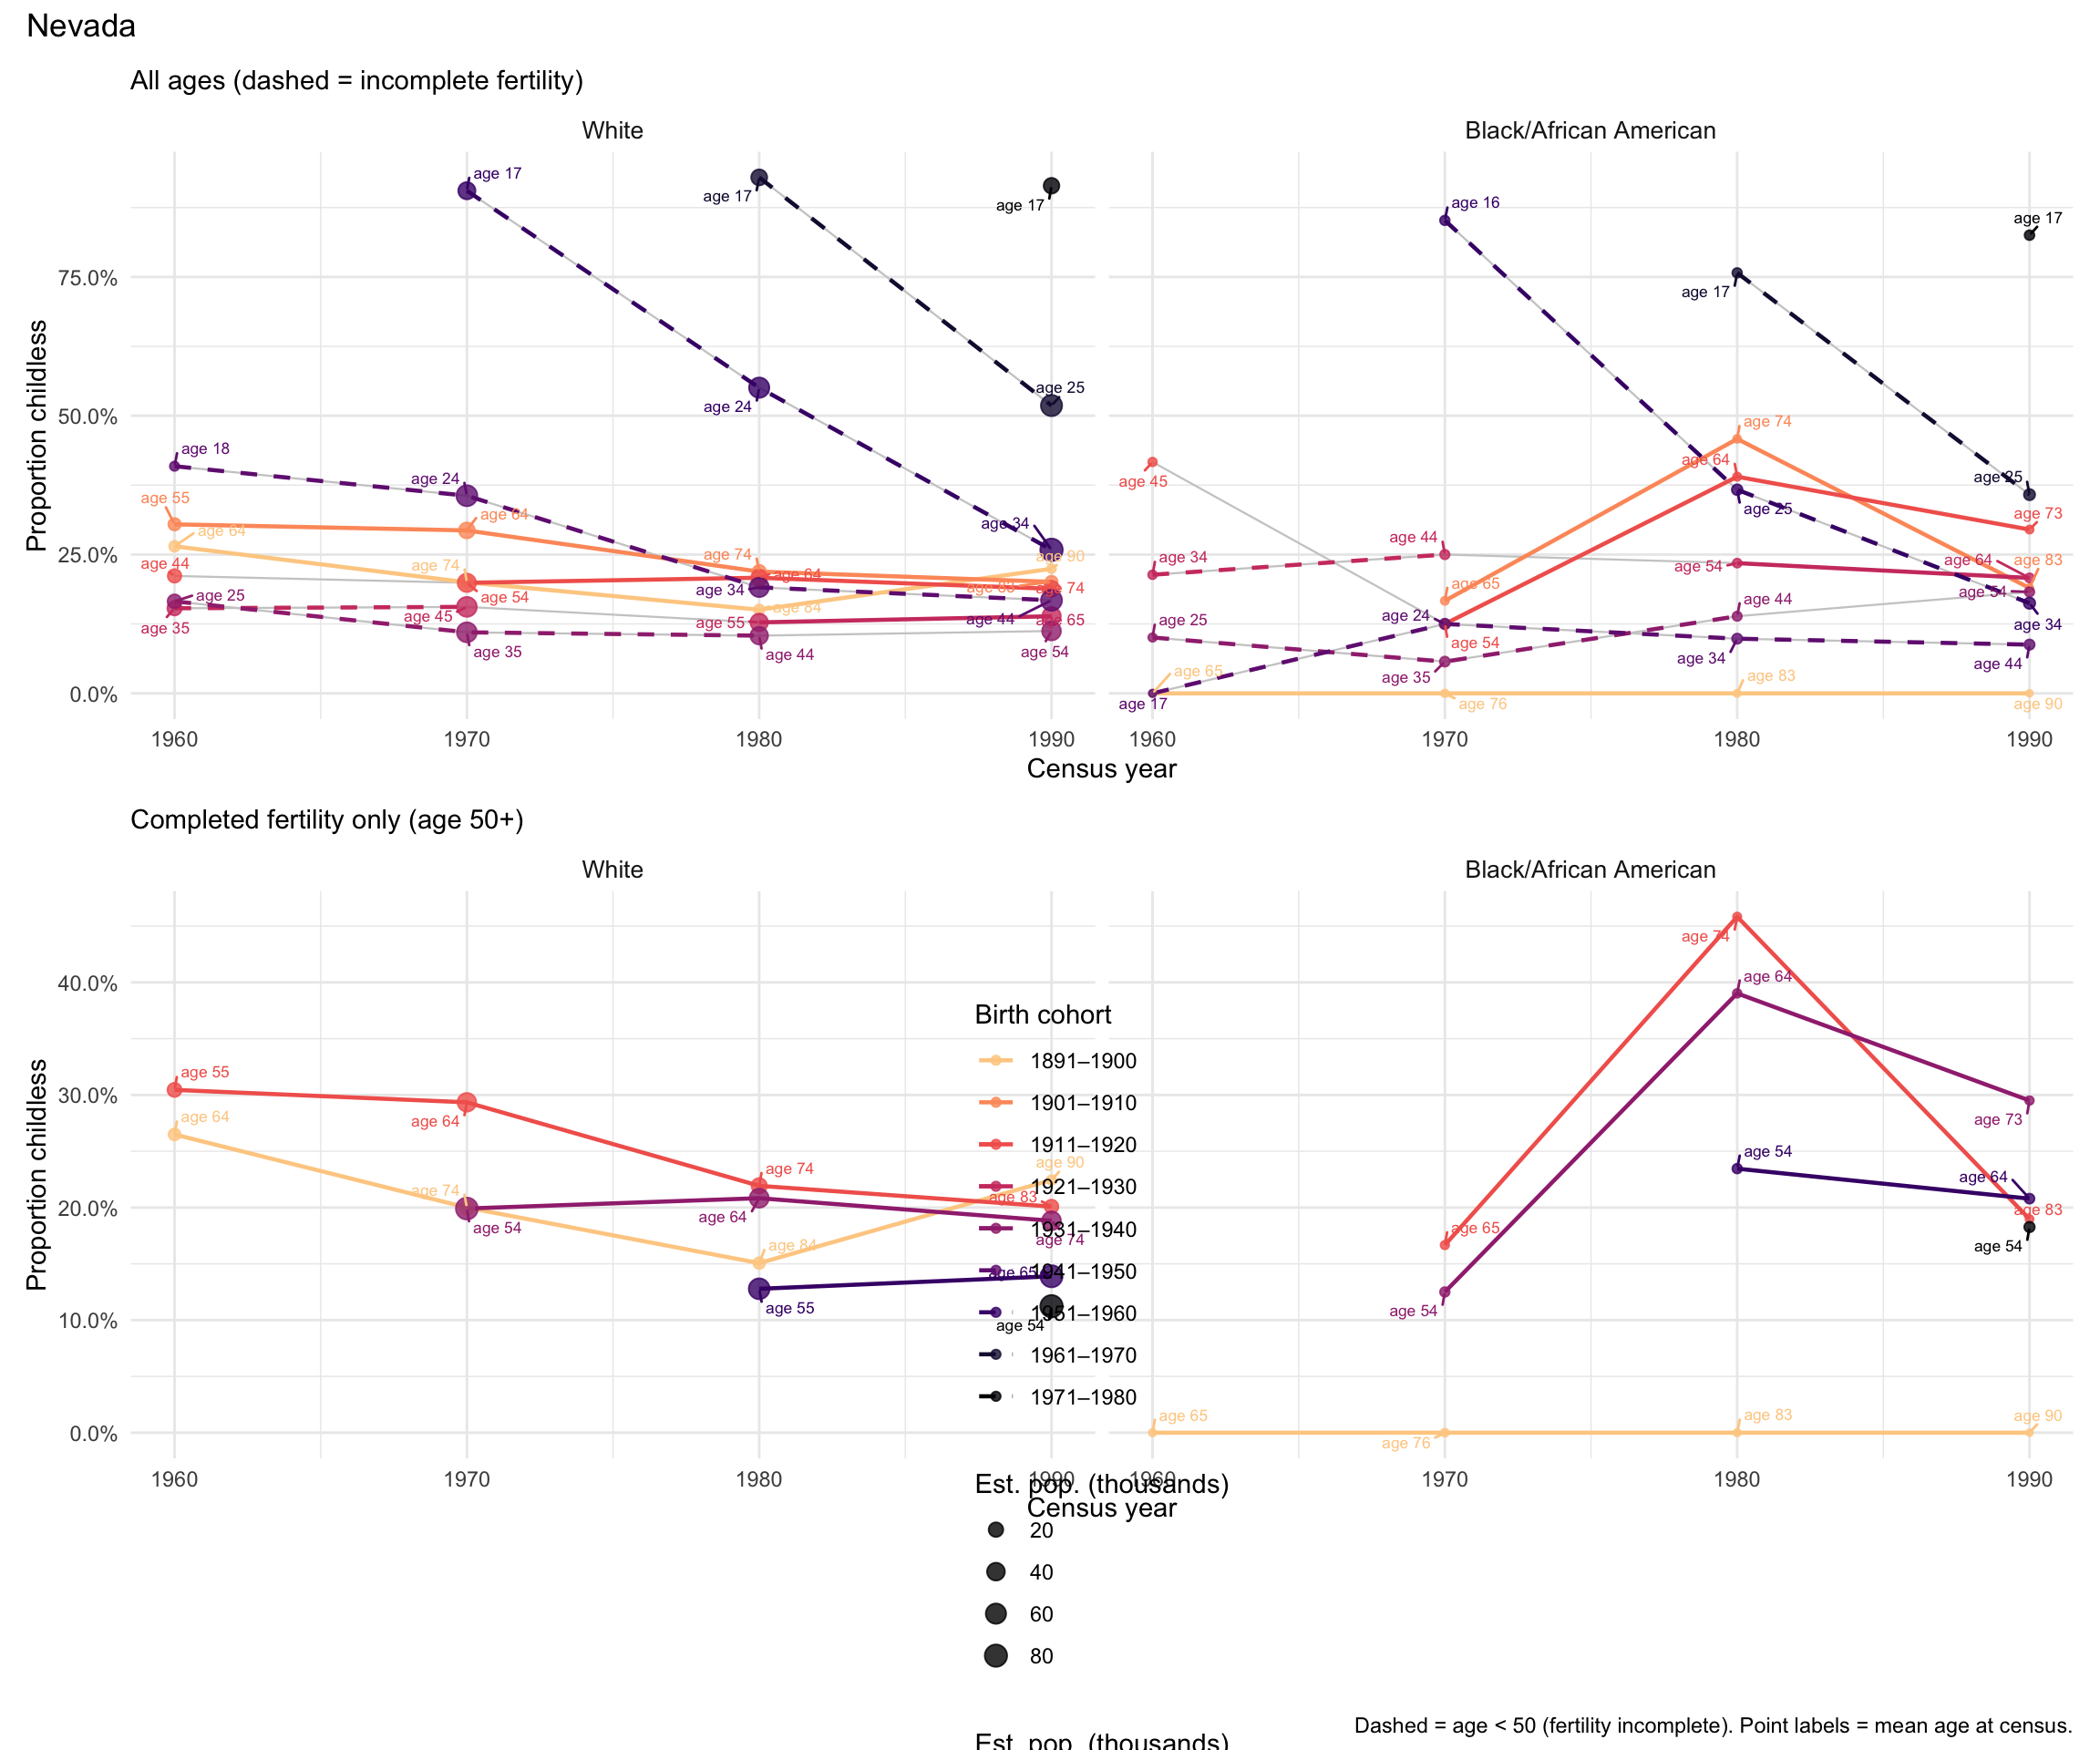
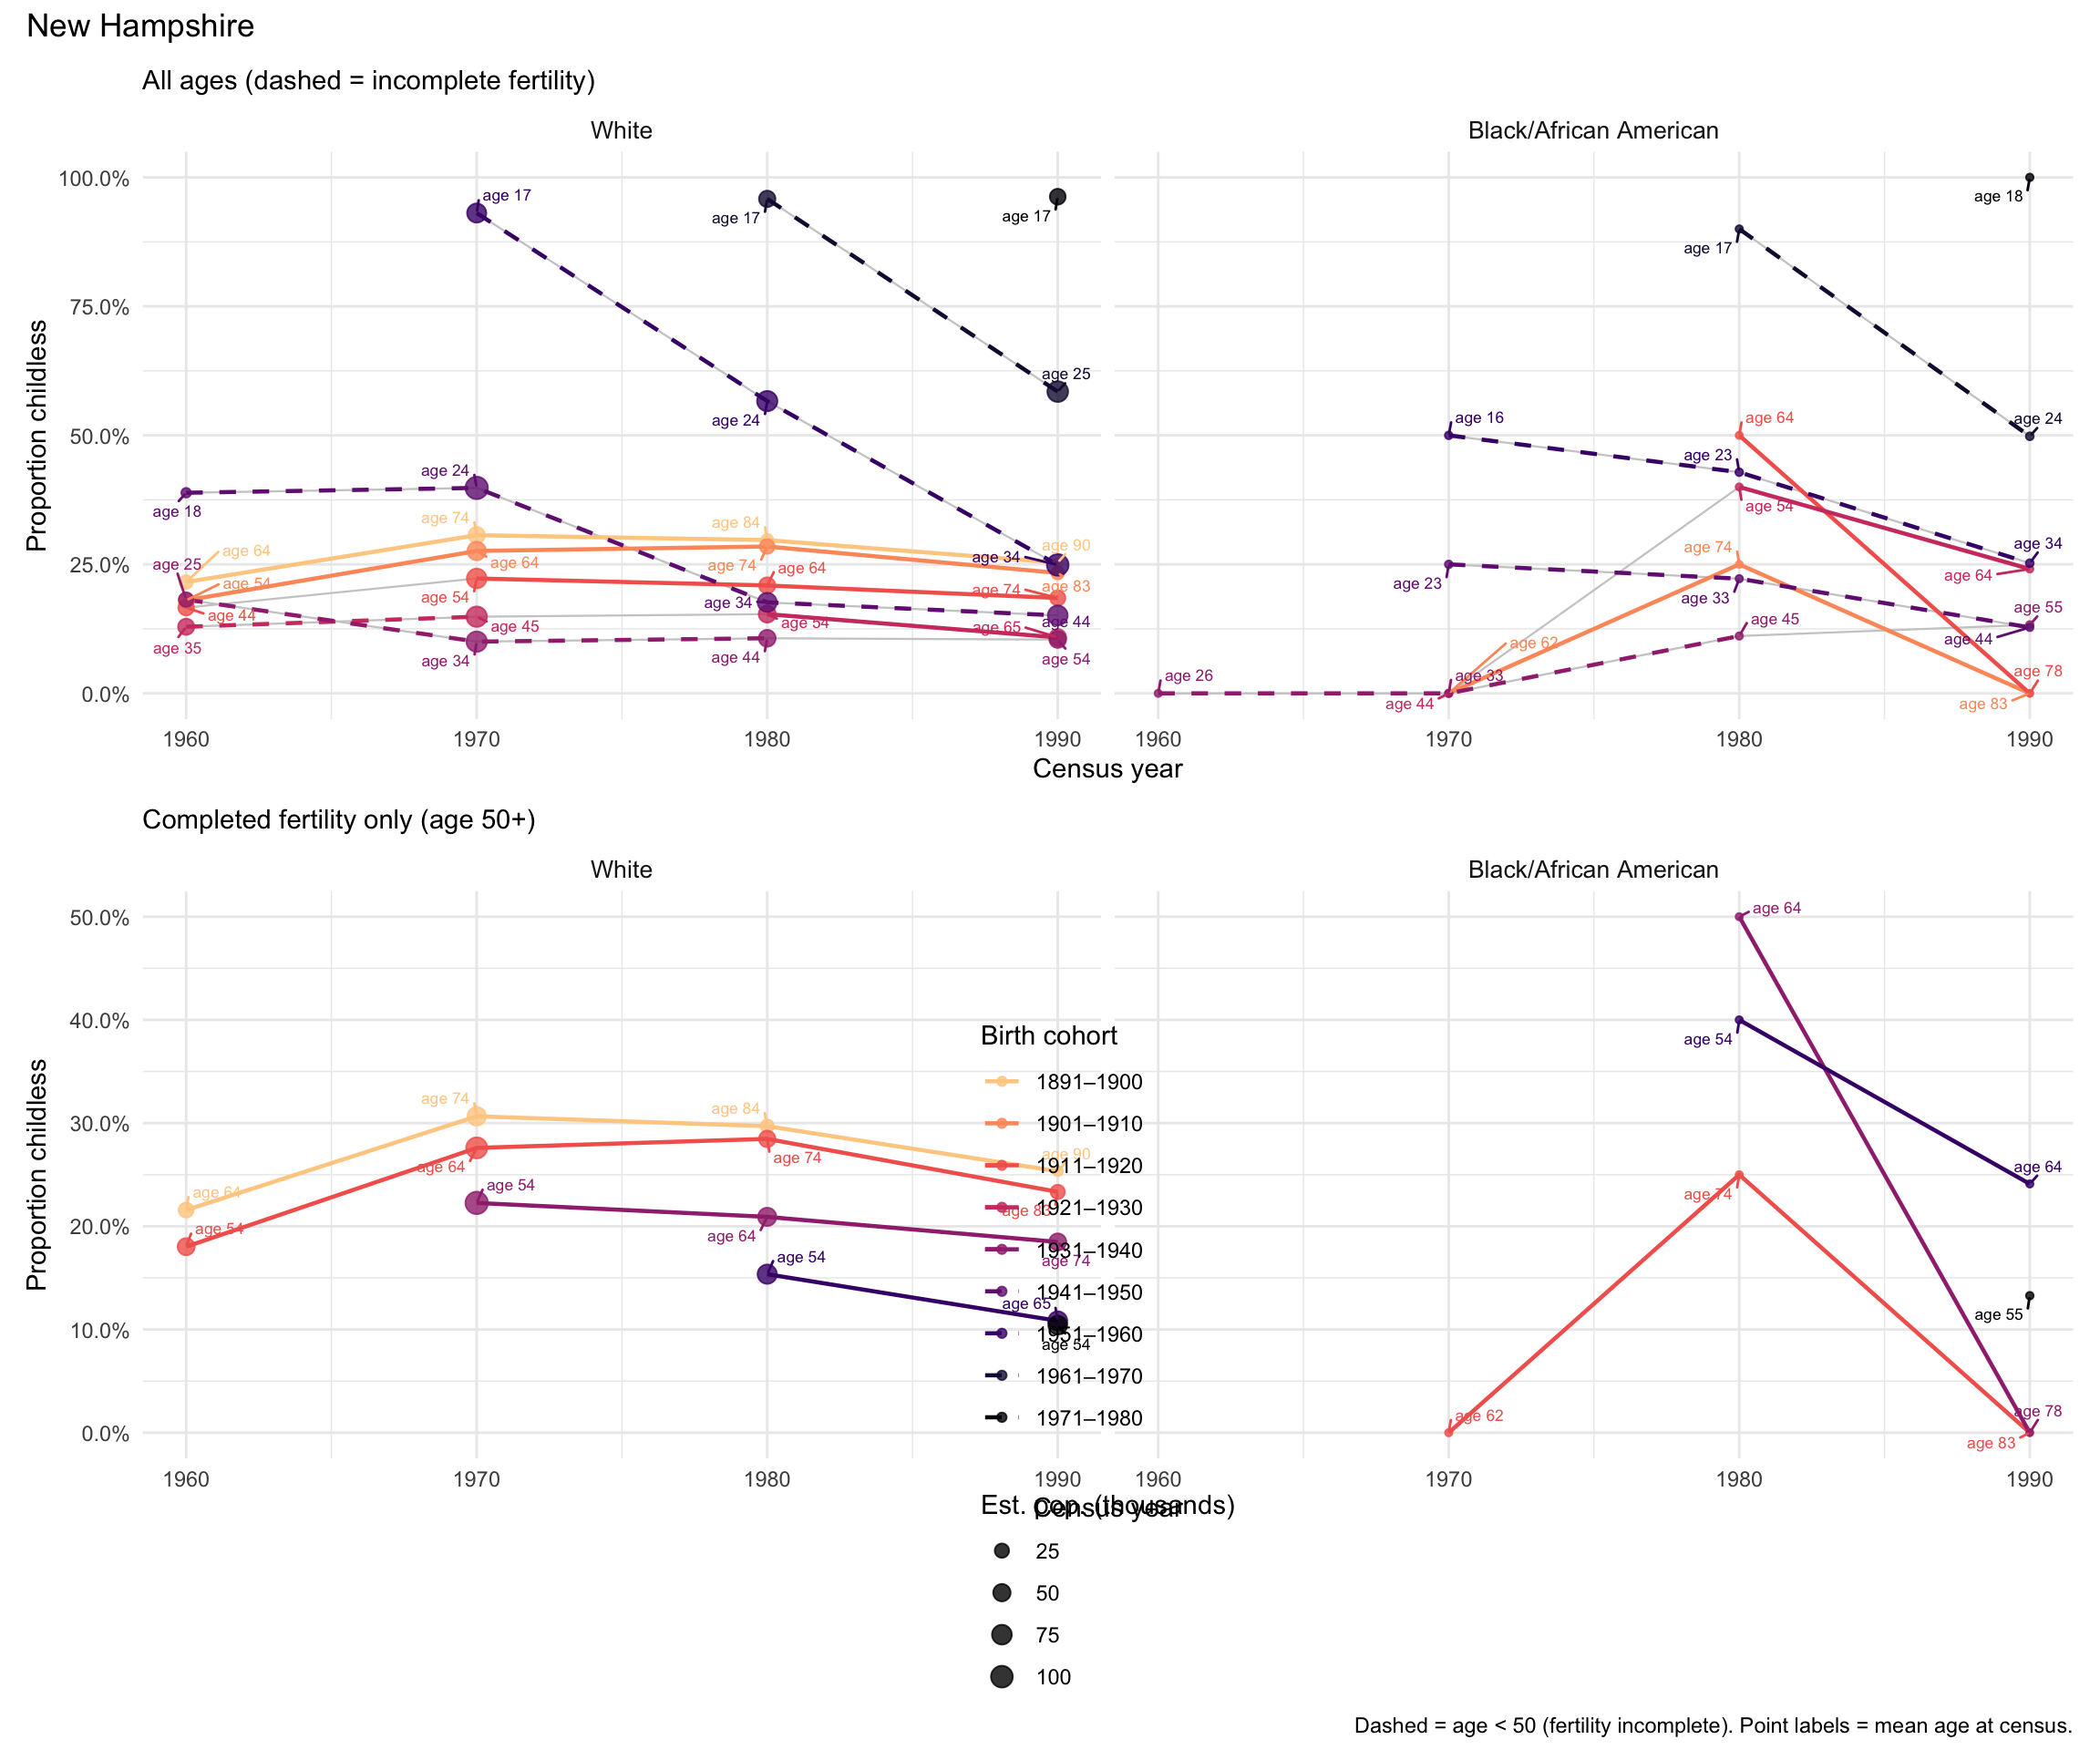
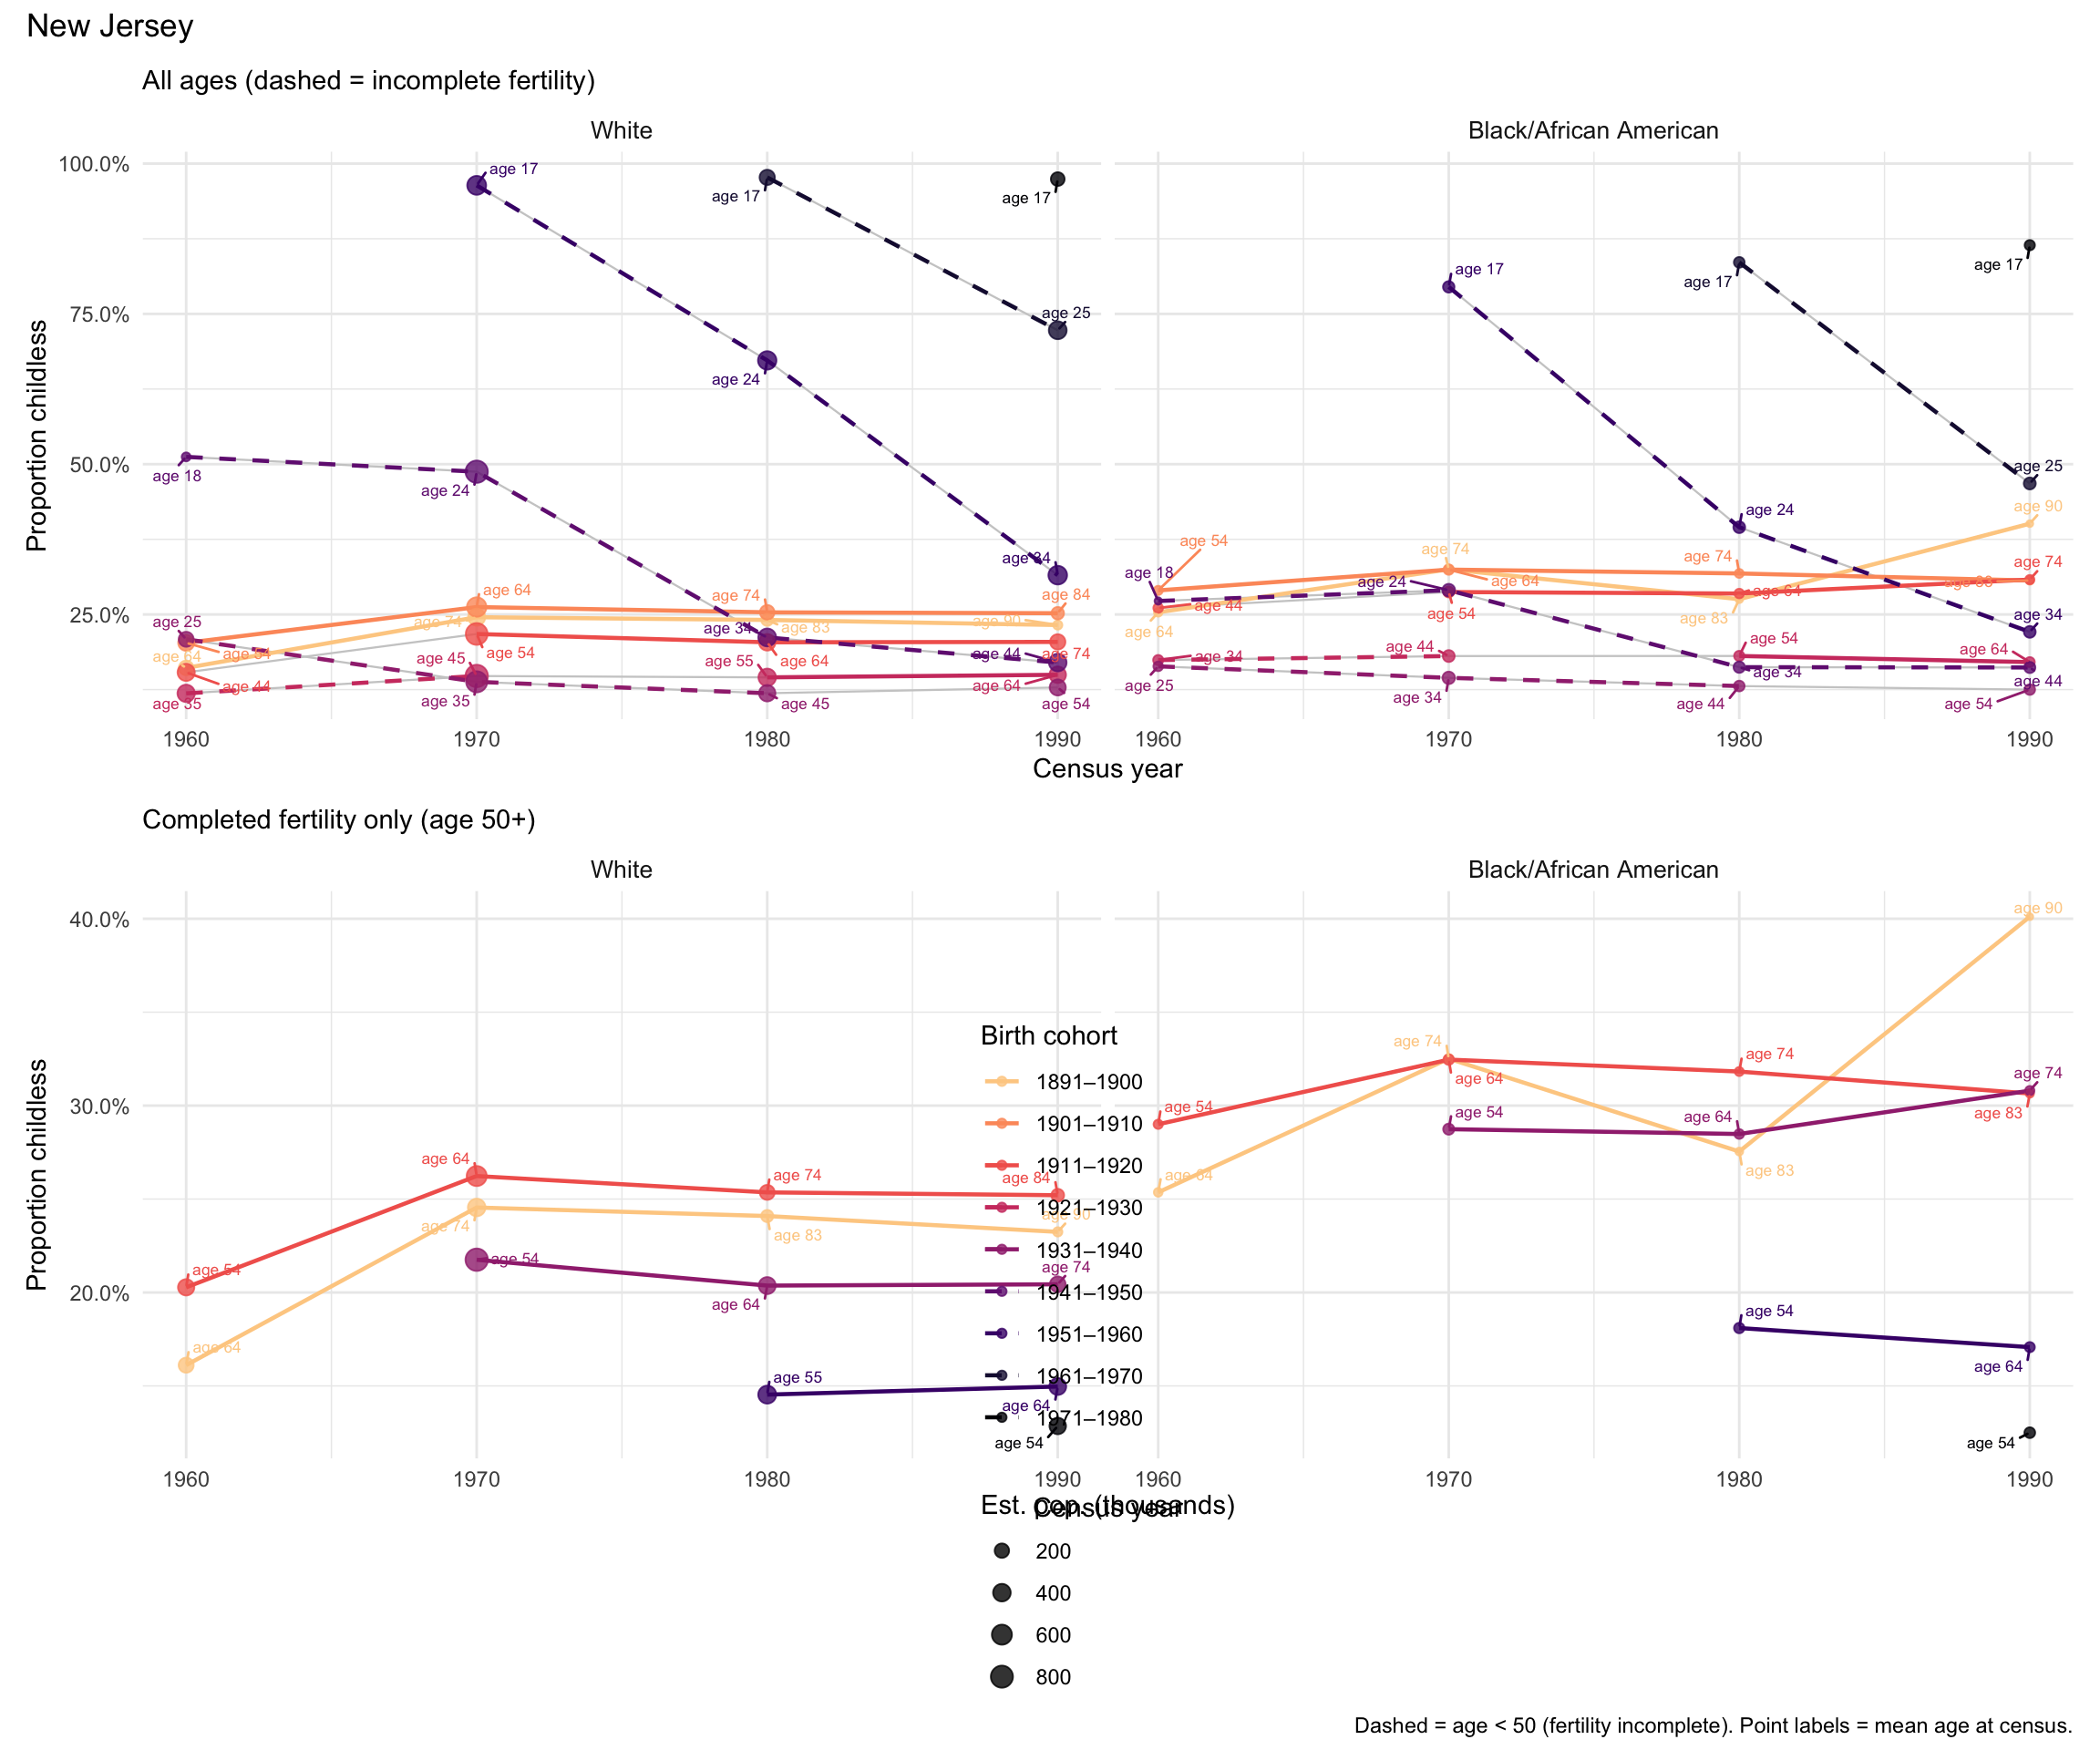
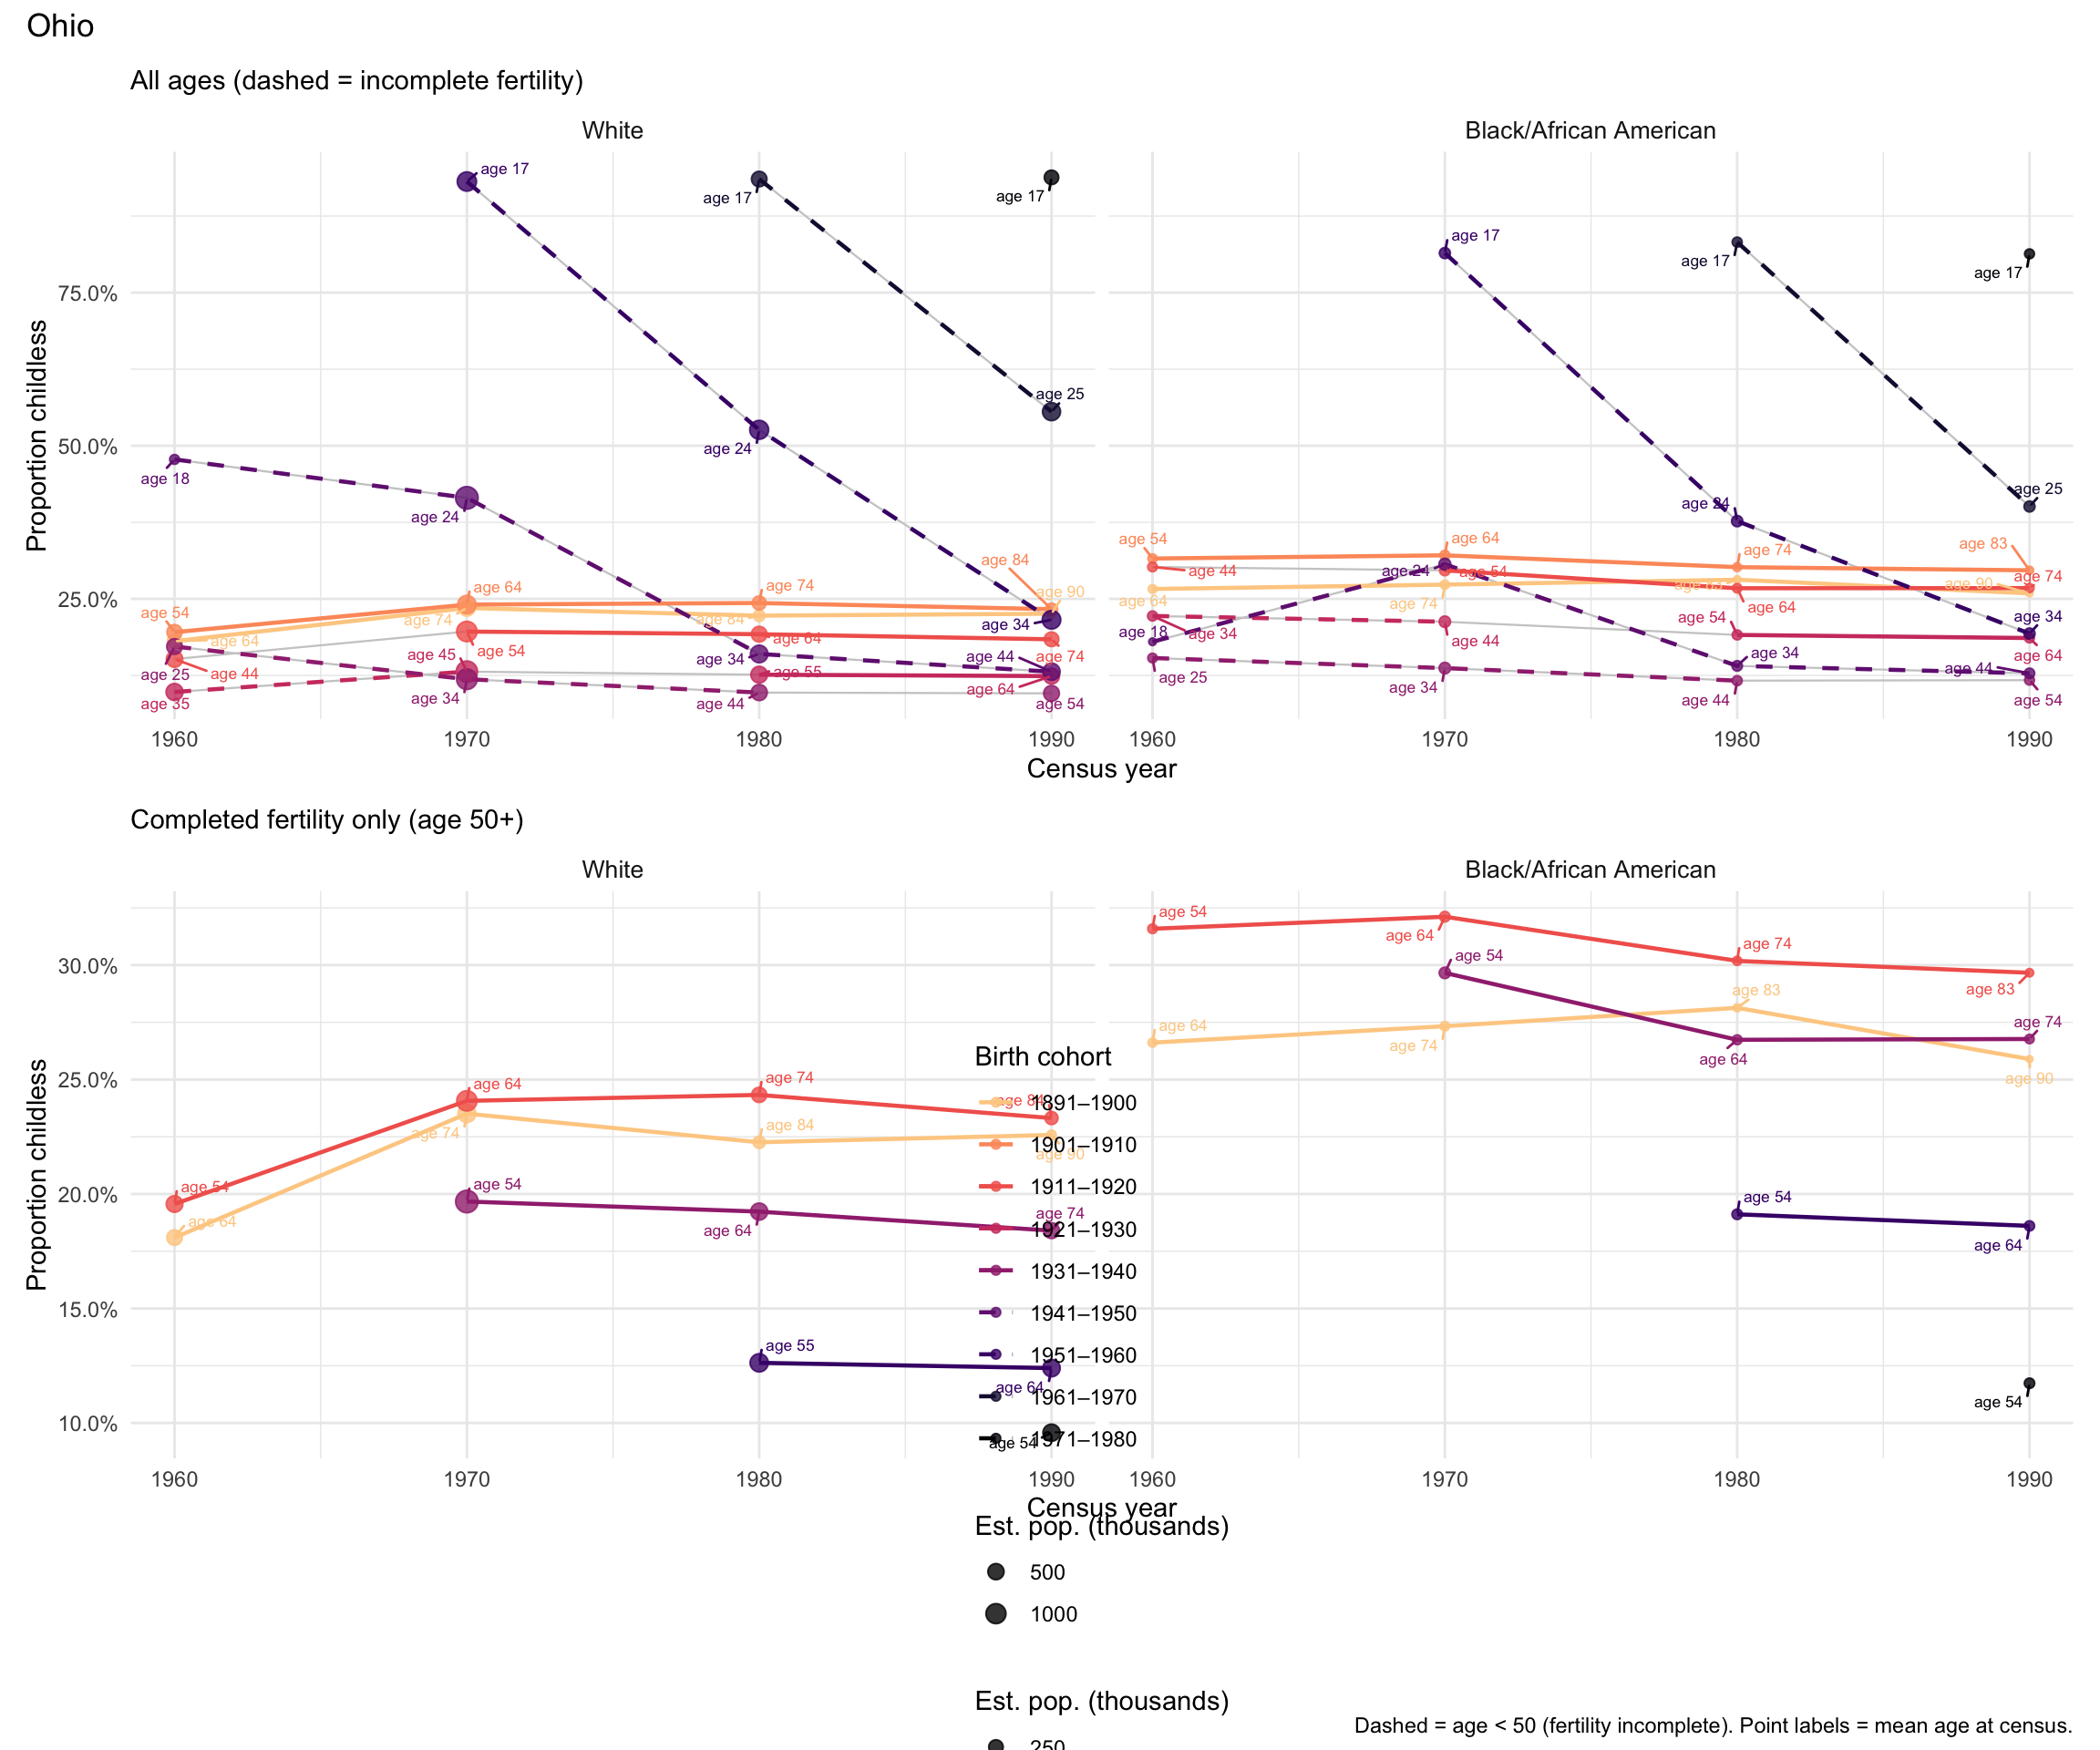
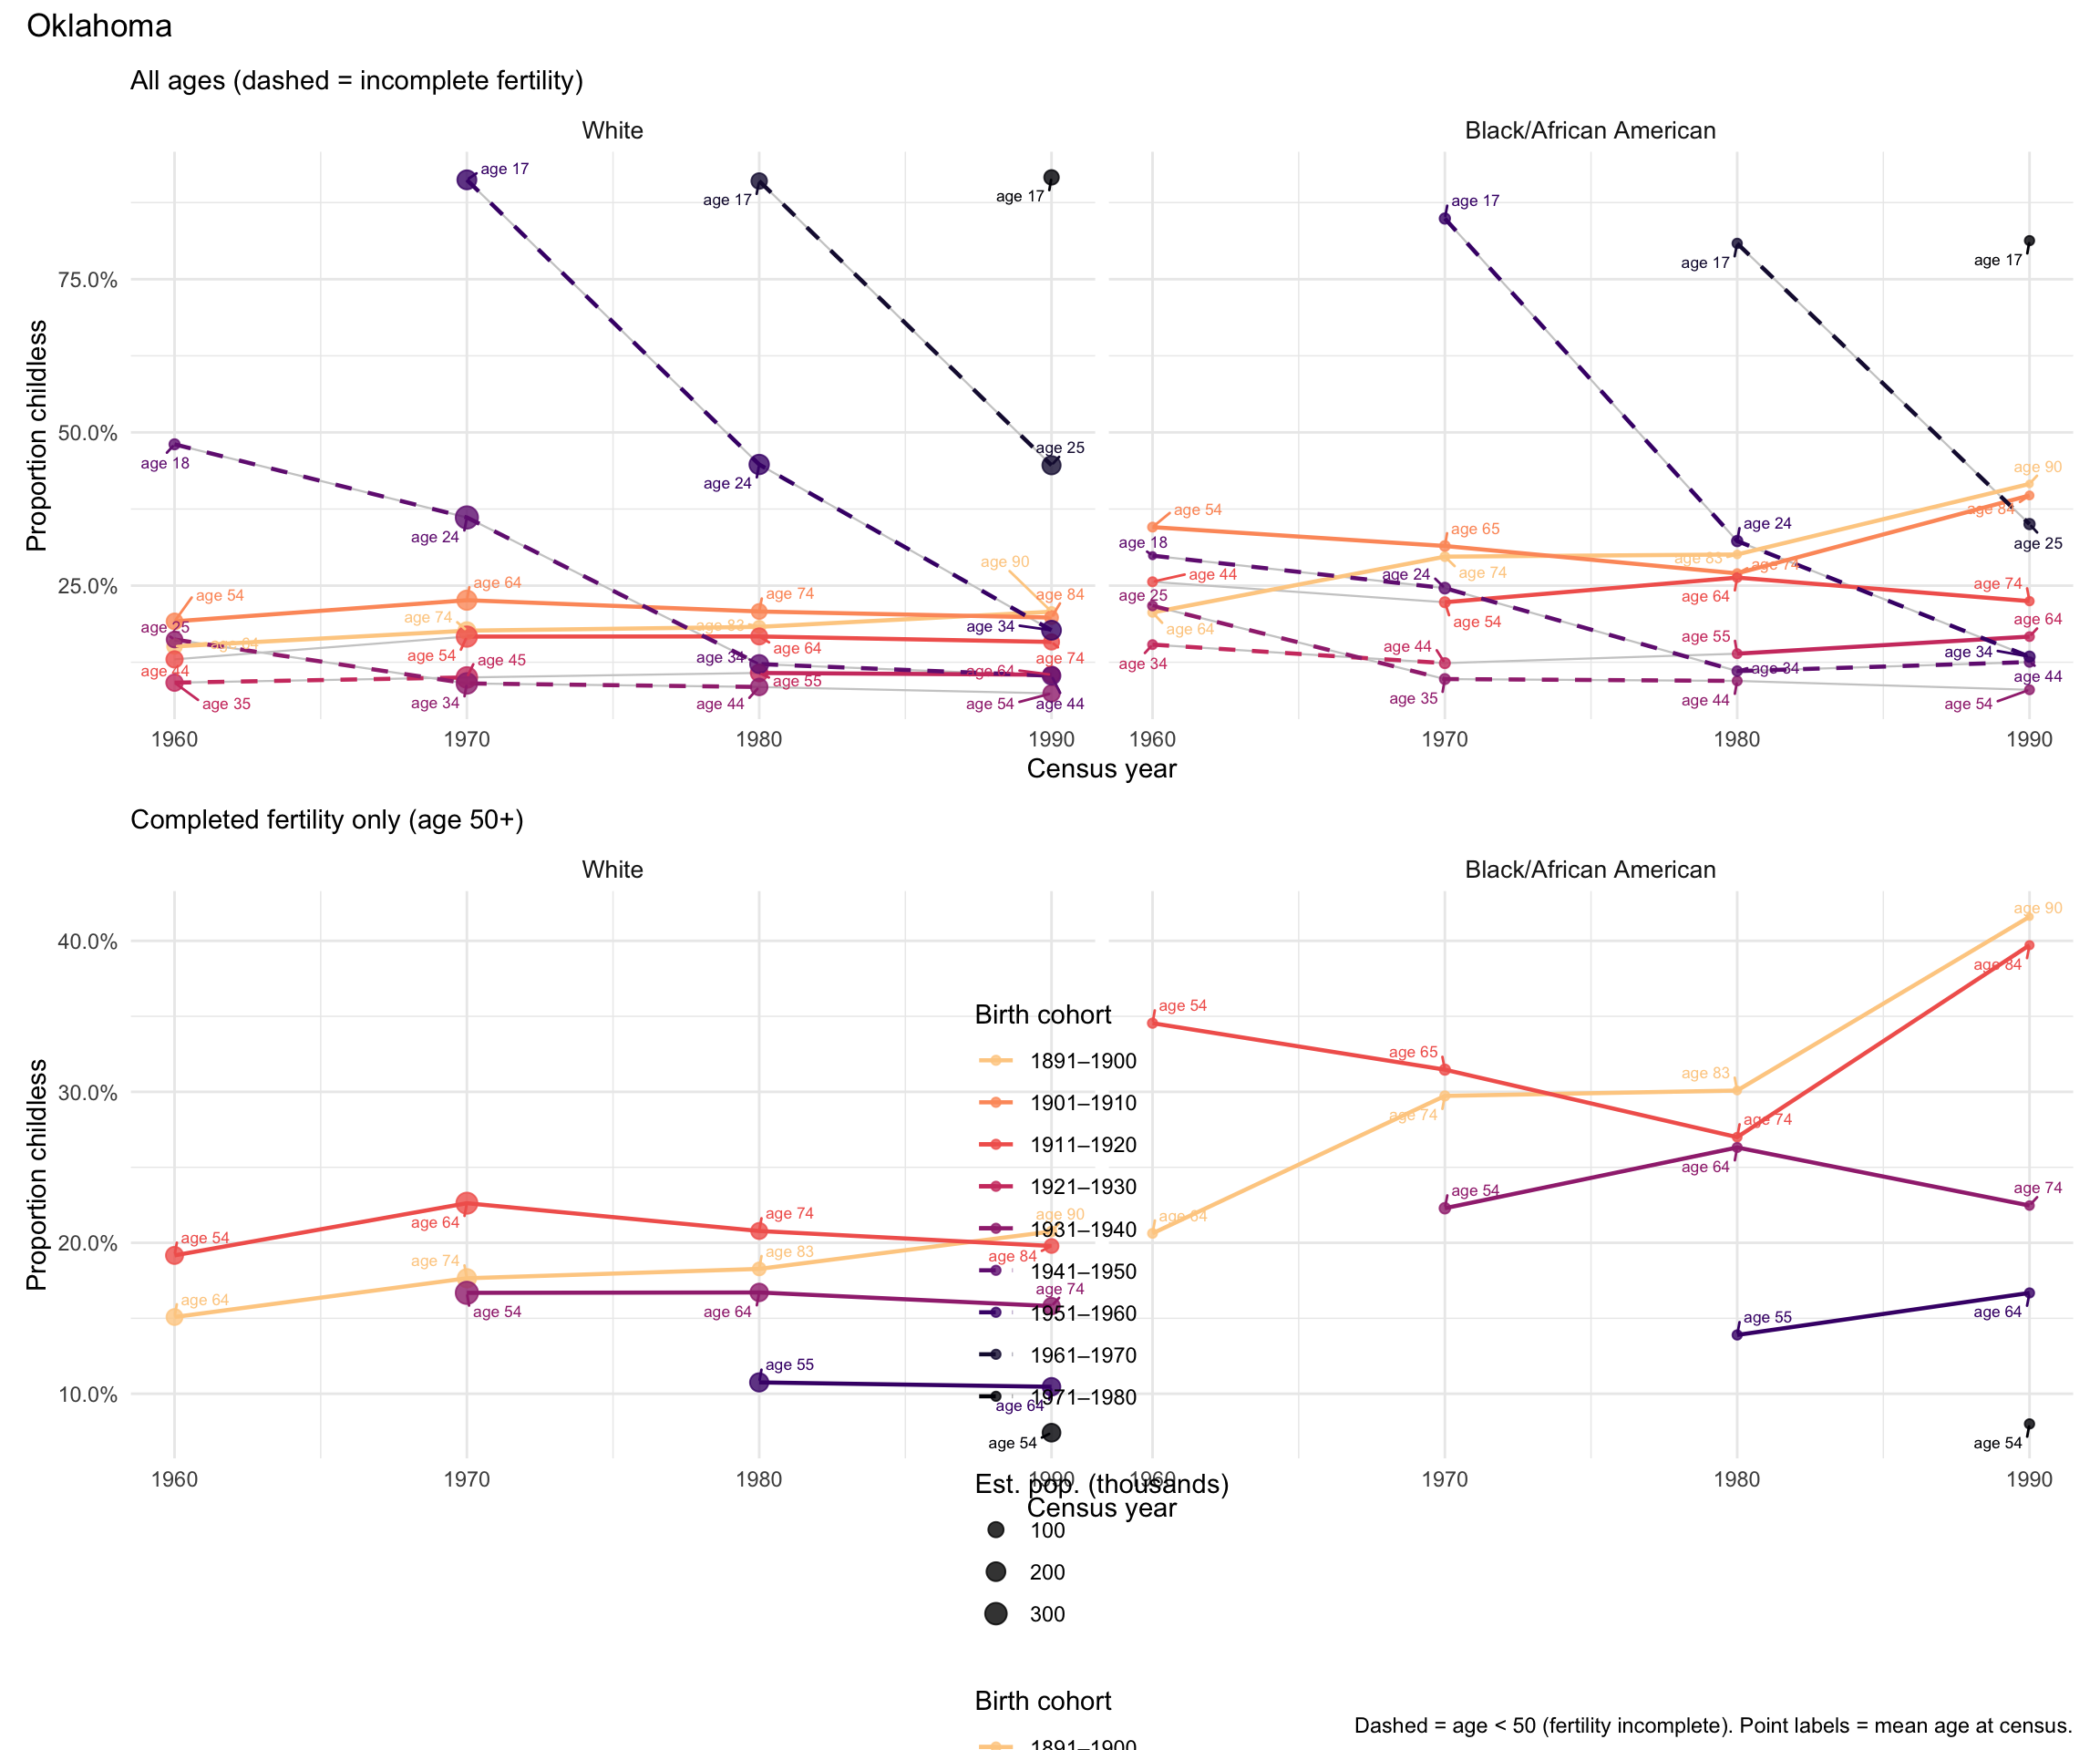
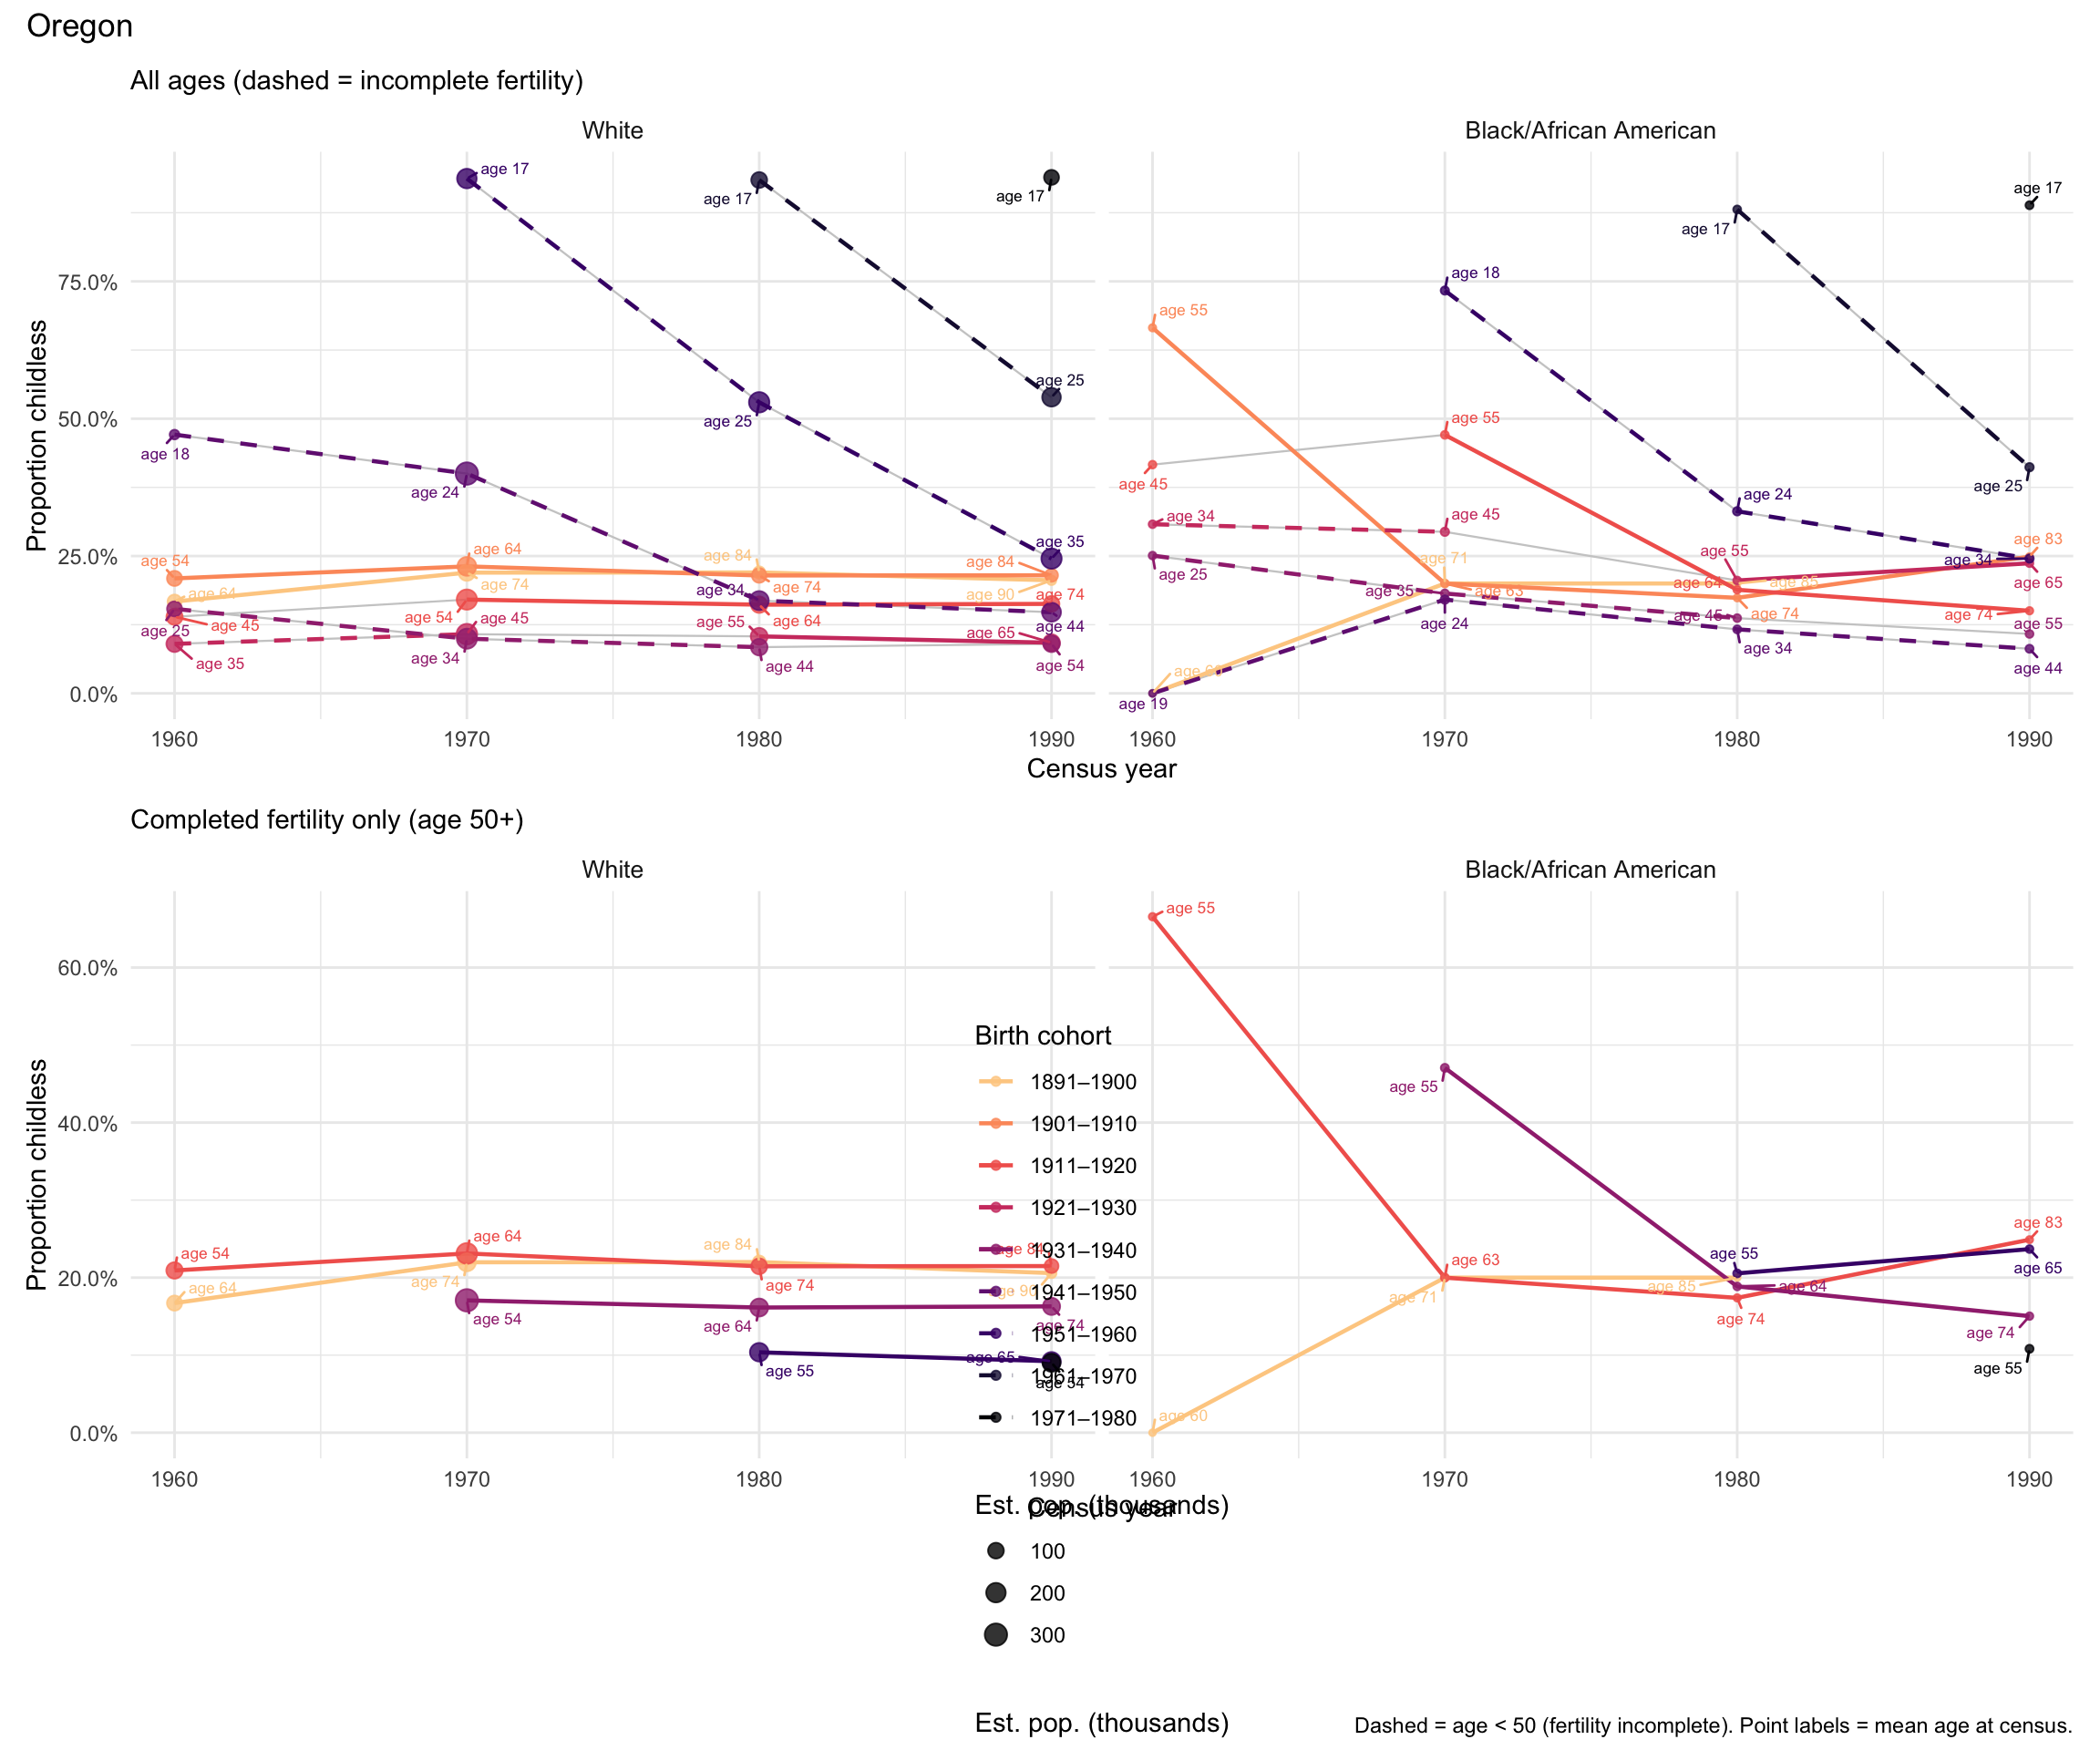
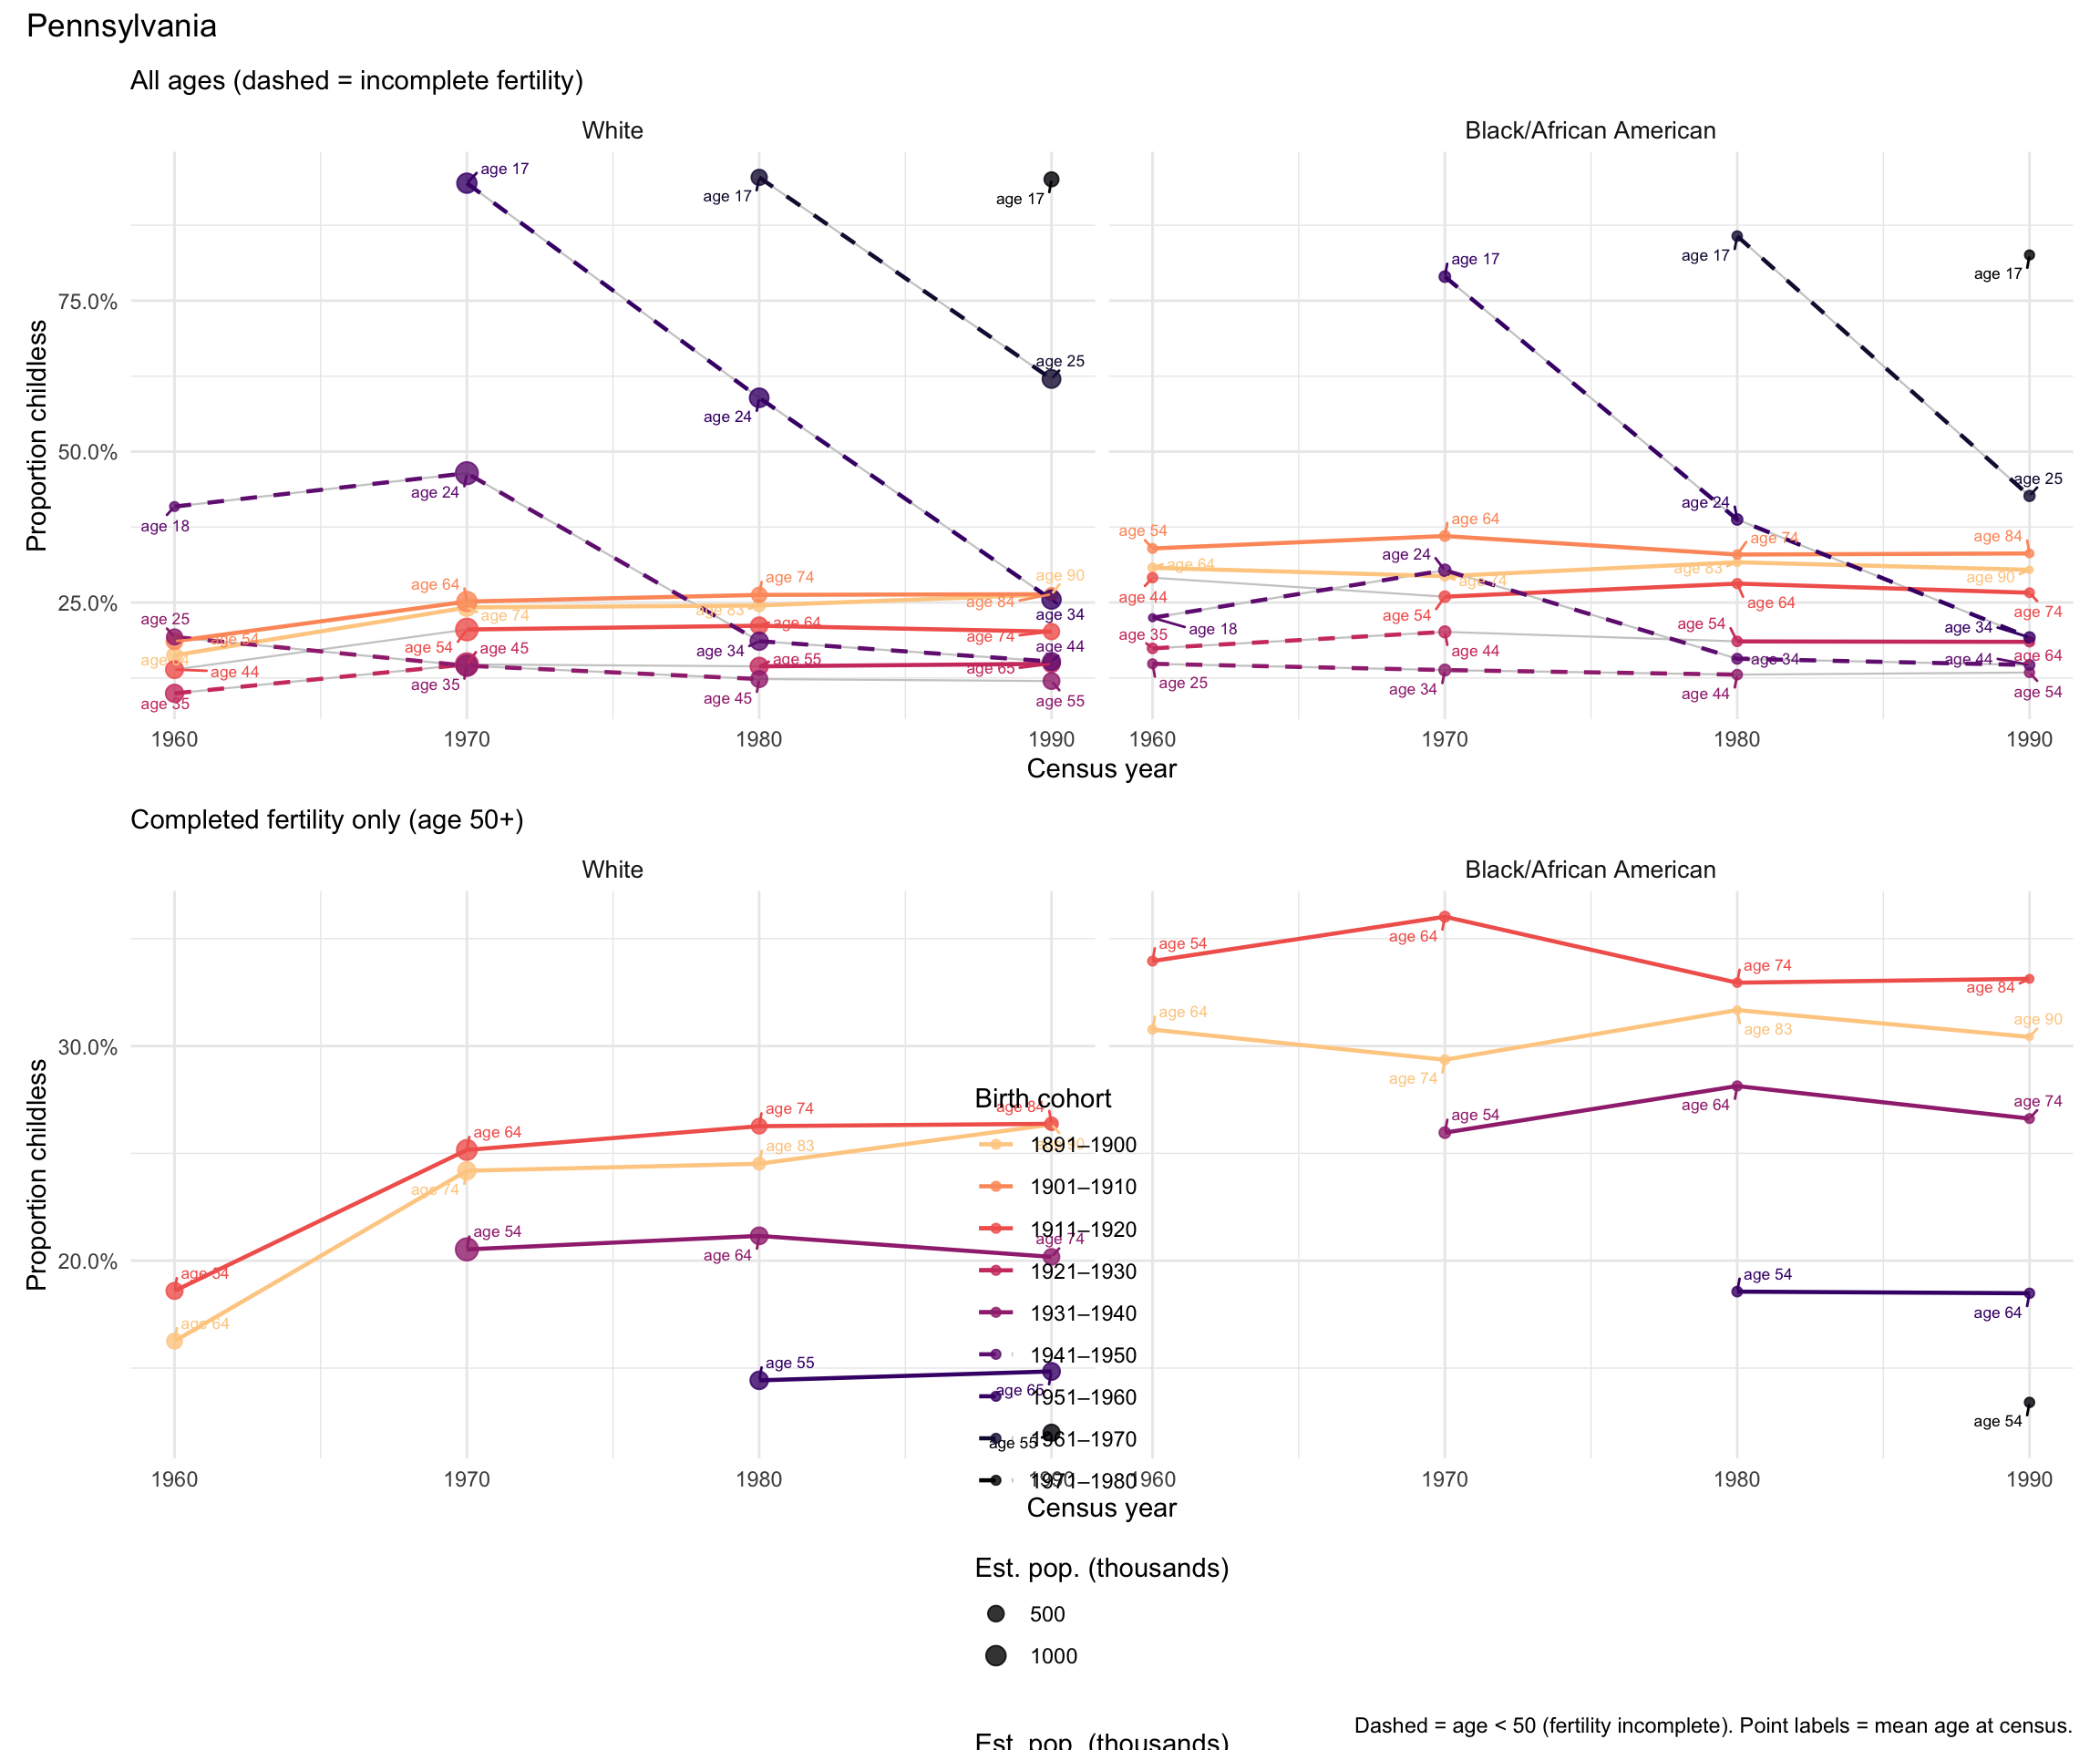
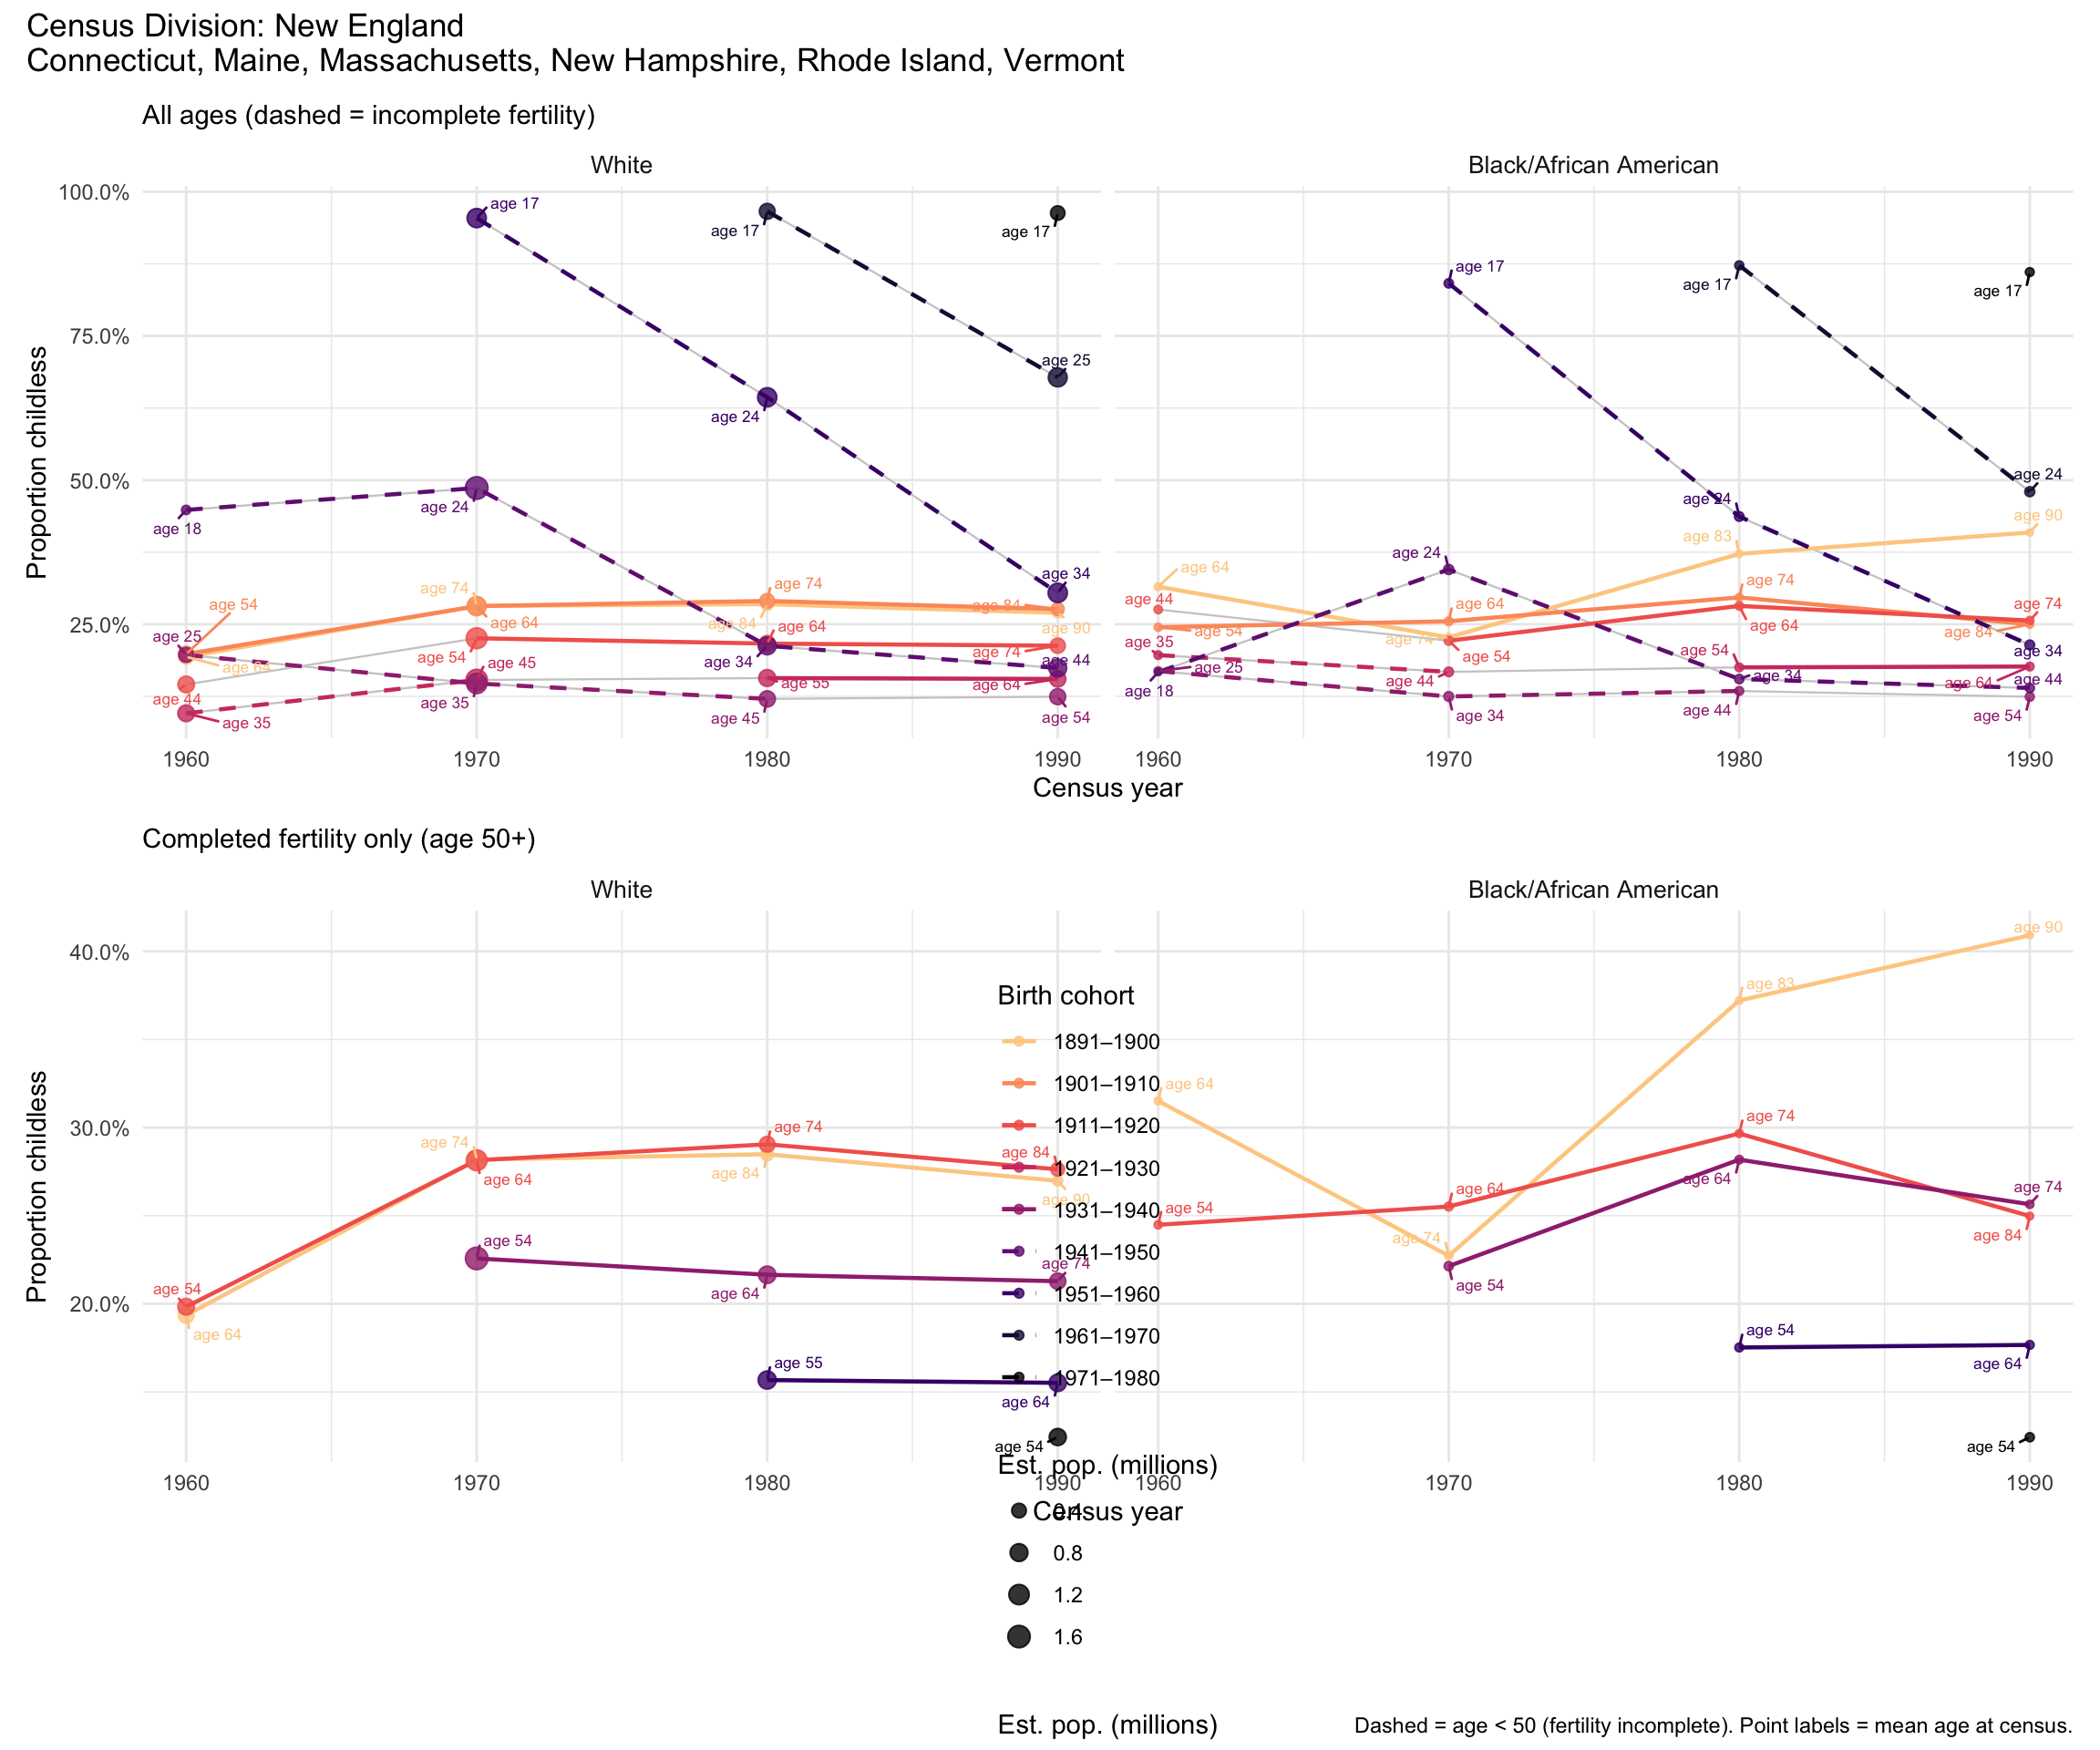
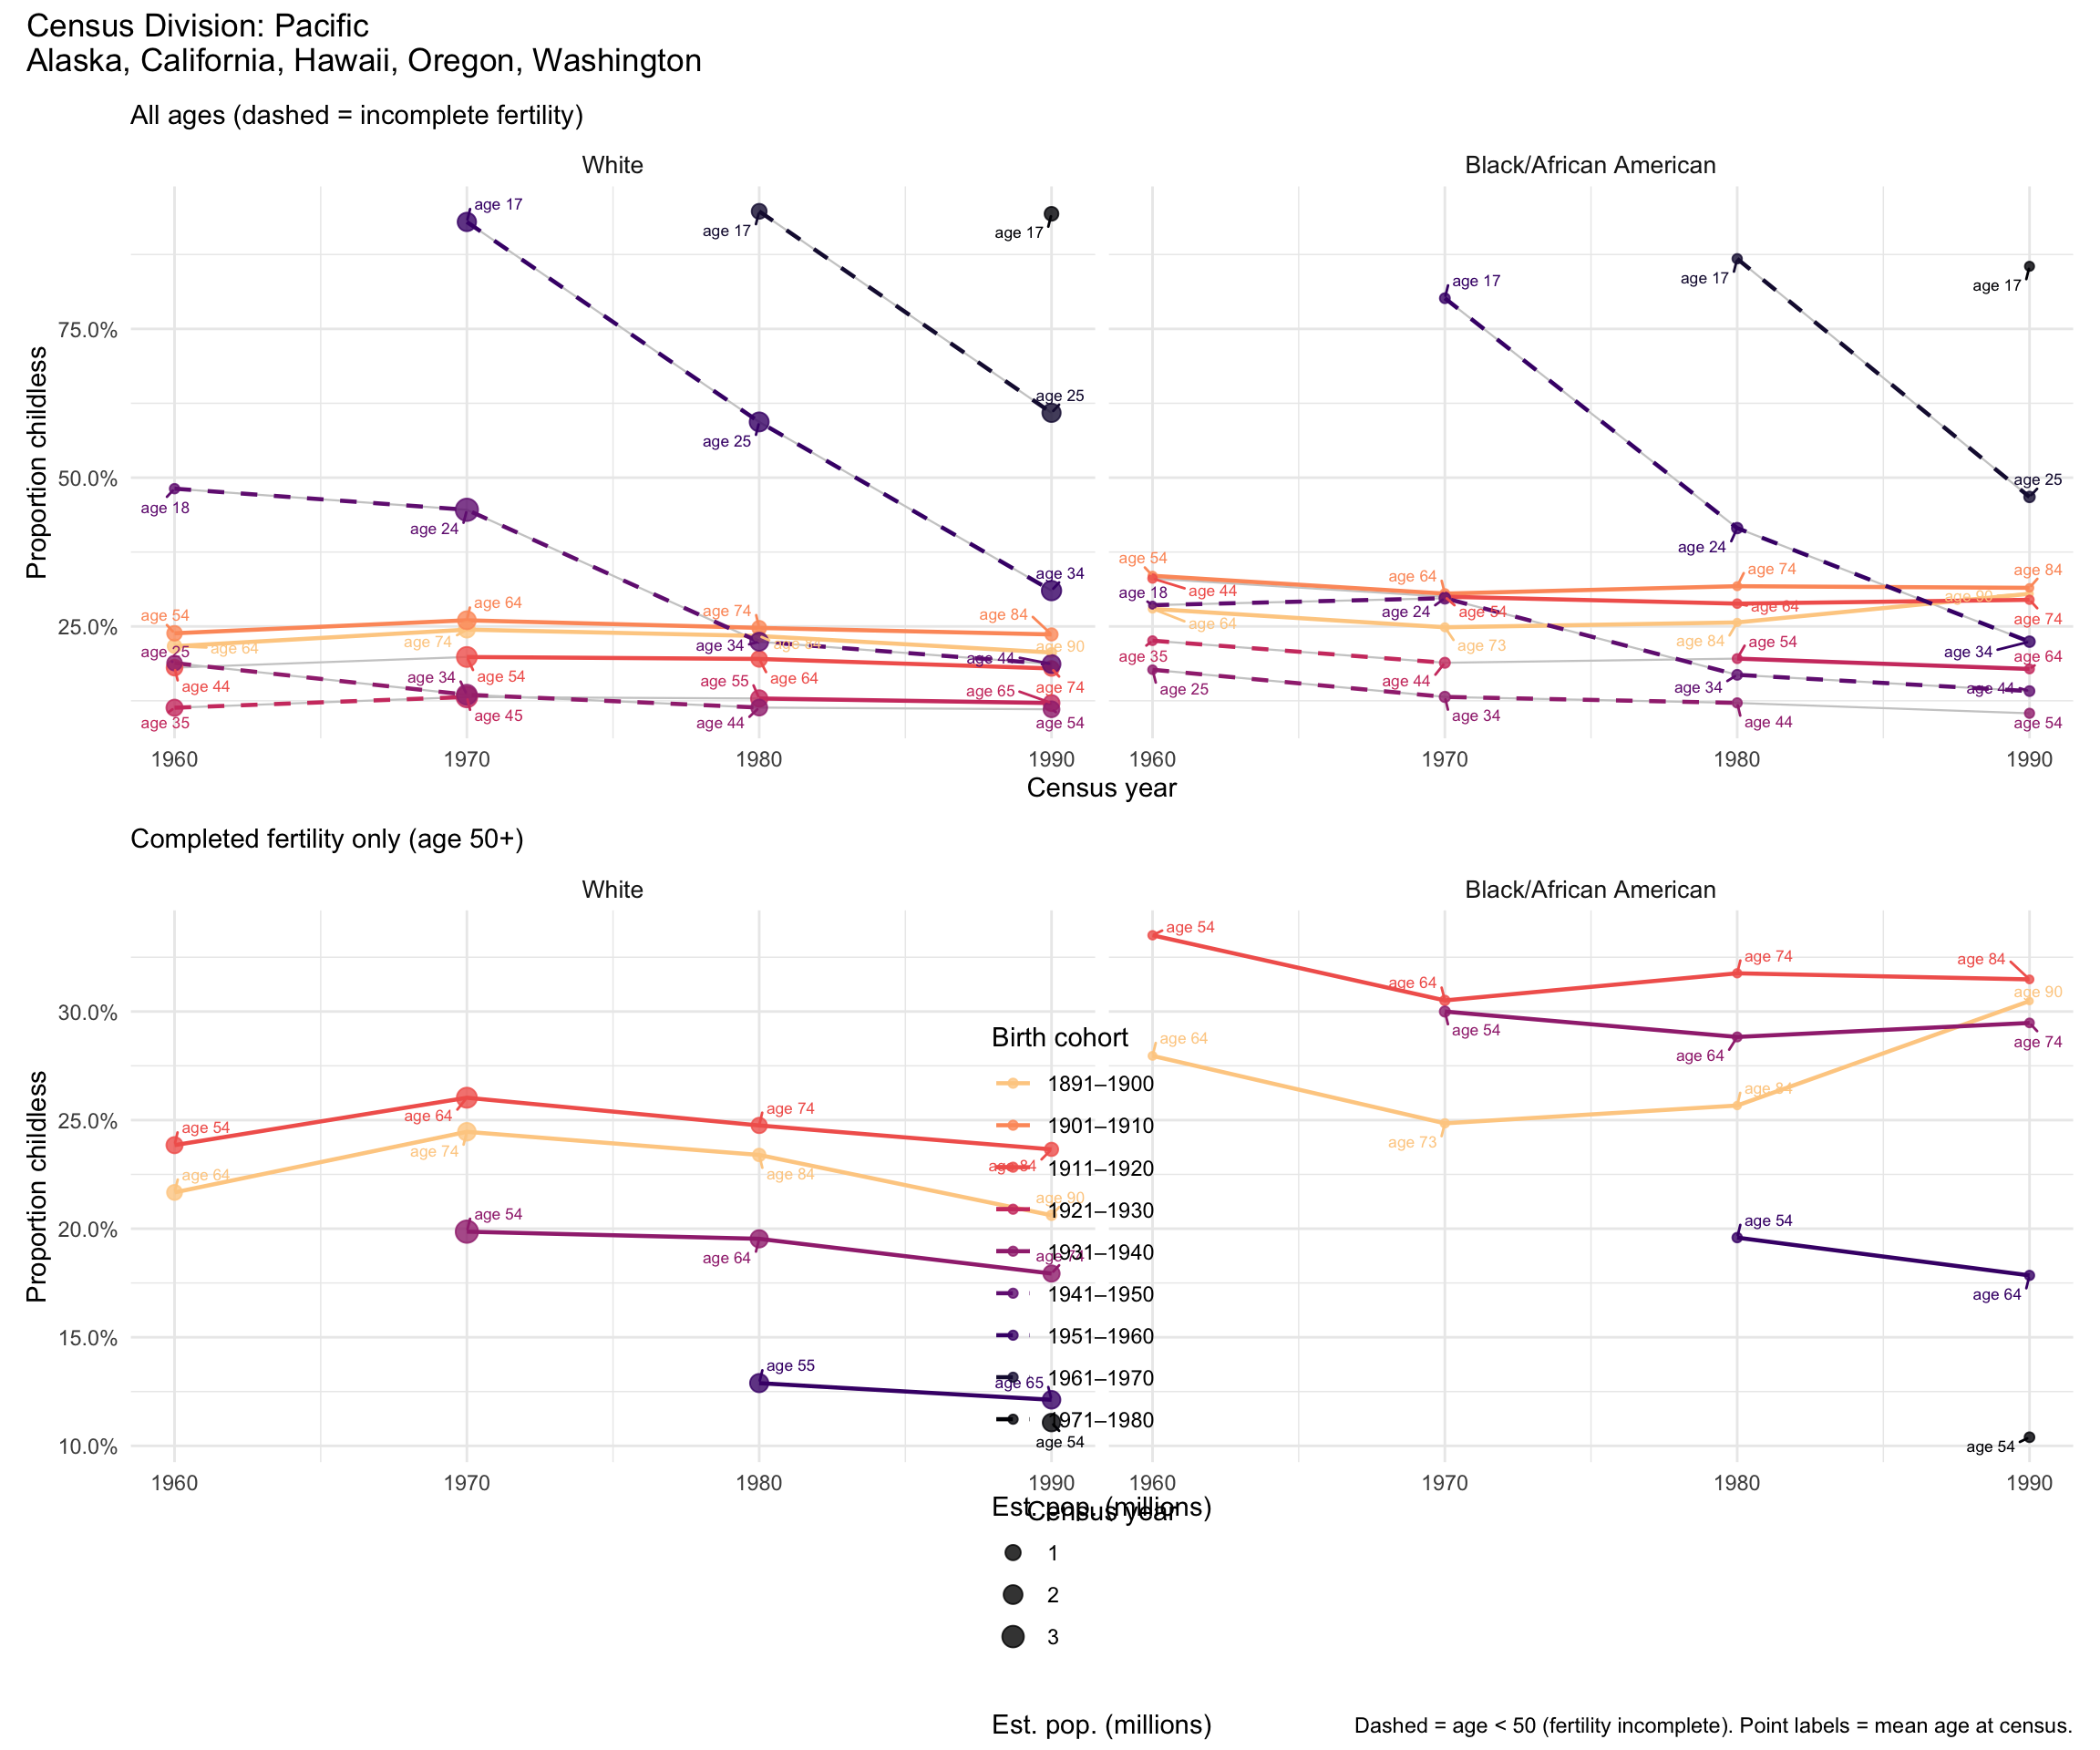
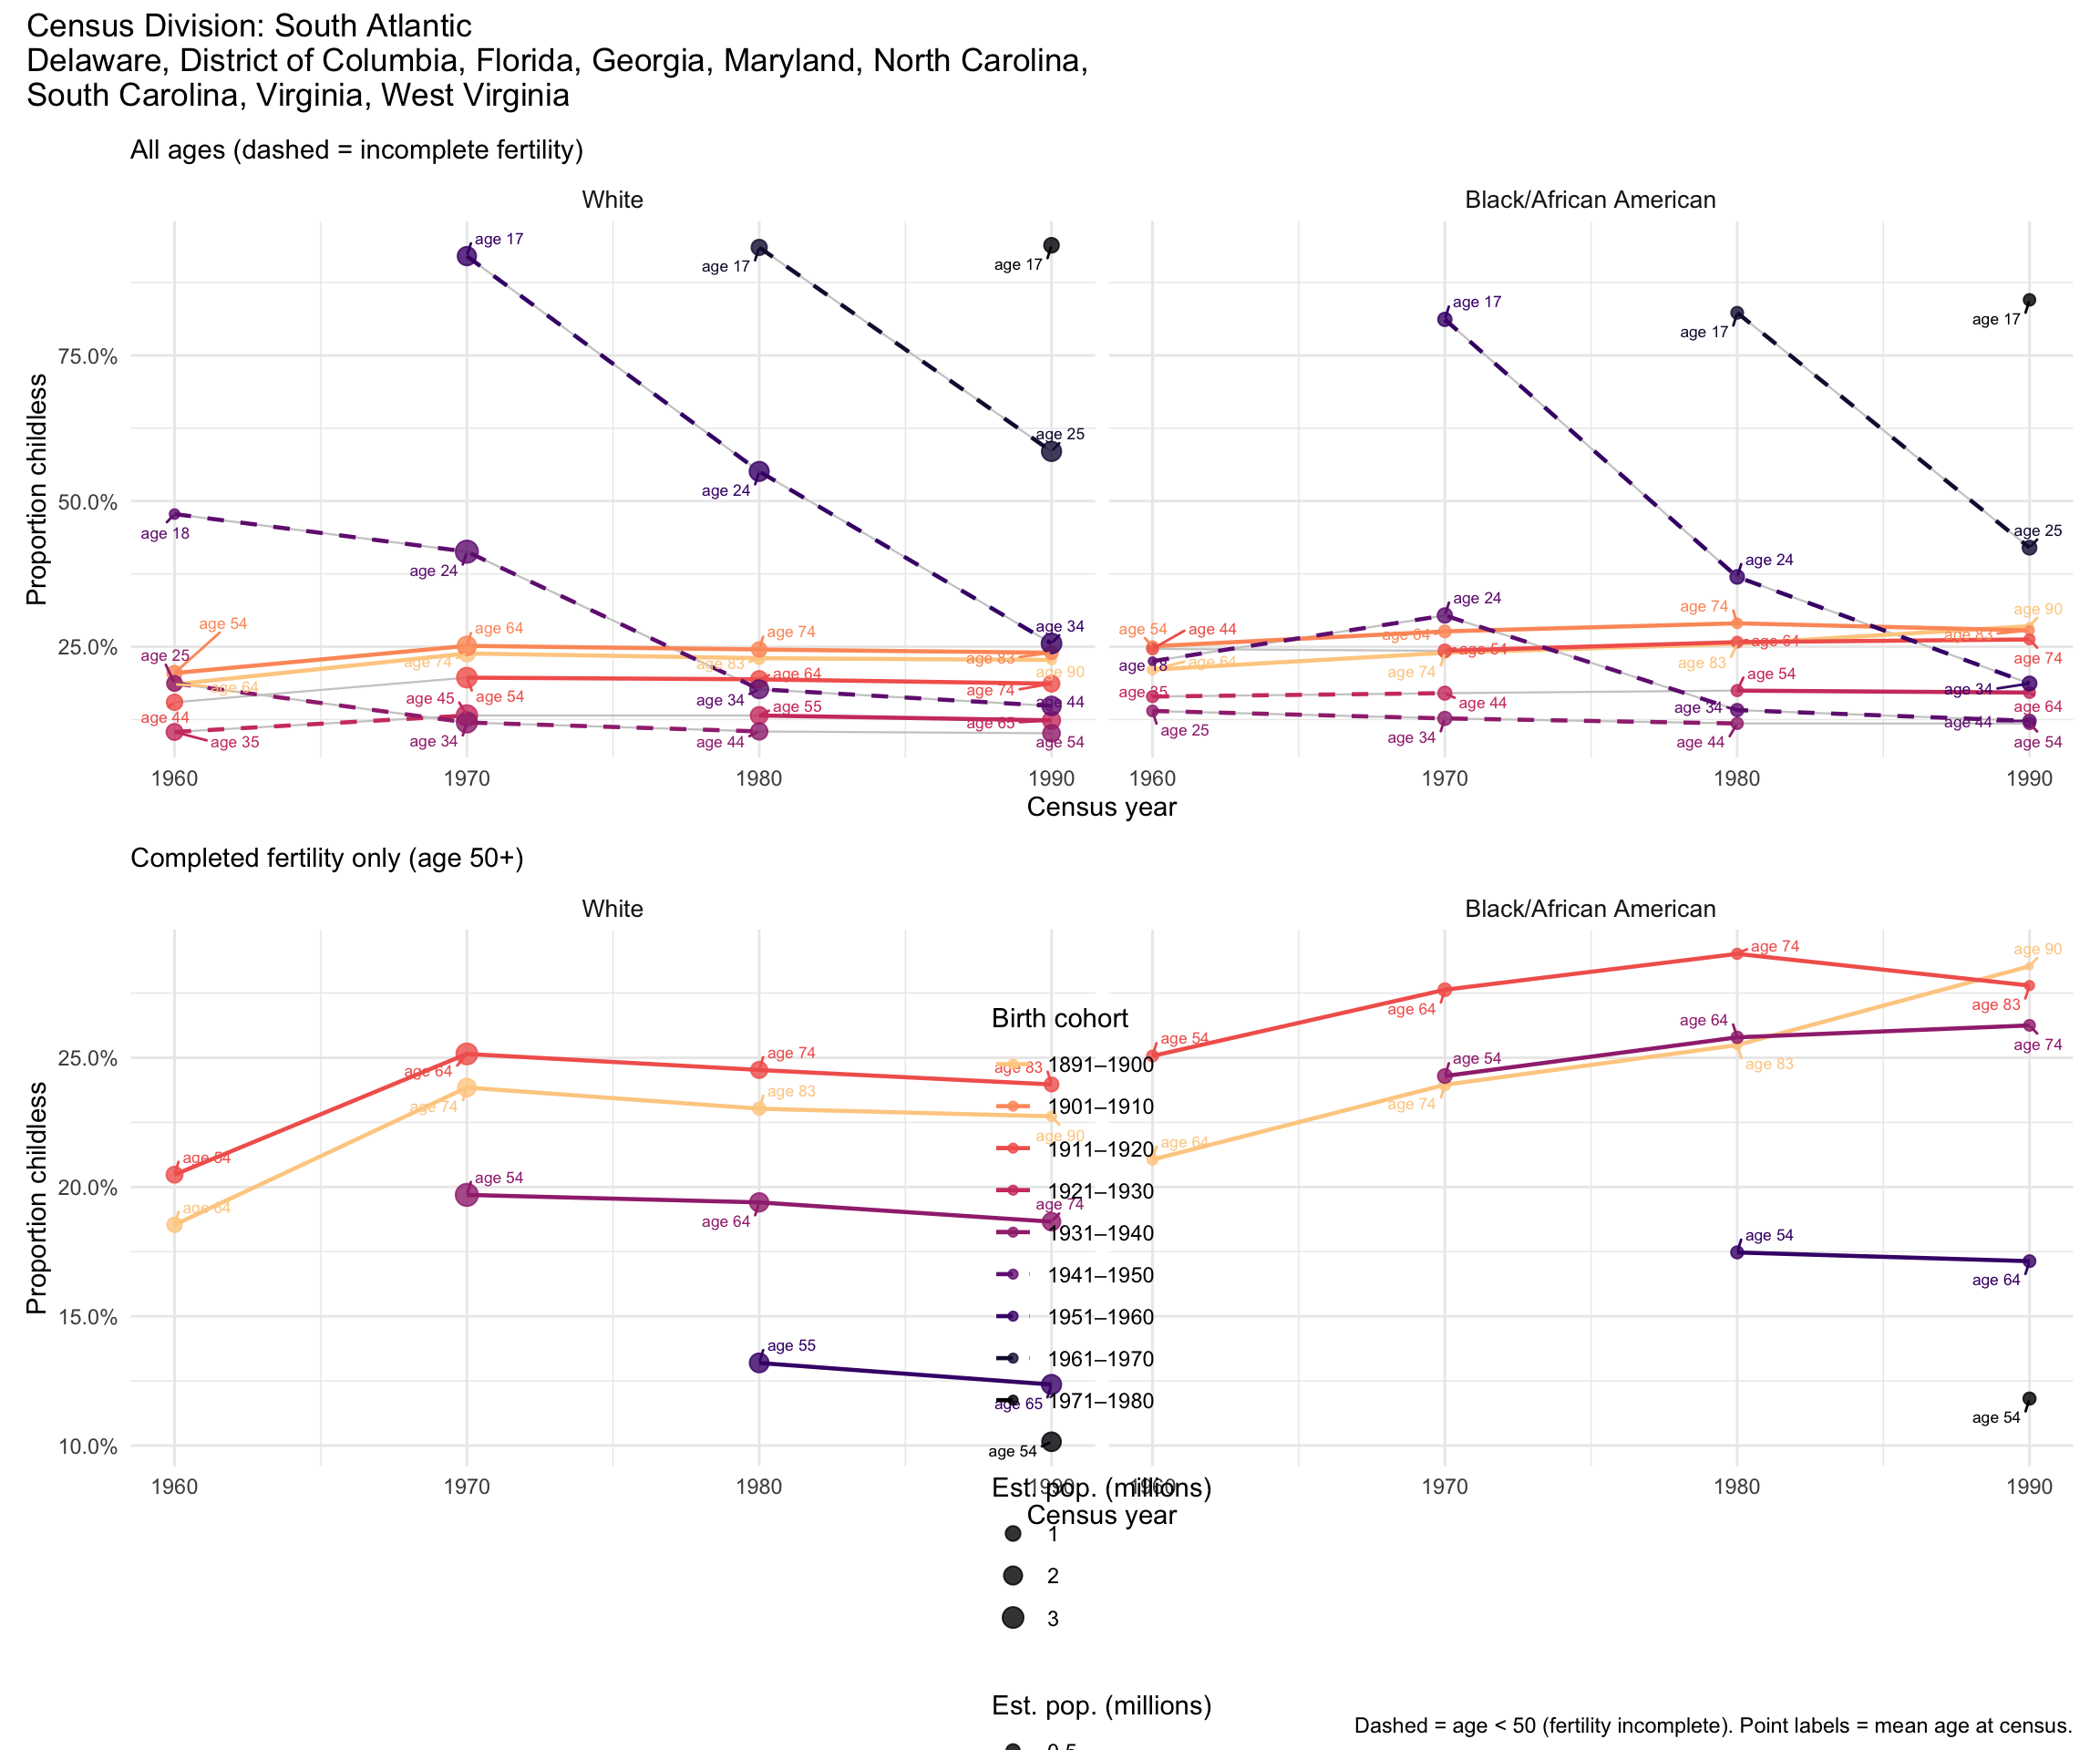
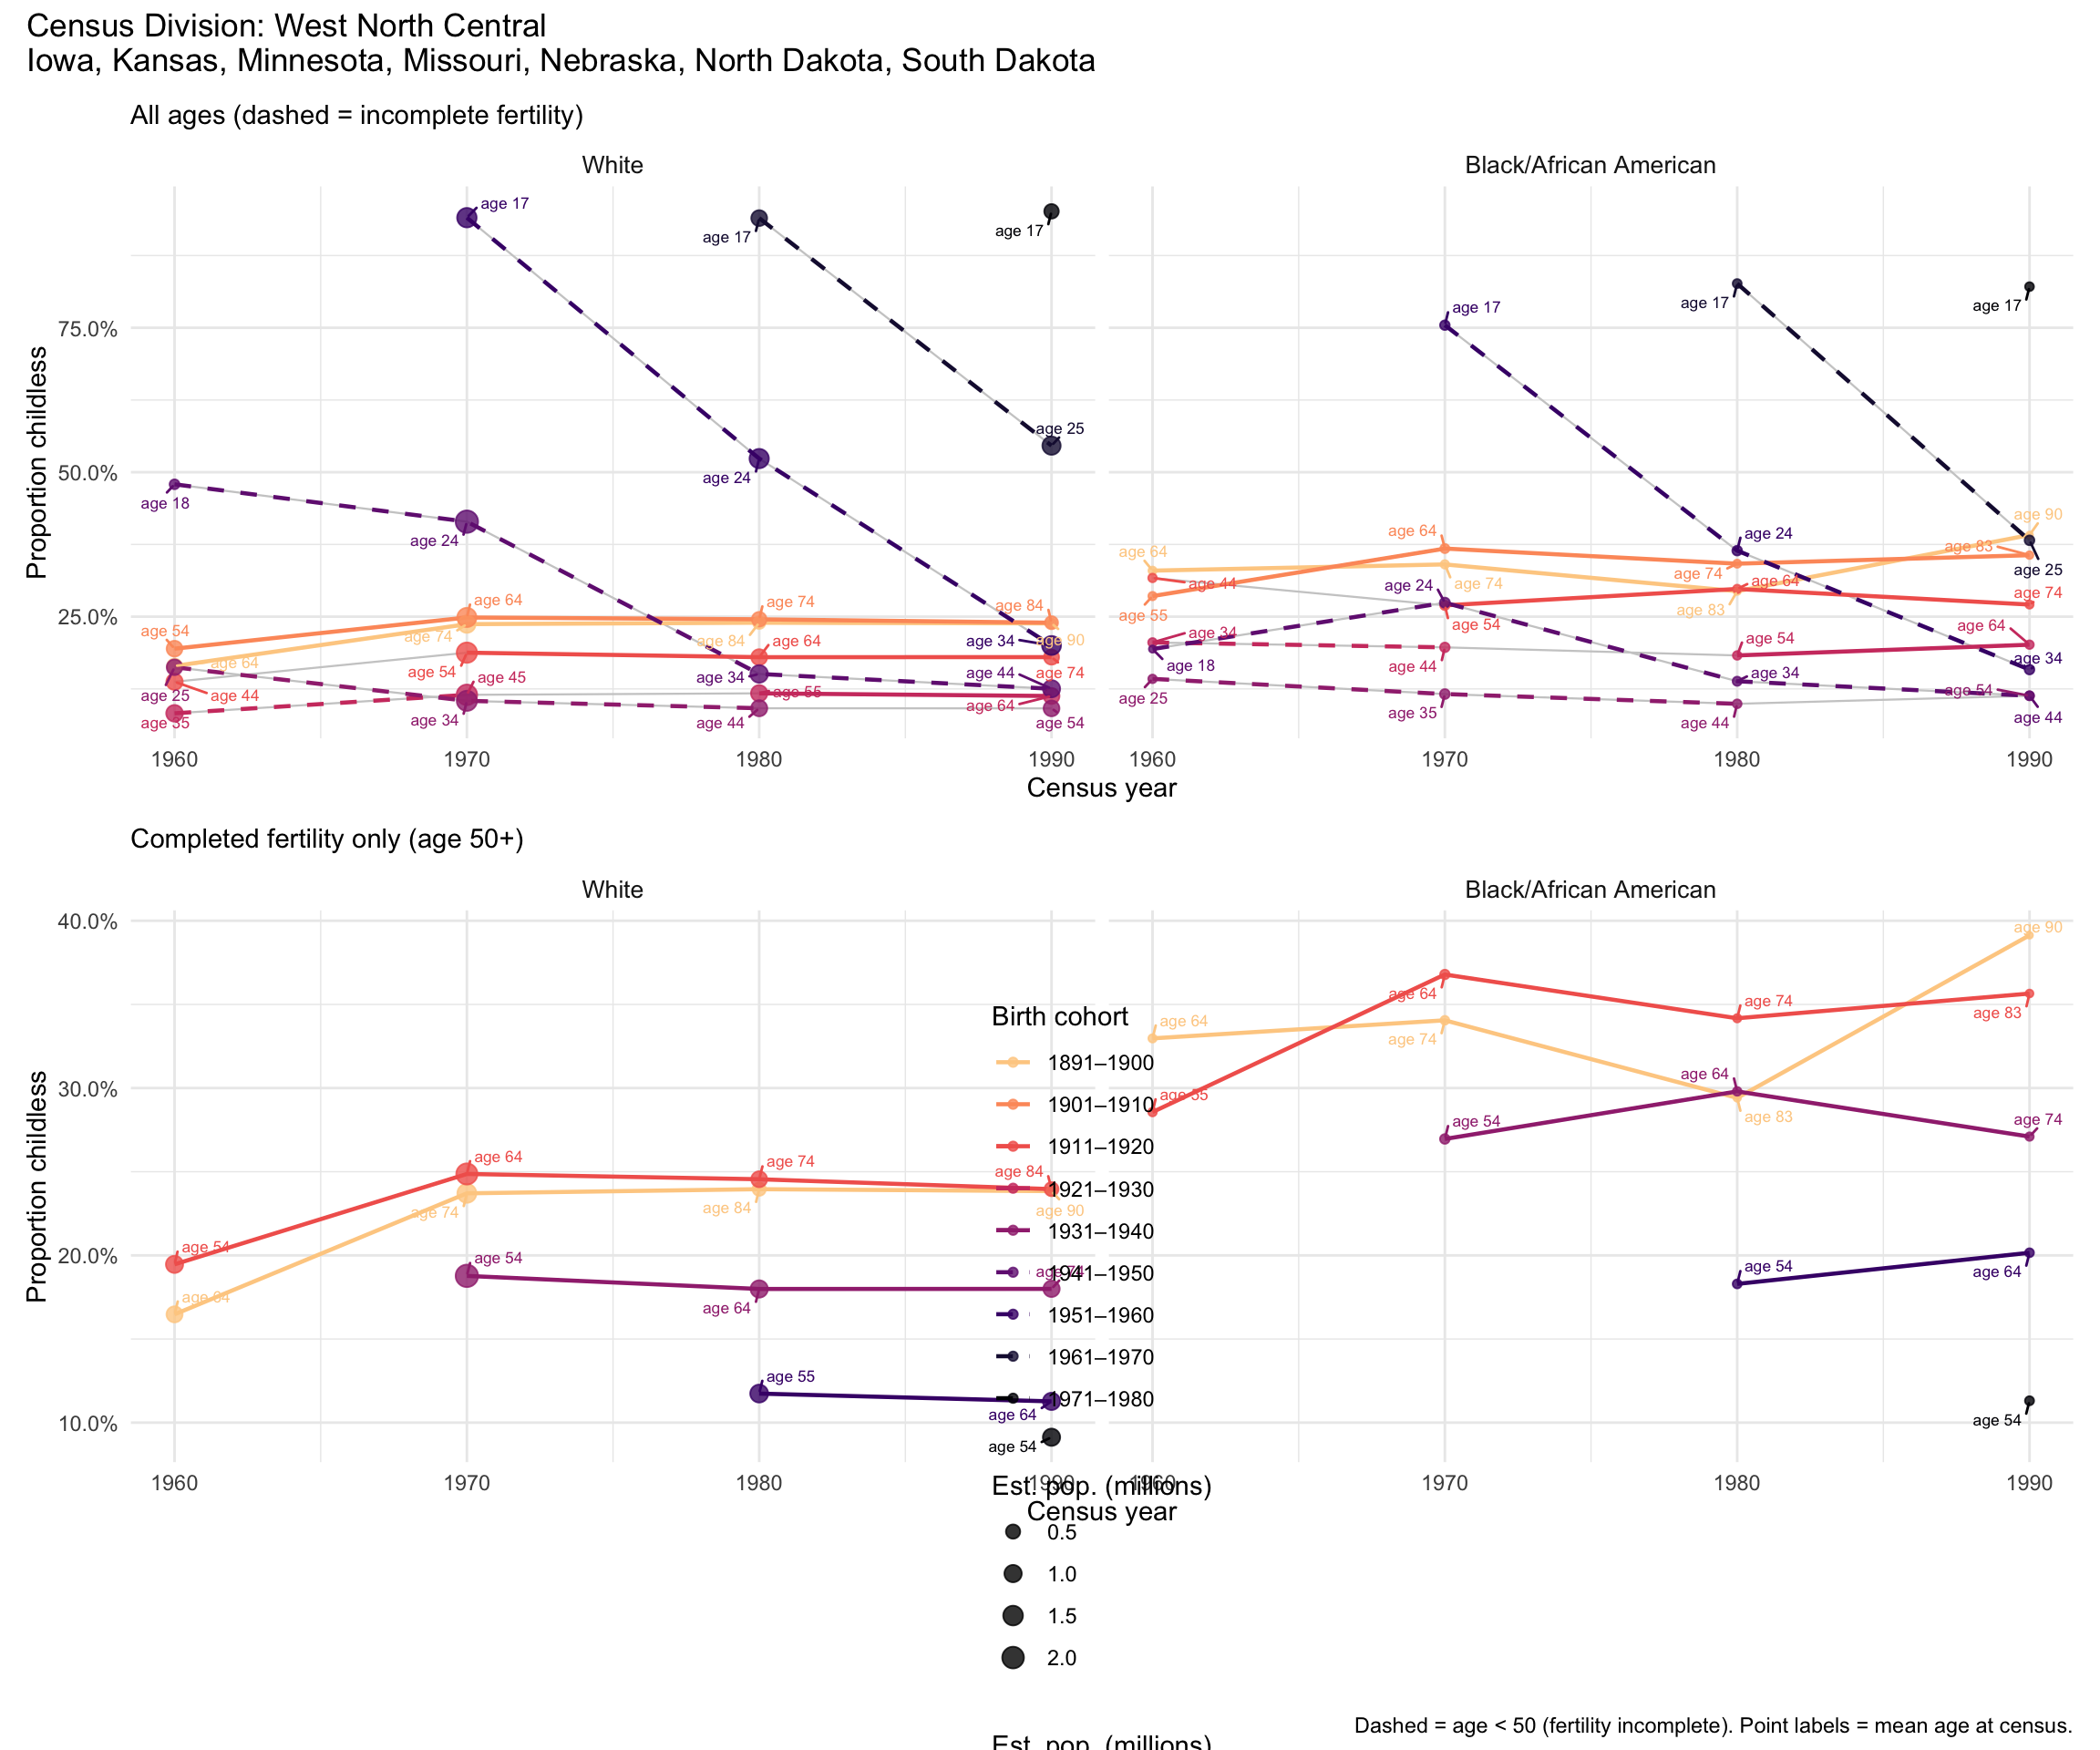
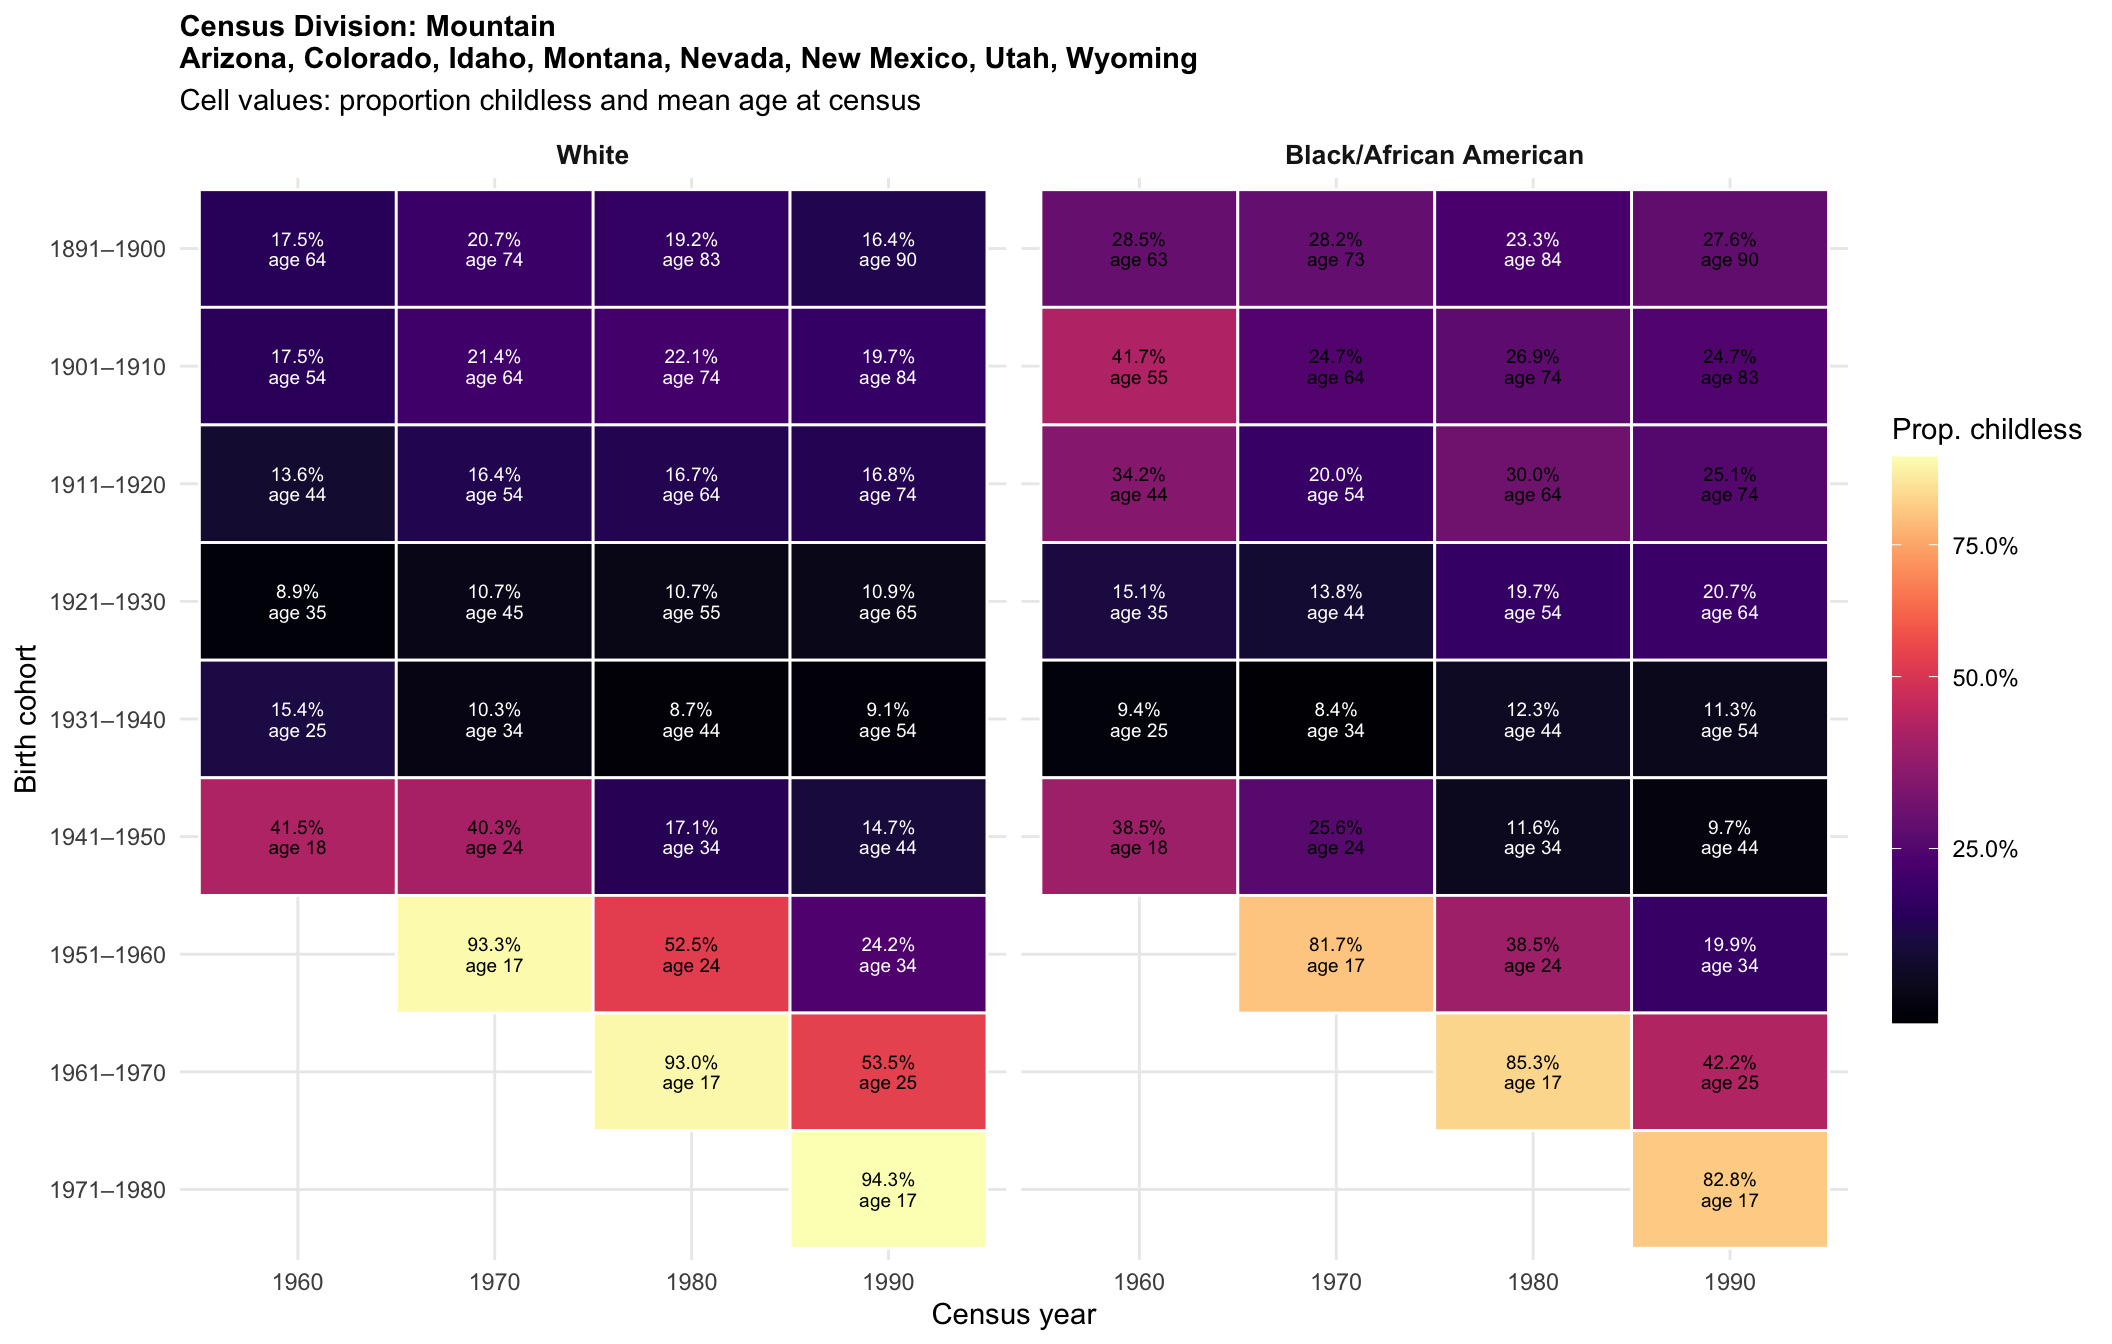
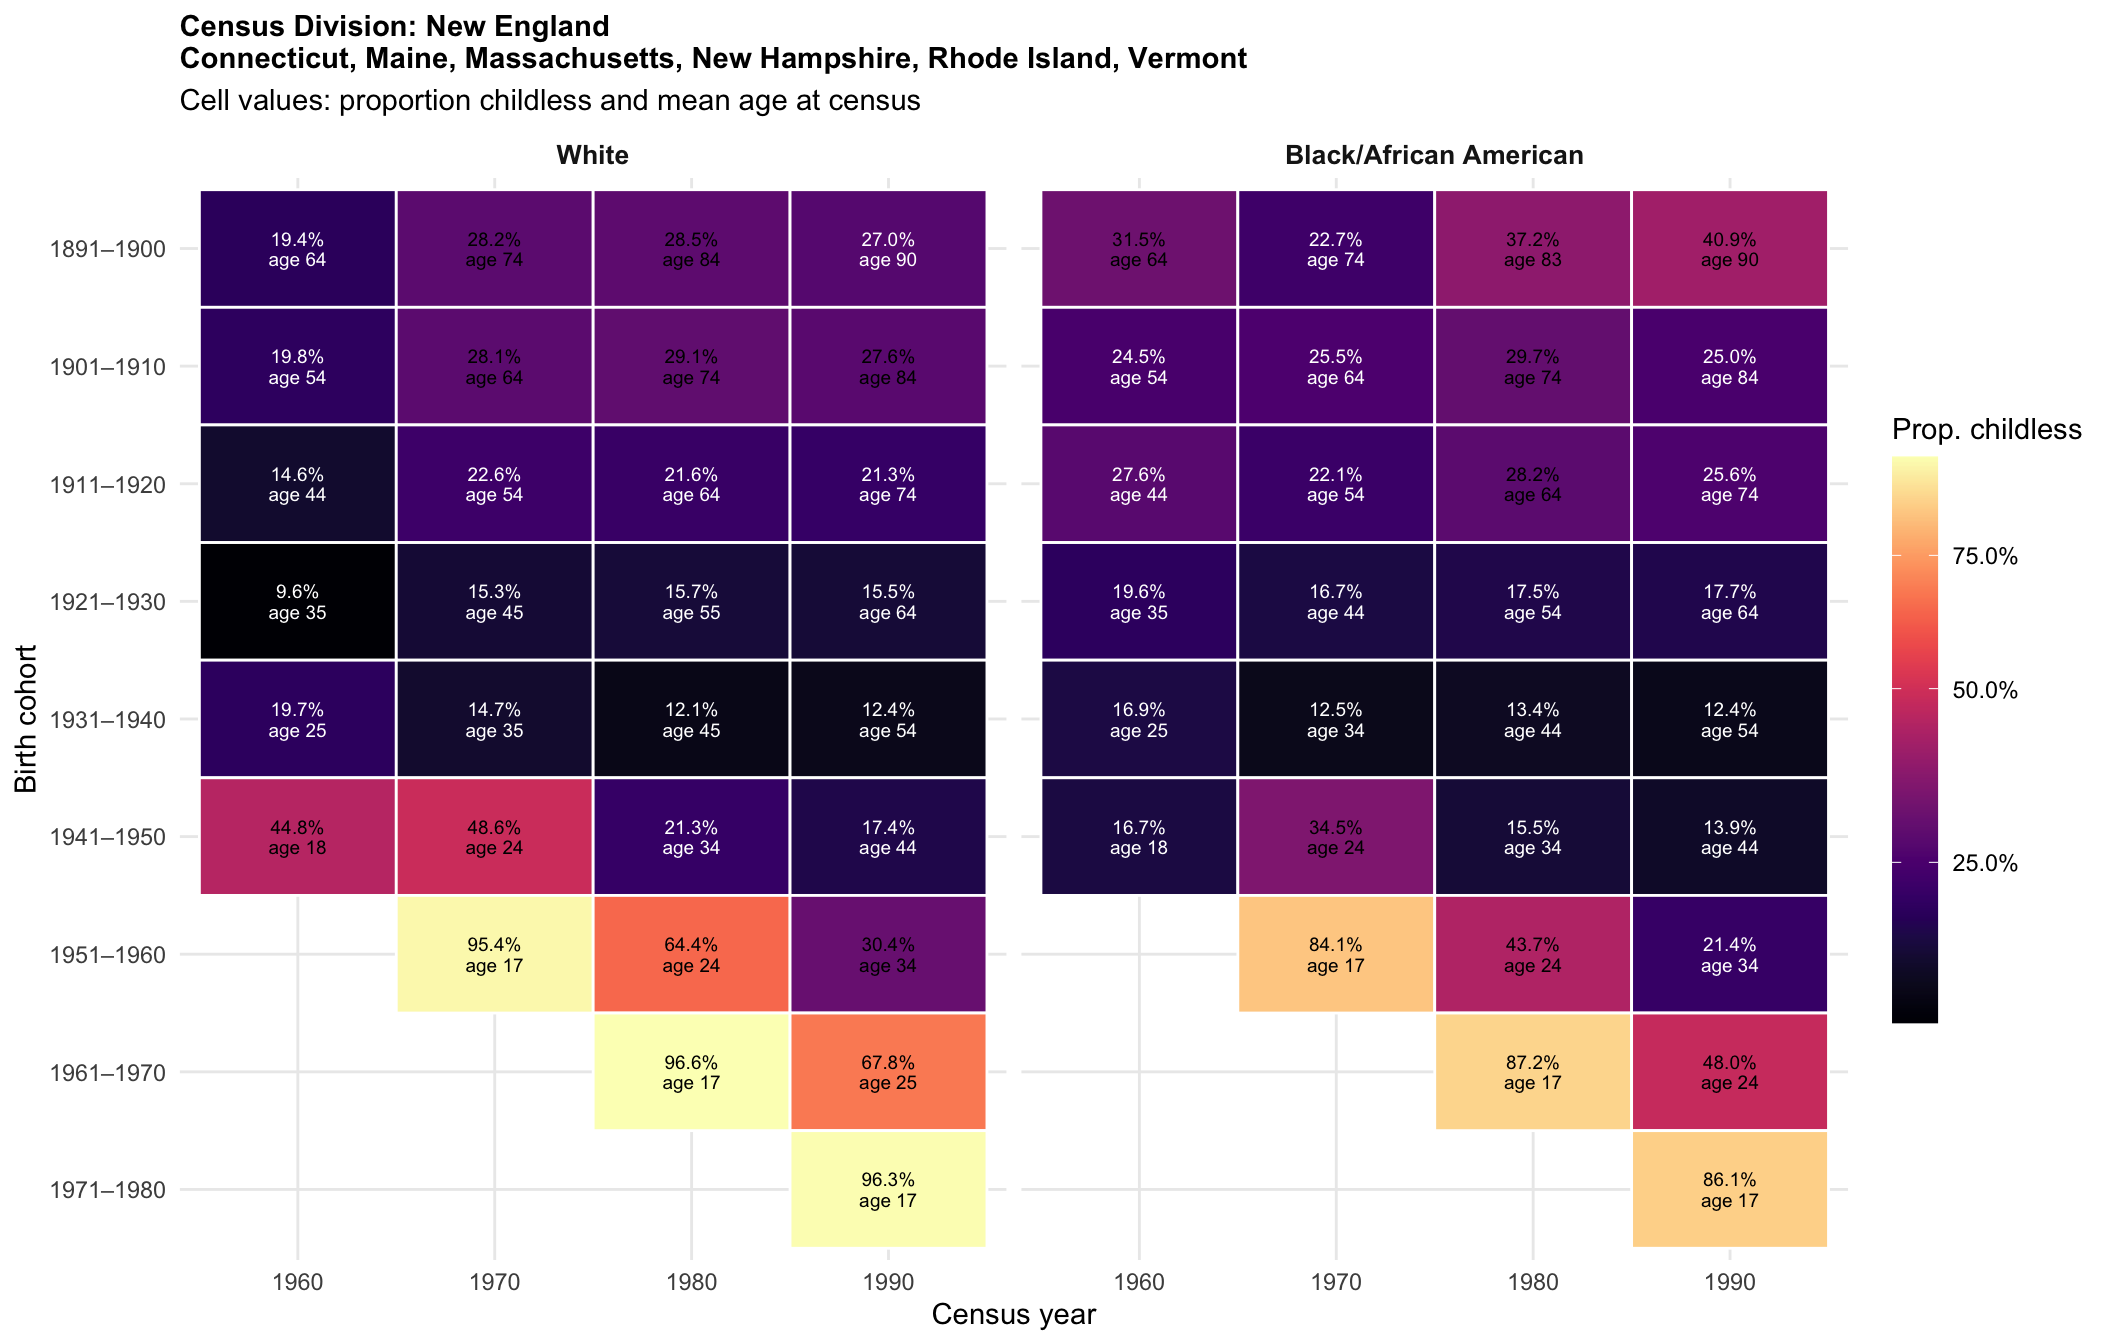
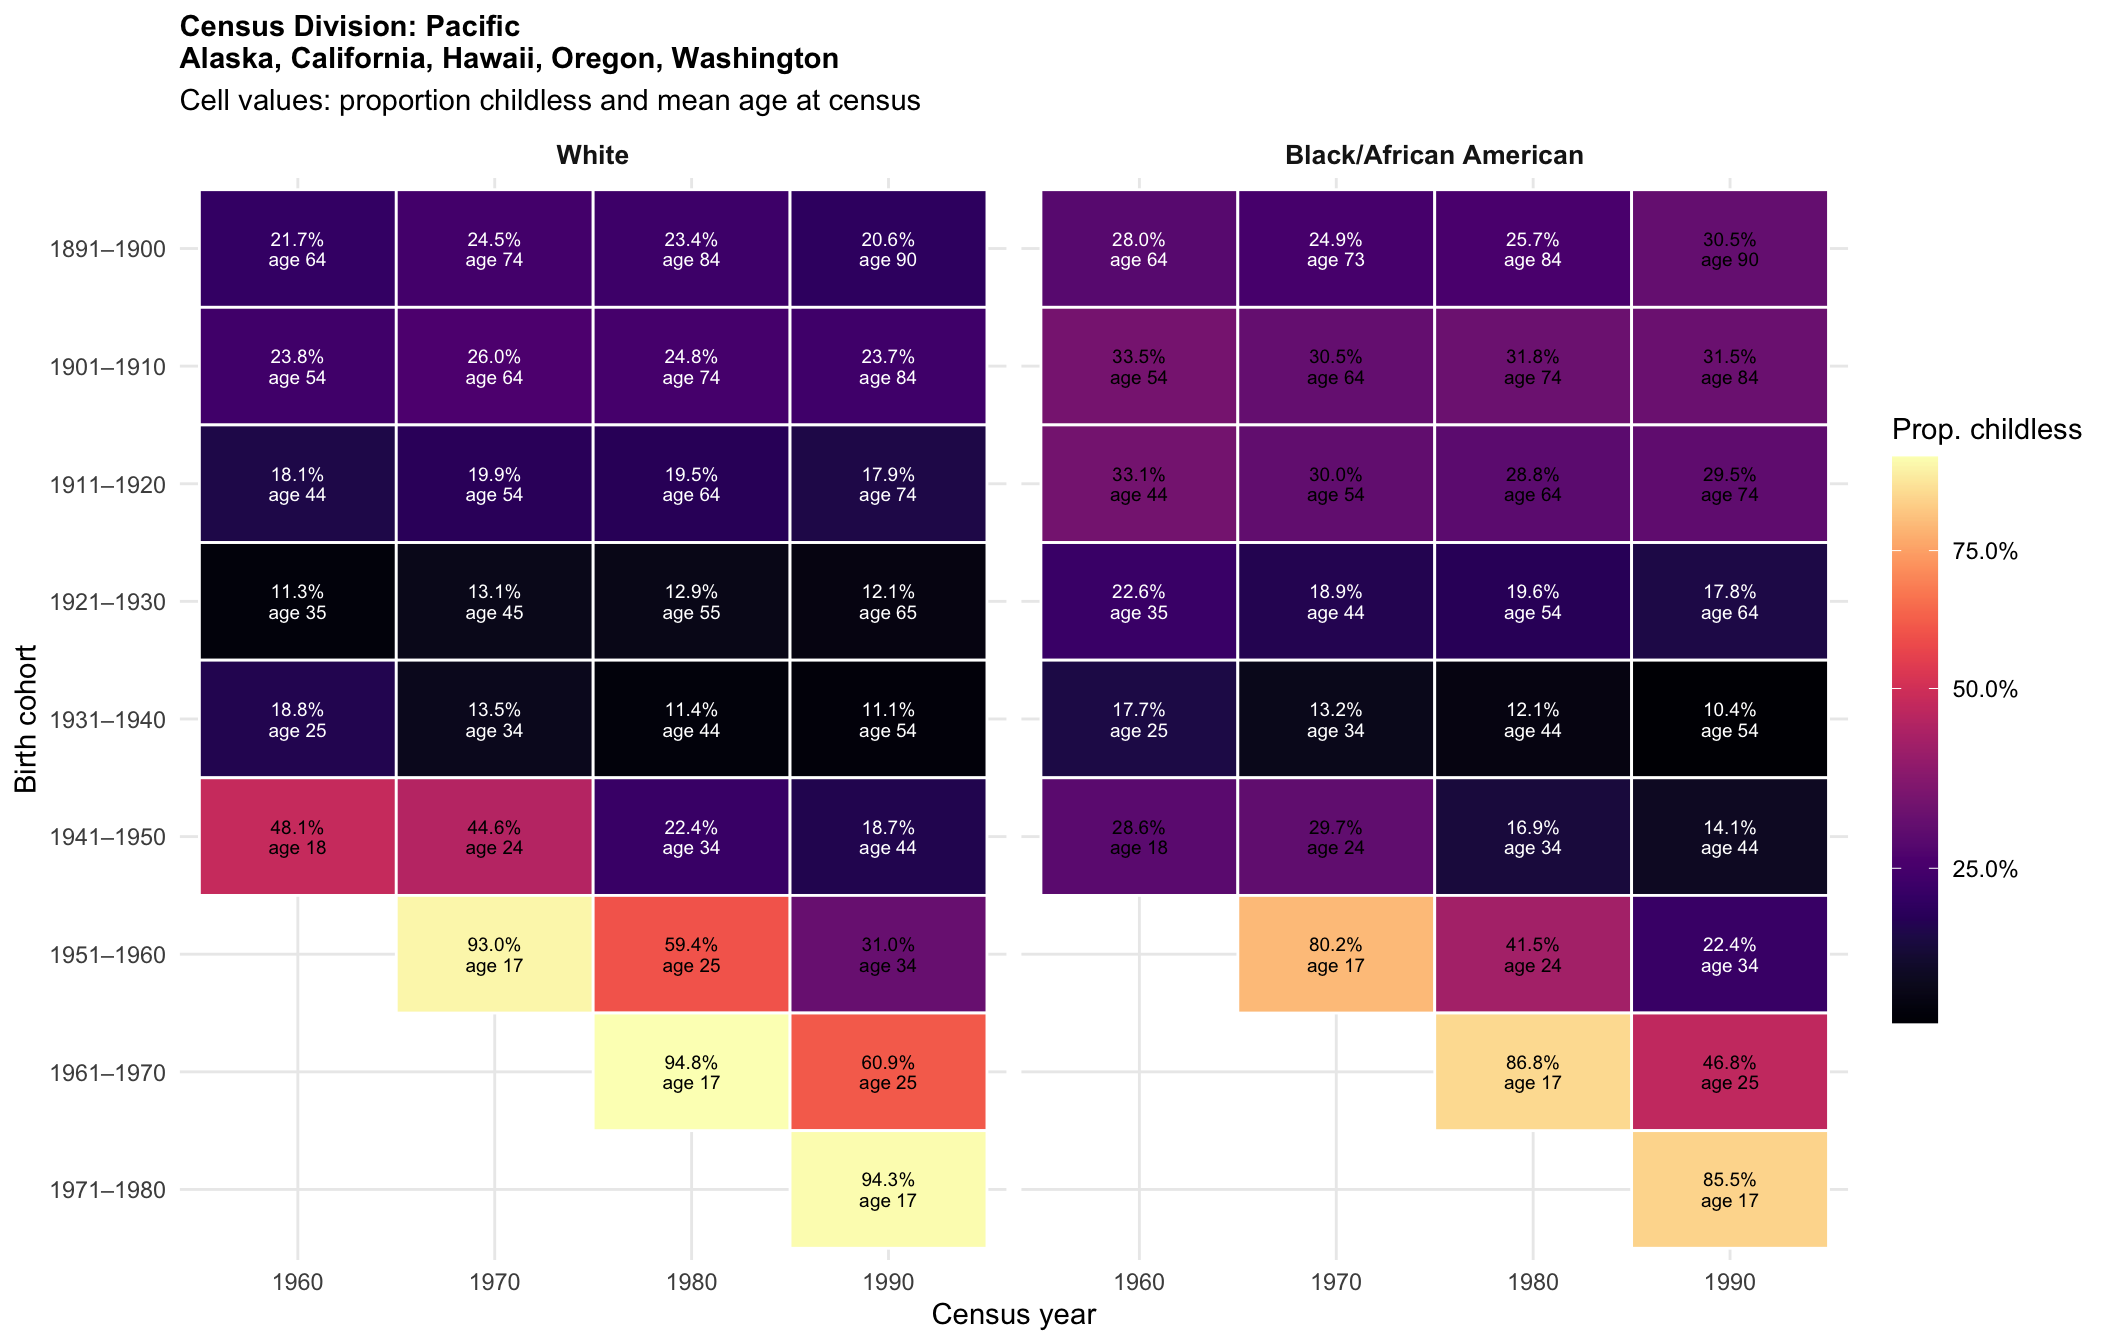
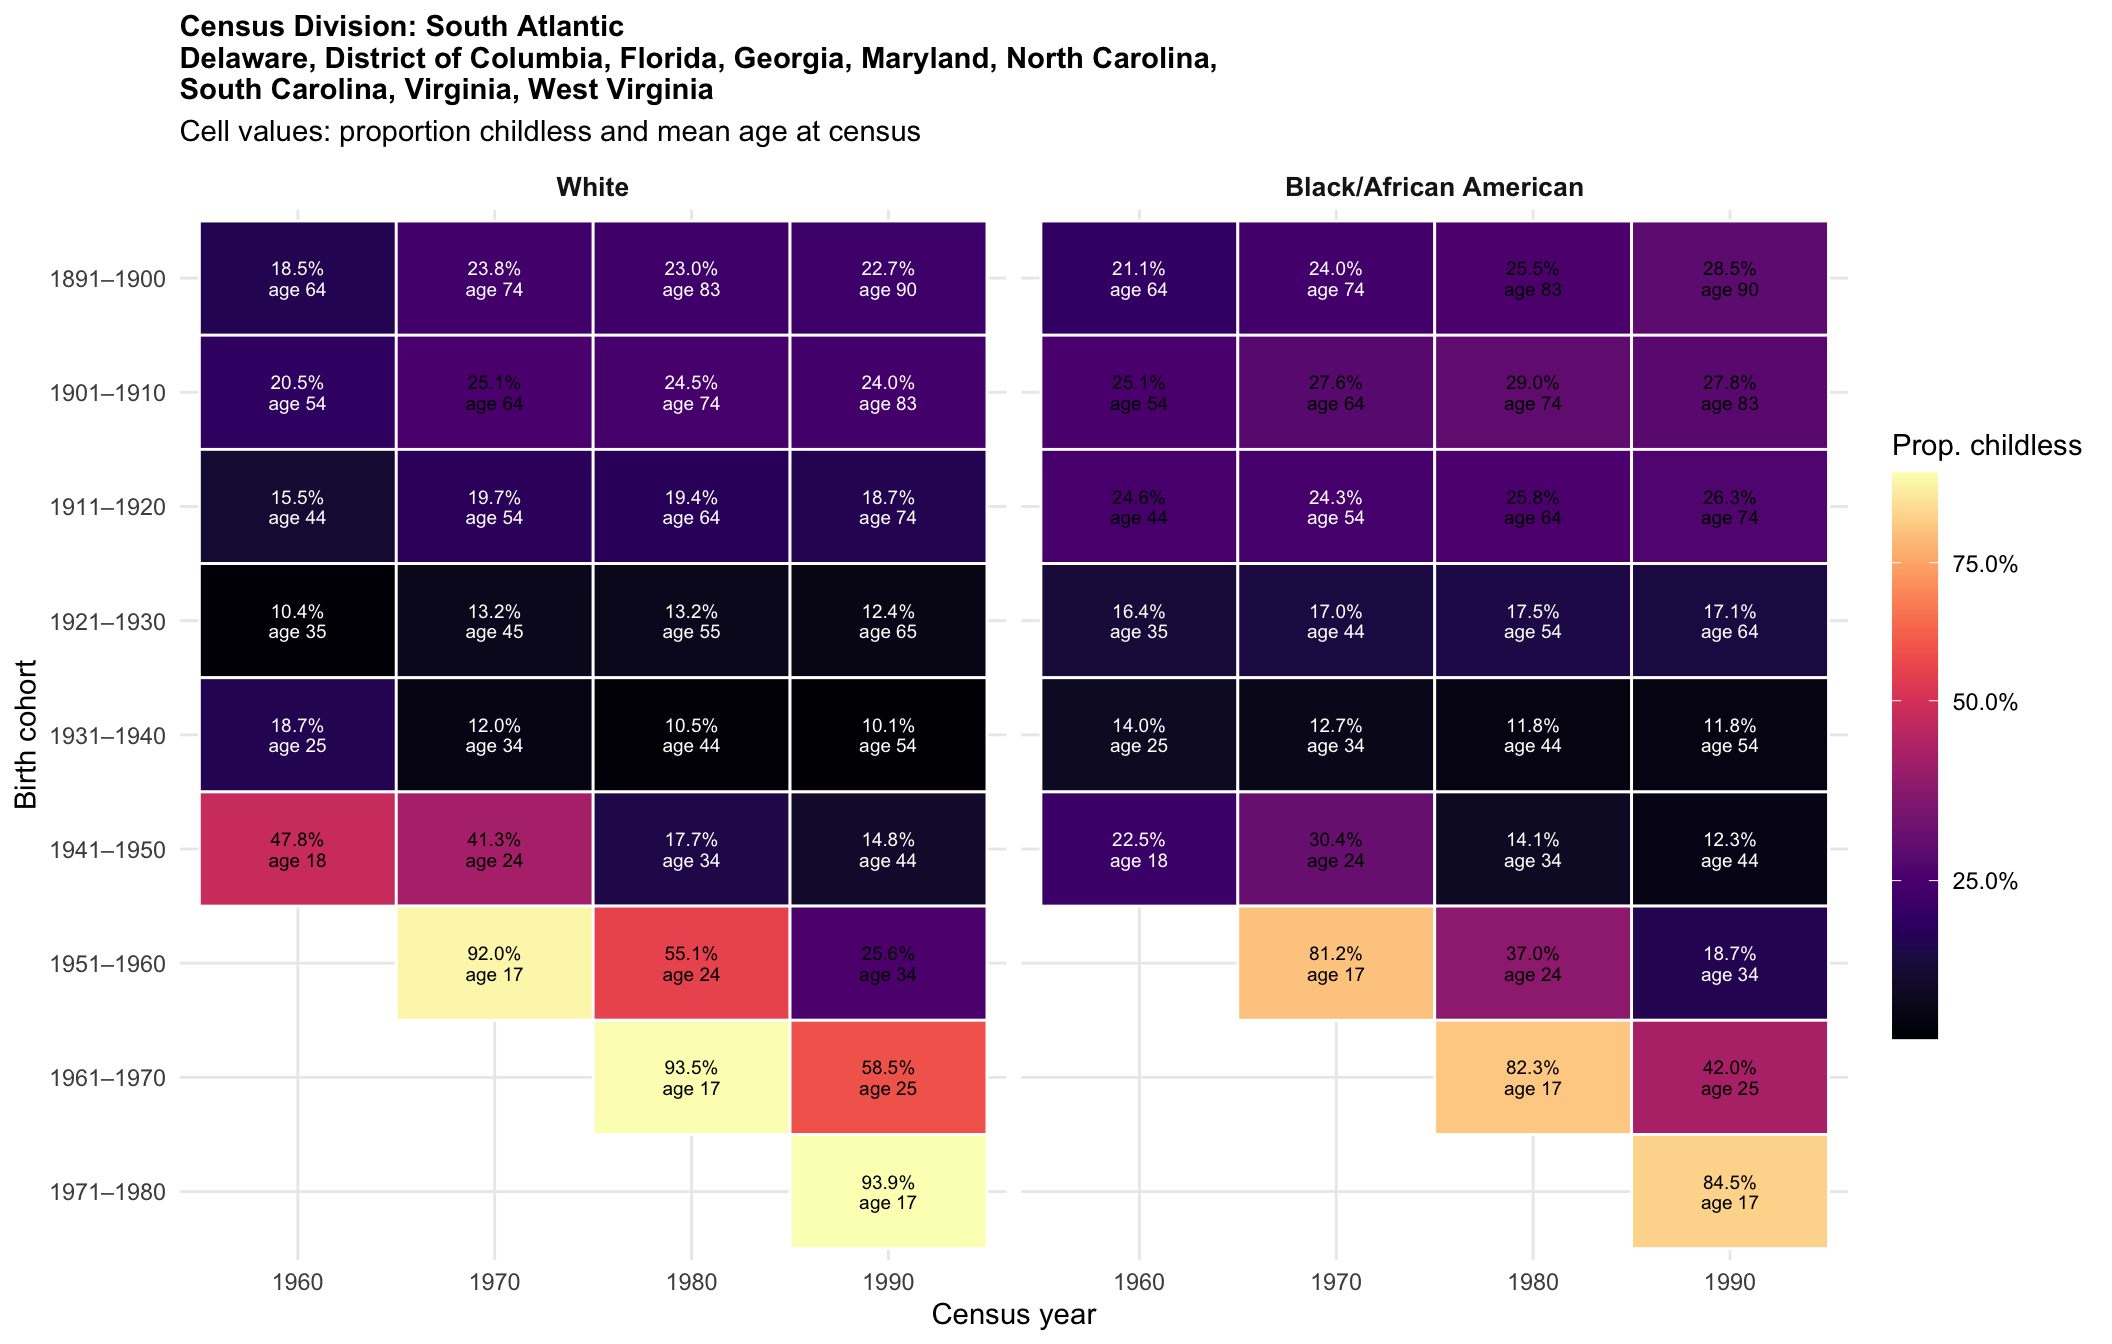
We track the proportion childless for birth cohorts as they age across census waves. Each cohort × age combination maps to exactly one census year, shown in all panels. Because CHBORN is completed-fertility-equivalent only at 50+, we exclude the 40–49 age group.
Observable cohort matrix (age at each census year):
| Cohort | 1960 | 1970 | 1980 | 1990 |
|---|---|---|---|---|
| 1891–1900 | 60–69 | 70–79 | 80–89 | — |
| 1901–1910 | 50–59 | 60–69 | 70–79 | 80–89 |
| 1911–1920 | 40–49 | 50–59 | 60–69 | 70–79 |
| 1921–1930 | 30–39 | 40–49 | 50–59 | 60–69 |
| 1931–1940 | 20–29 | 30–39 | 40–49 | 50–59 |
| 1941–1950 | — | 20–29 | 30–39 | 40–49 |
| 1951–1960 | — | — | 20–29 | 30–39 |
| 1961–1970 | — | — | — | 20–29 |
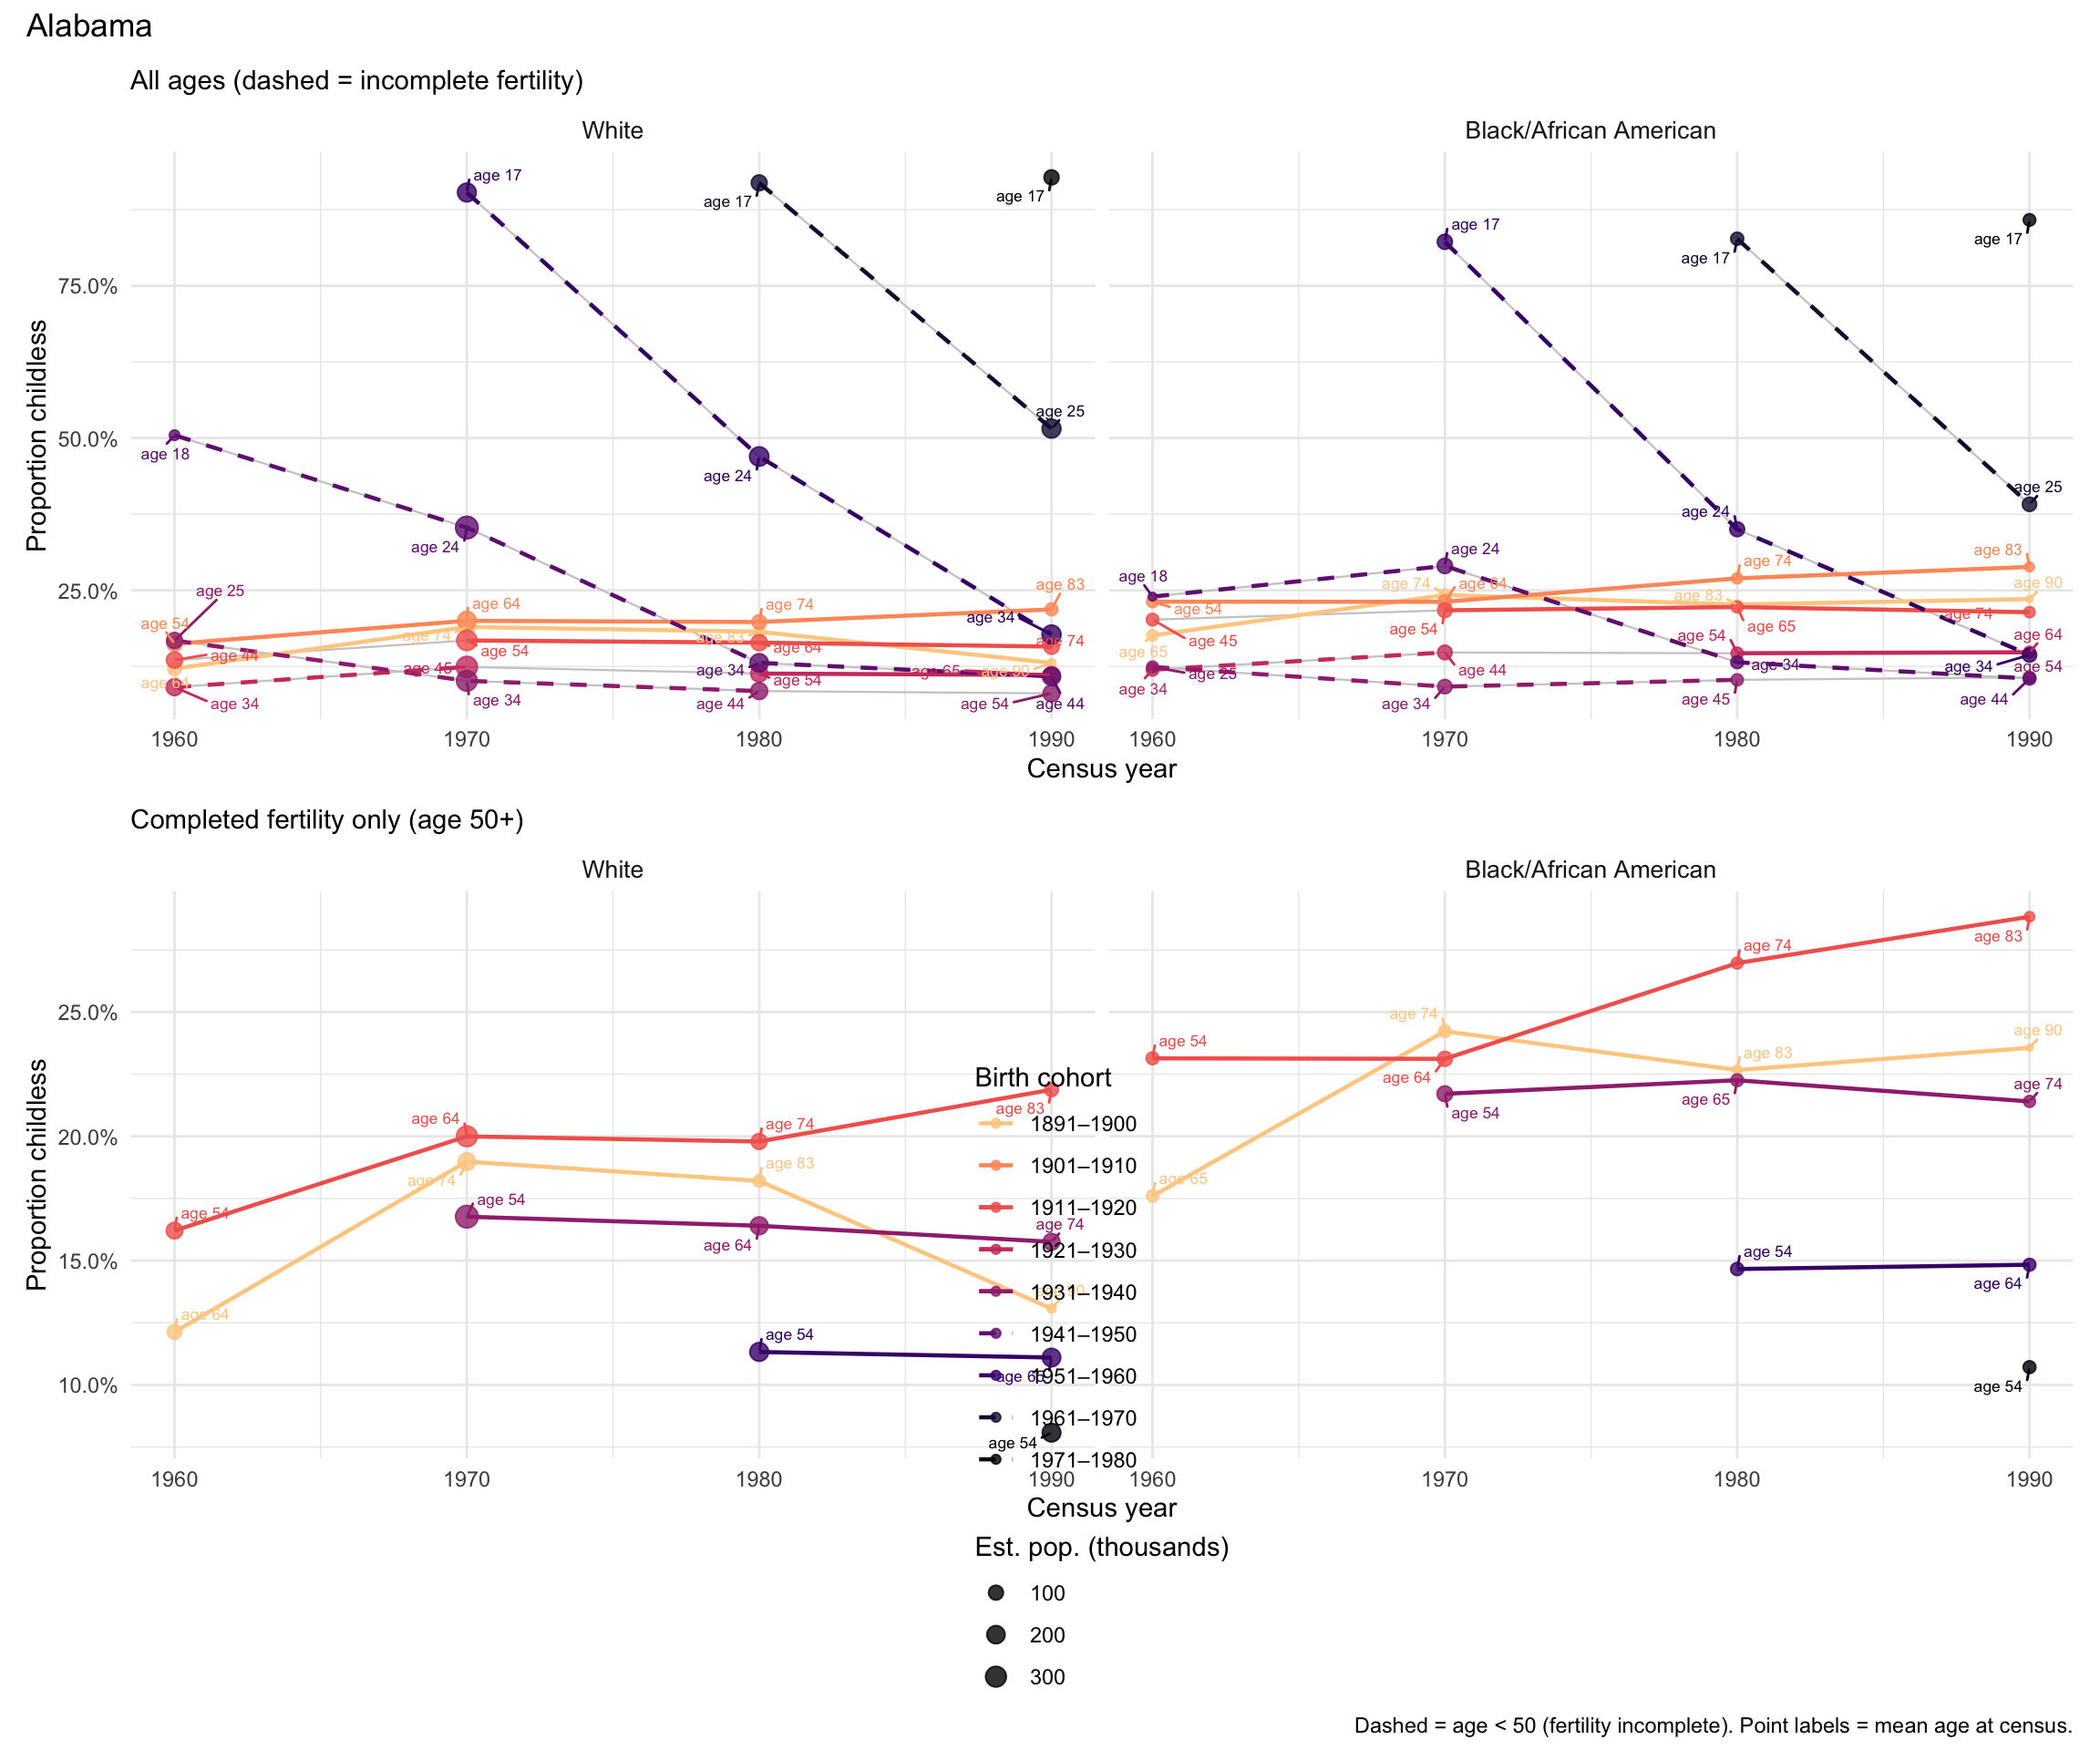
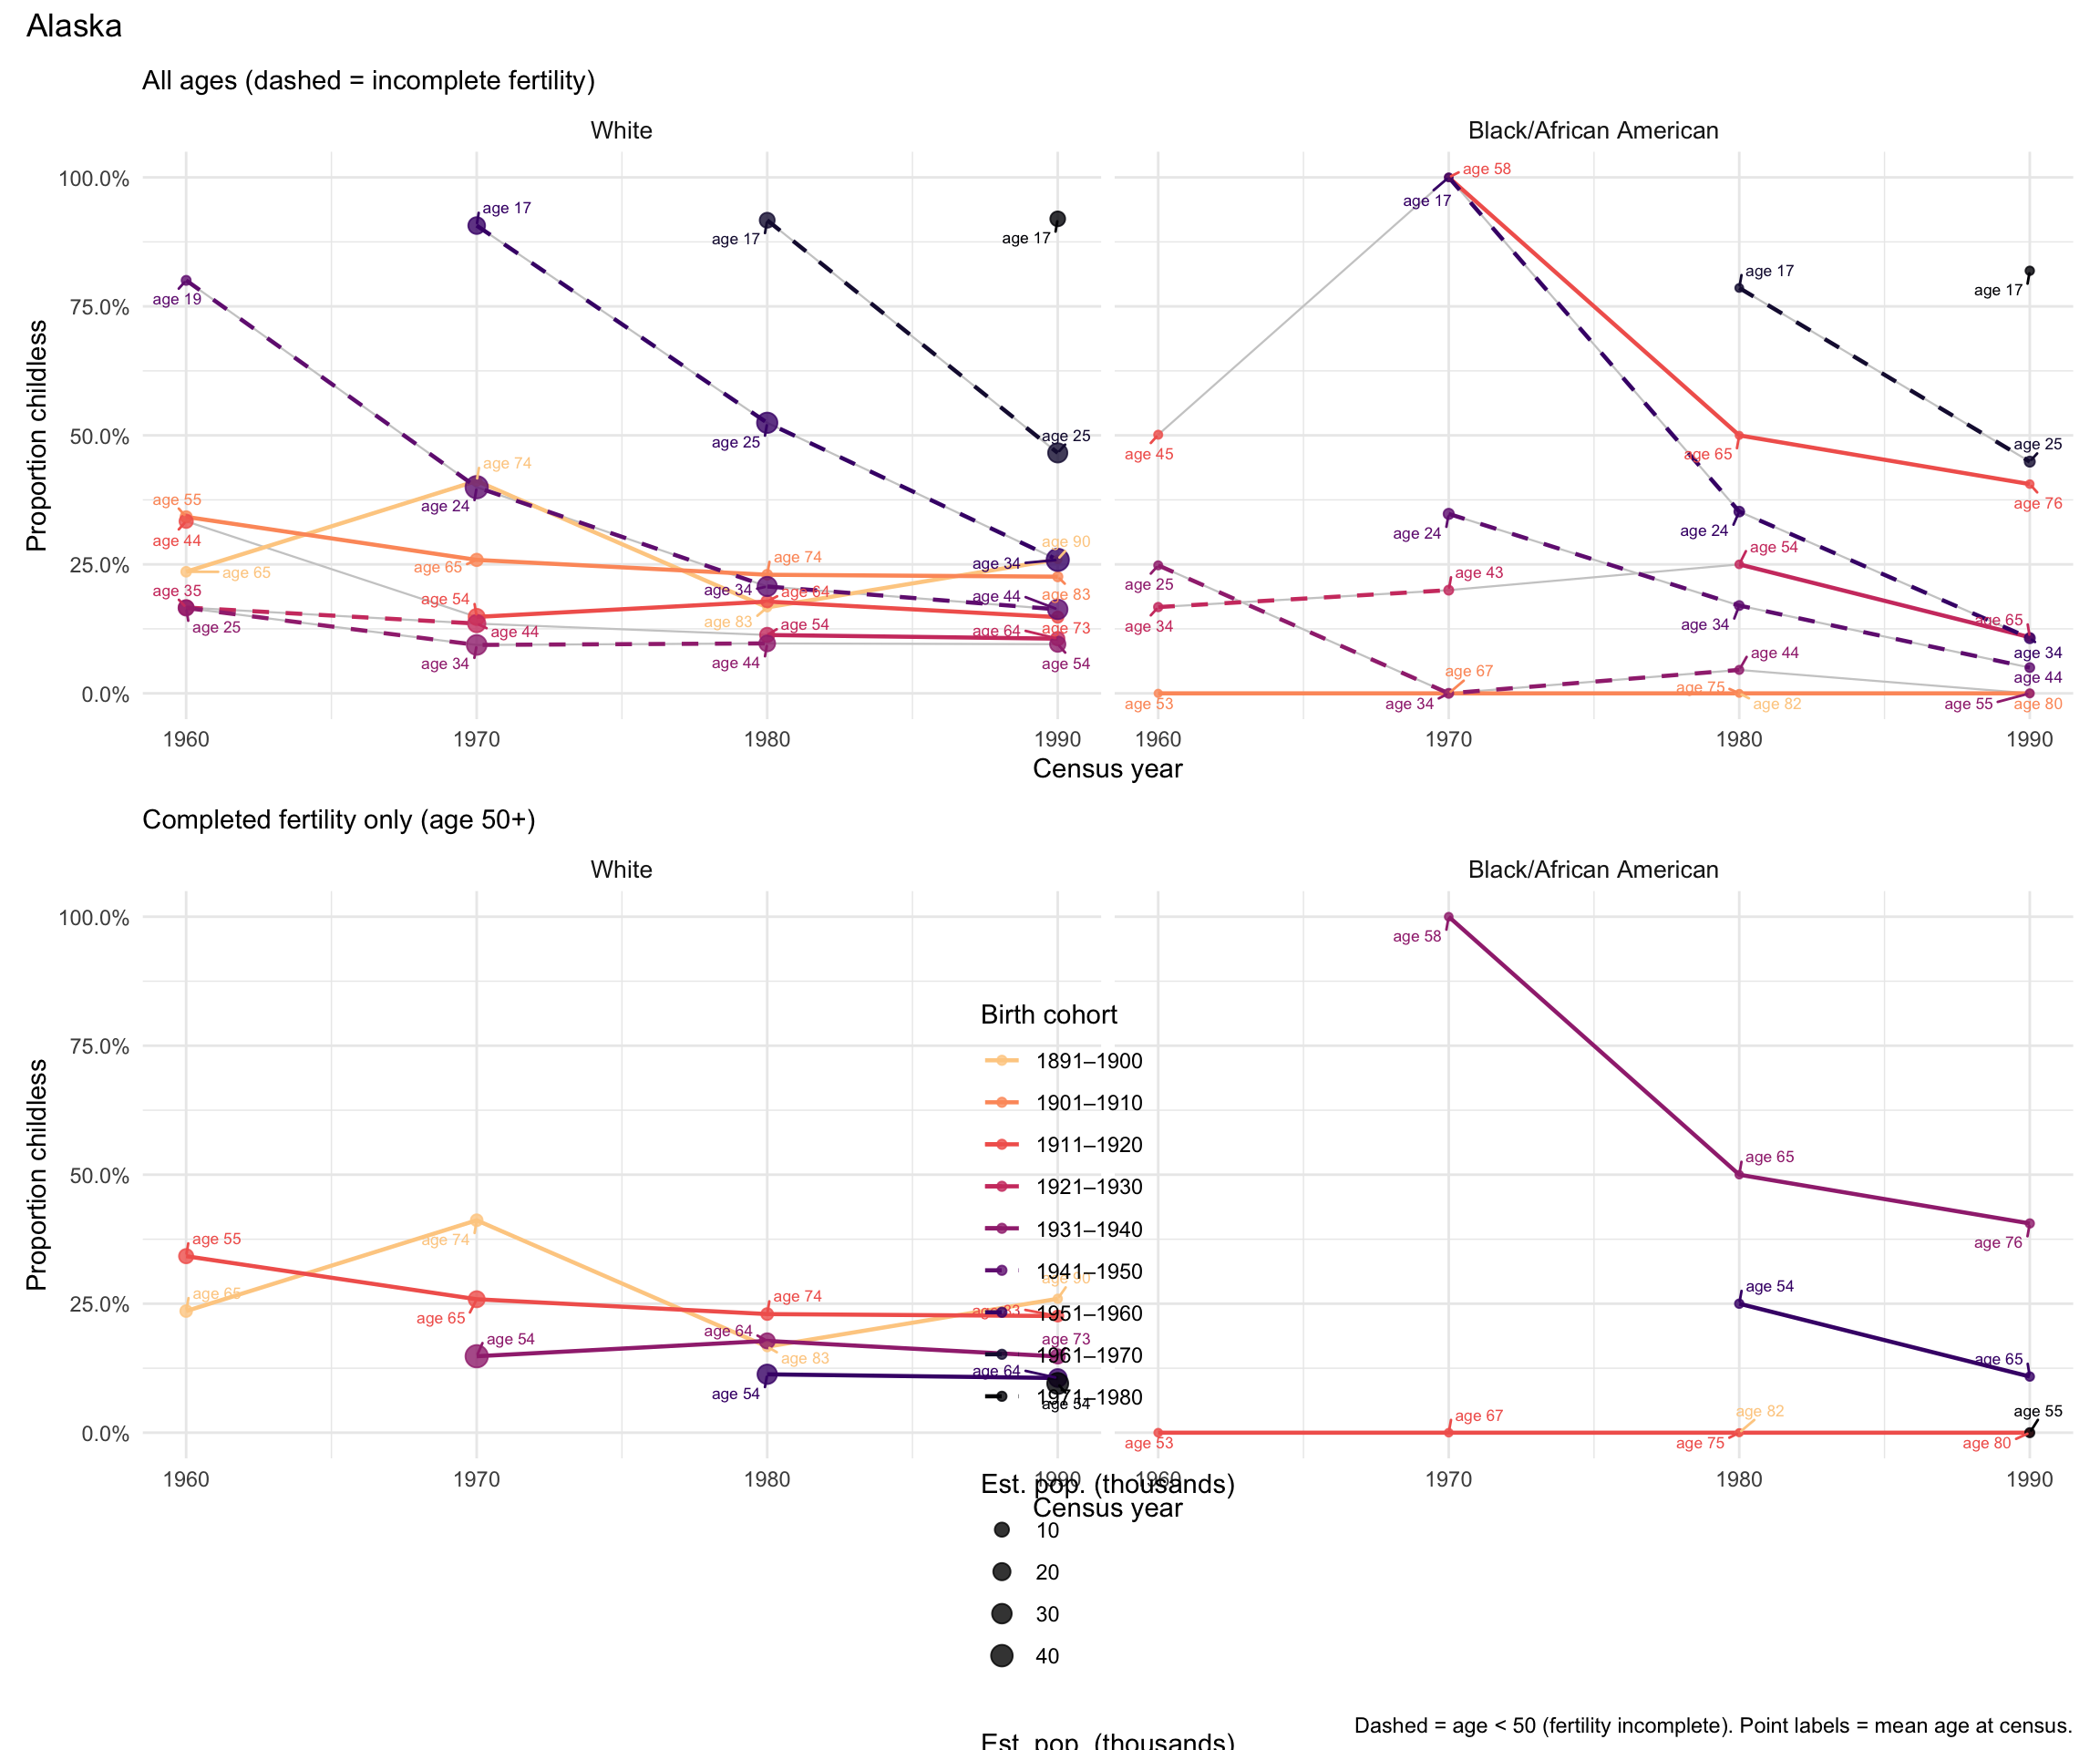
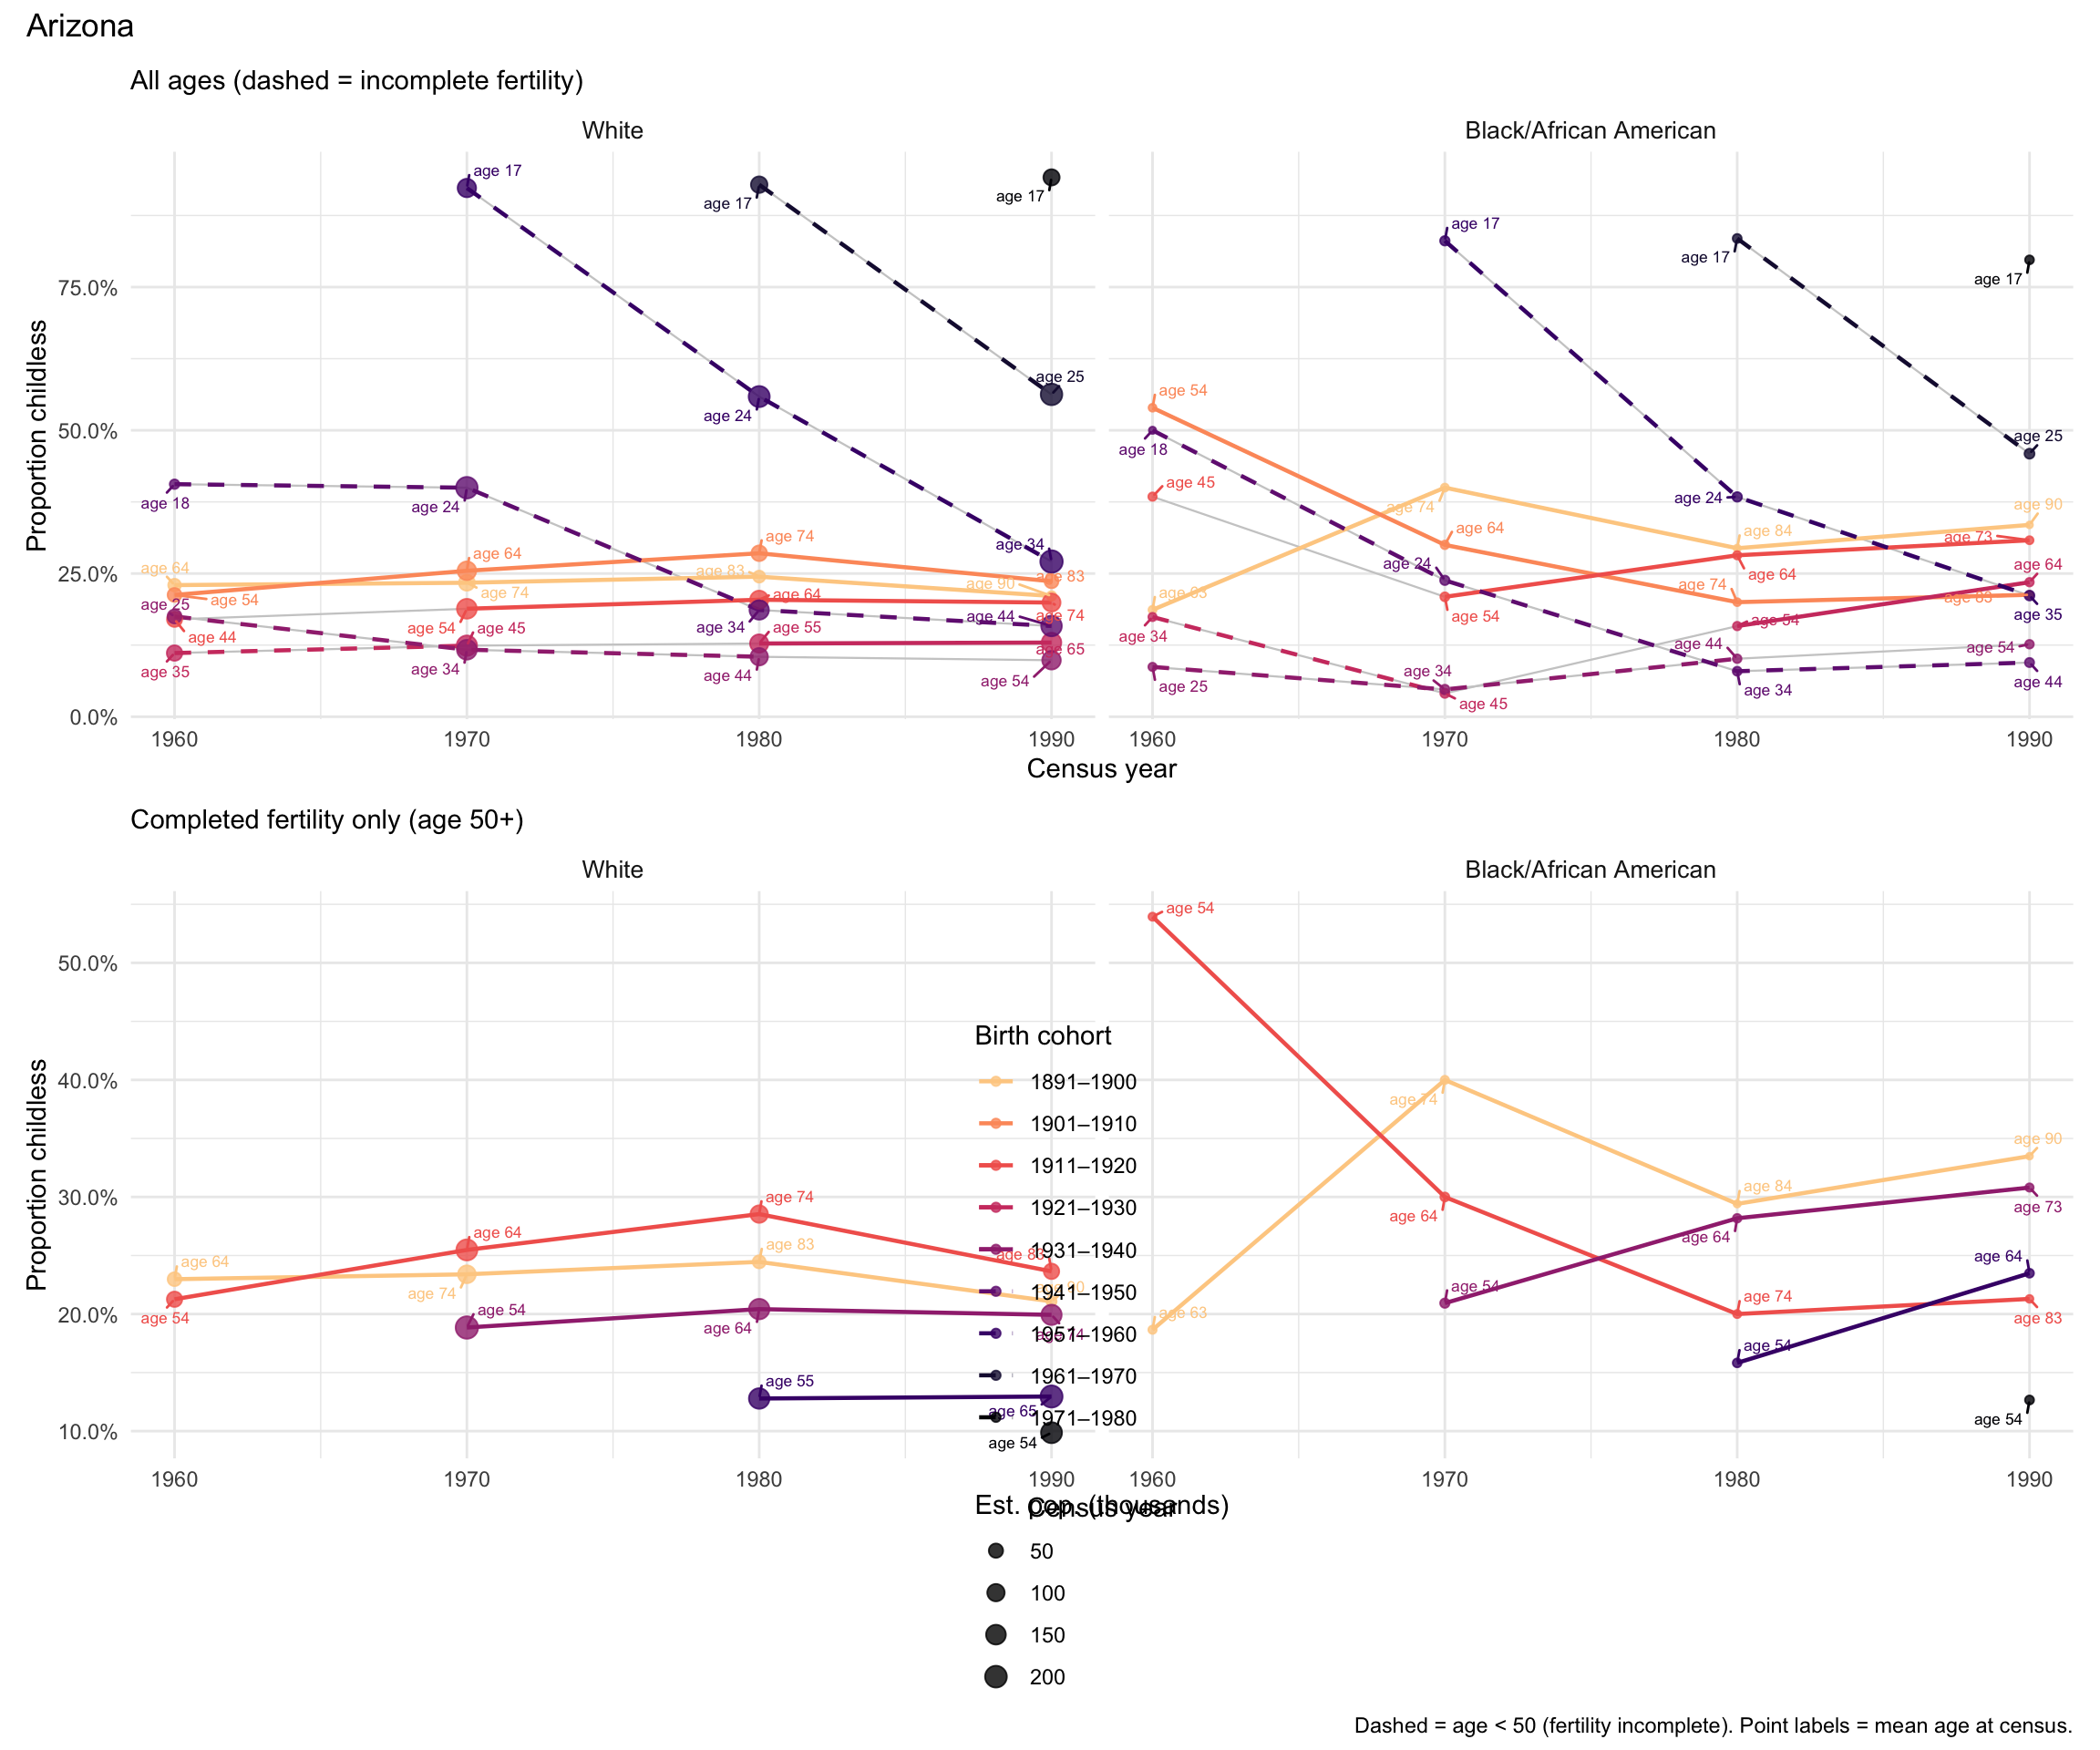
Bold = first completed-fertility observation (50+). Dashed lines in plots = incomplete fertility.
Survivorship bias: prop_zero may appear to rise as a cohort ages because women with children may have different mortality than childless women. Treat increases at ages 70–89 with caution.
data_cohort <- data_raw %>%
  prepare_cohort_sample() %>%
  mutate(state_name = as.character(STATEFIP))

# Cohorts observable in our 1960-1990 data across all age groups:
# Older cohorts (50+ completed fertility) + younger cohorts (20s-40s, incomplete)
cohorts_of_interest <- c(
  "1891–1900", "1901–1910", "1911–1920", "1921–1930",
  "1931–1940", "1941–1950", "1951–1960", "1961–1970",
  "1971–1980"
)

cat("Cohort data dimensions:", nrow(data_cohort), "rows\n")
Cohort data dimensions: 10740215 rowscat("Age ranges:", levels(droplevels(data_cohort$AGE_RANGE)), "\n")Age ranges: 15-19 20-29 30-39 40-49 50-59 60-69 70-79 80-89 cat("Cohorts:", levels(droplevels(data_cohort$cohort_label)), "\n")Cohorts: 1851–1860 1861–1870 1871–1880 1881–1890 1891–1900 1901–1910 1911–1920 1921–1930 1931–1940 1941–1950 1951–1960 1961–1970 1971–1980 9a. National cohort trajectories
cohort_national <- data_cohort %>%
  group_by(cohort_label, YEAR, AGE_RANGE, RACE) %>%
  summarise(
    n_obs     = n(),
    prop_zero = weighted.mean(chborn_num == 0, w = PERWT),
    n_pop     = sum(PERWT),
    mean_age  = weighted.mean(AGE, w = PERWT),
    .groups   = "drop"
  ) %>%
  mutate(
    prop_zero = prop_zero,
    age_label = paste0("age ", round(mean_age)),
    completed = AGE_RANGE >= "50-59"
  ) %>%
  filter(cohort_label %in% cohorts_of_interest)
# Reusable two-panel cohort stability plot:
# Left = all ages combined; Right = completed fertility (50+) only
plot_cohort_stability <- function(df, title, pop_unit = 1e6, pop_label = "millions") {
make_panel <- function(d, subtitle) {
ggplot(d, aes(x = YEAR, y = prop_zero, color = cohort_label, group = cohort_label)) +
geom_line(color = "grey80", linewidth = 0.4) +
geom_line(data = subset(d, completed), linewidth = 0.8) +
geom_line(data = subset(d, !completed), linewidth = 0.8, linetype = "dashed") +
geom_point(aes(size = n_pop / pop_unit), alpha = 0.8) +
geom_text_repel(aes(label = age_label), size = 2.3, show.legend = FALSE,
min.segment.length = 0, box.padding = 0.3, seed = 42) +
scale_x_continuous(breaks = c(1960, 1970, 1980, 1990)) +
scale_y_continuous(labels = percent_format(accuracy = 0.1)) +
scale_size_continuous(name = paste0("Est. pop. (", pop_label, ")"), range = c(1, 4)) +
scale_color_viridis_d(option = "magma", direction = -1, end = 0.9, name = "Birth cohort") +
facet_wrap(~ RACE) +
labs(subtitle = subtitle,
x = "Census year", y = "Proportion childless") +
theme_minimal() +
theme(strip.text = element_text(size = 10))
}
p_all <- make_panel(df, "All ages (dashed = incomplete fertility)")
p_comp <- make_panel(subset(df, completed), "Completed fertility only (age 50+)")
(p_all / p_comp / guide_area()) +
plot_layout(guides = "collect", heights = c(1, 1, 0.25)) +
plot_annotation(
title = title,
caption = "Dashed = age < 50 (fertility incomplete). Point labels = mean age at census."
)
}plot_cohort_stability(
cohort_national %>% filter(!is.na(prop_zero)),
title = "Proportion Childless by Birth Cohort Across Census Years\nNon-Hispanic women, IPUMS USA 1960–1990",
pop_unit = 1e6,
pop_label = "millions"
)
# All cohorts included in heatmap (not filtered to cohorts_of_interest)
data_cohort %>%
  group_by(cohort_label, YEAR, AGE_RANGE, RACE) %>%
  summarise(
    n_obs     = n(),
    prop_zero = weighted.mean(chborn_num == 0, w = PERWT),
    mean_age  = weighted.mean(AGE, w = PERWT),
    .groups   = "drop"
  ) %>%
  mutate(
    prop_zero = prop_zero,
    age_label = paste0("age ", round(mean_age))
  ) %>%
  mutate(
    cell_label  = if_else(
      !is.na(prop_zero),
      paste0(percent(prop_zero, accuracy = 0.1), "\n", age_label),
      "—"
    ),
    text_color = if_else(
      is.na(prop_zero) |
        prop_zero > quantile(prop_zero, 0.6, na.rm = TRUE),
      "black", "white"
    )
  ) %>%
  ggplot(aes(x = as.factor(YEAR), y = fct_rev(cohort_label), fill = prop_zero)) +
  geom_tile(color = "white", linewidth = 0.5) +
  geom_text(aes(label = cell_label, color = text_color), size = 2.8, lineheight = 0.9) +
  scale_color_identity() +
  scale_fill_viridis(
    option = "magma", na.value = "grey90",
    labels = percent_format(accuracy = 0.1),
    name   = "Prop. childless",
    trans  = "sqrt"
  ) +
  facet_wrap(~ RACE) +
  labs(
    title    = "Proportion Childless: Cohort × Census Year Matrix",
    subtitle = "Cell values show proportion and mean age of cohort at that census",
    x        = "Census year",
    y        = "Birth cohort"
  ) +
  theme_minimal() +
  theme(strip.text = element_text(size = 11, face = "bold"),
        legend.position = "right",
        legend.key.height = unit(1.5, "cm"))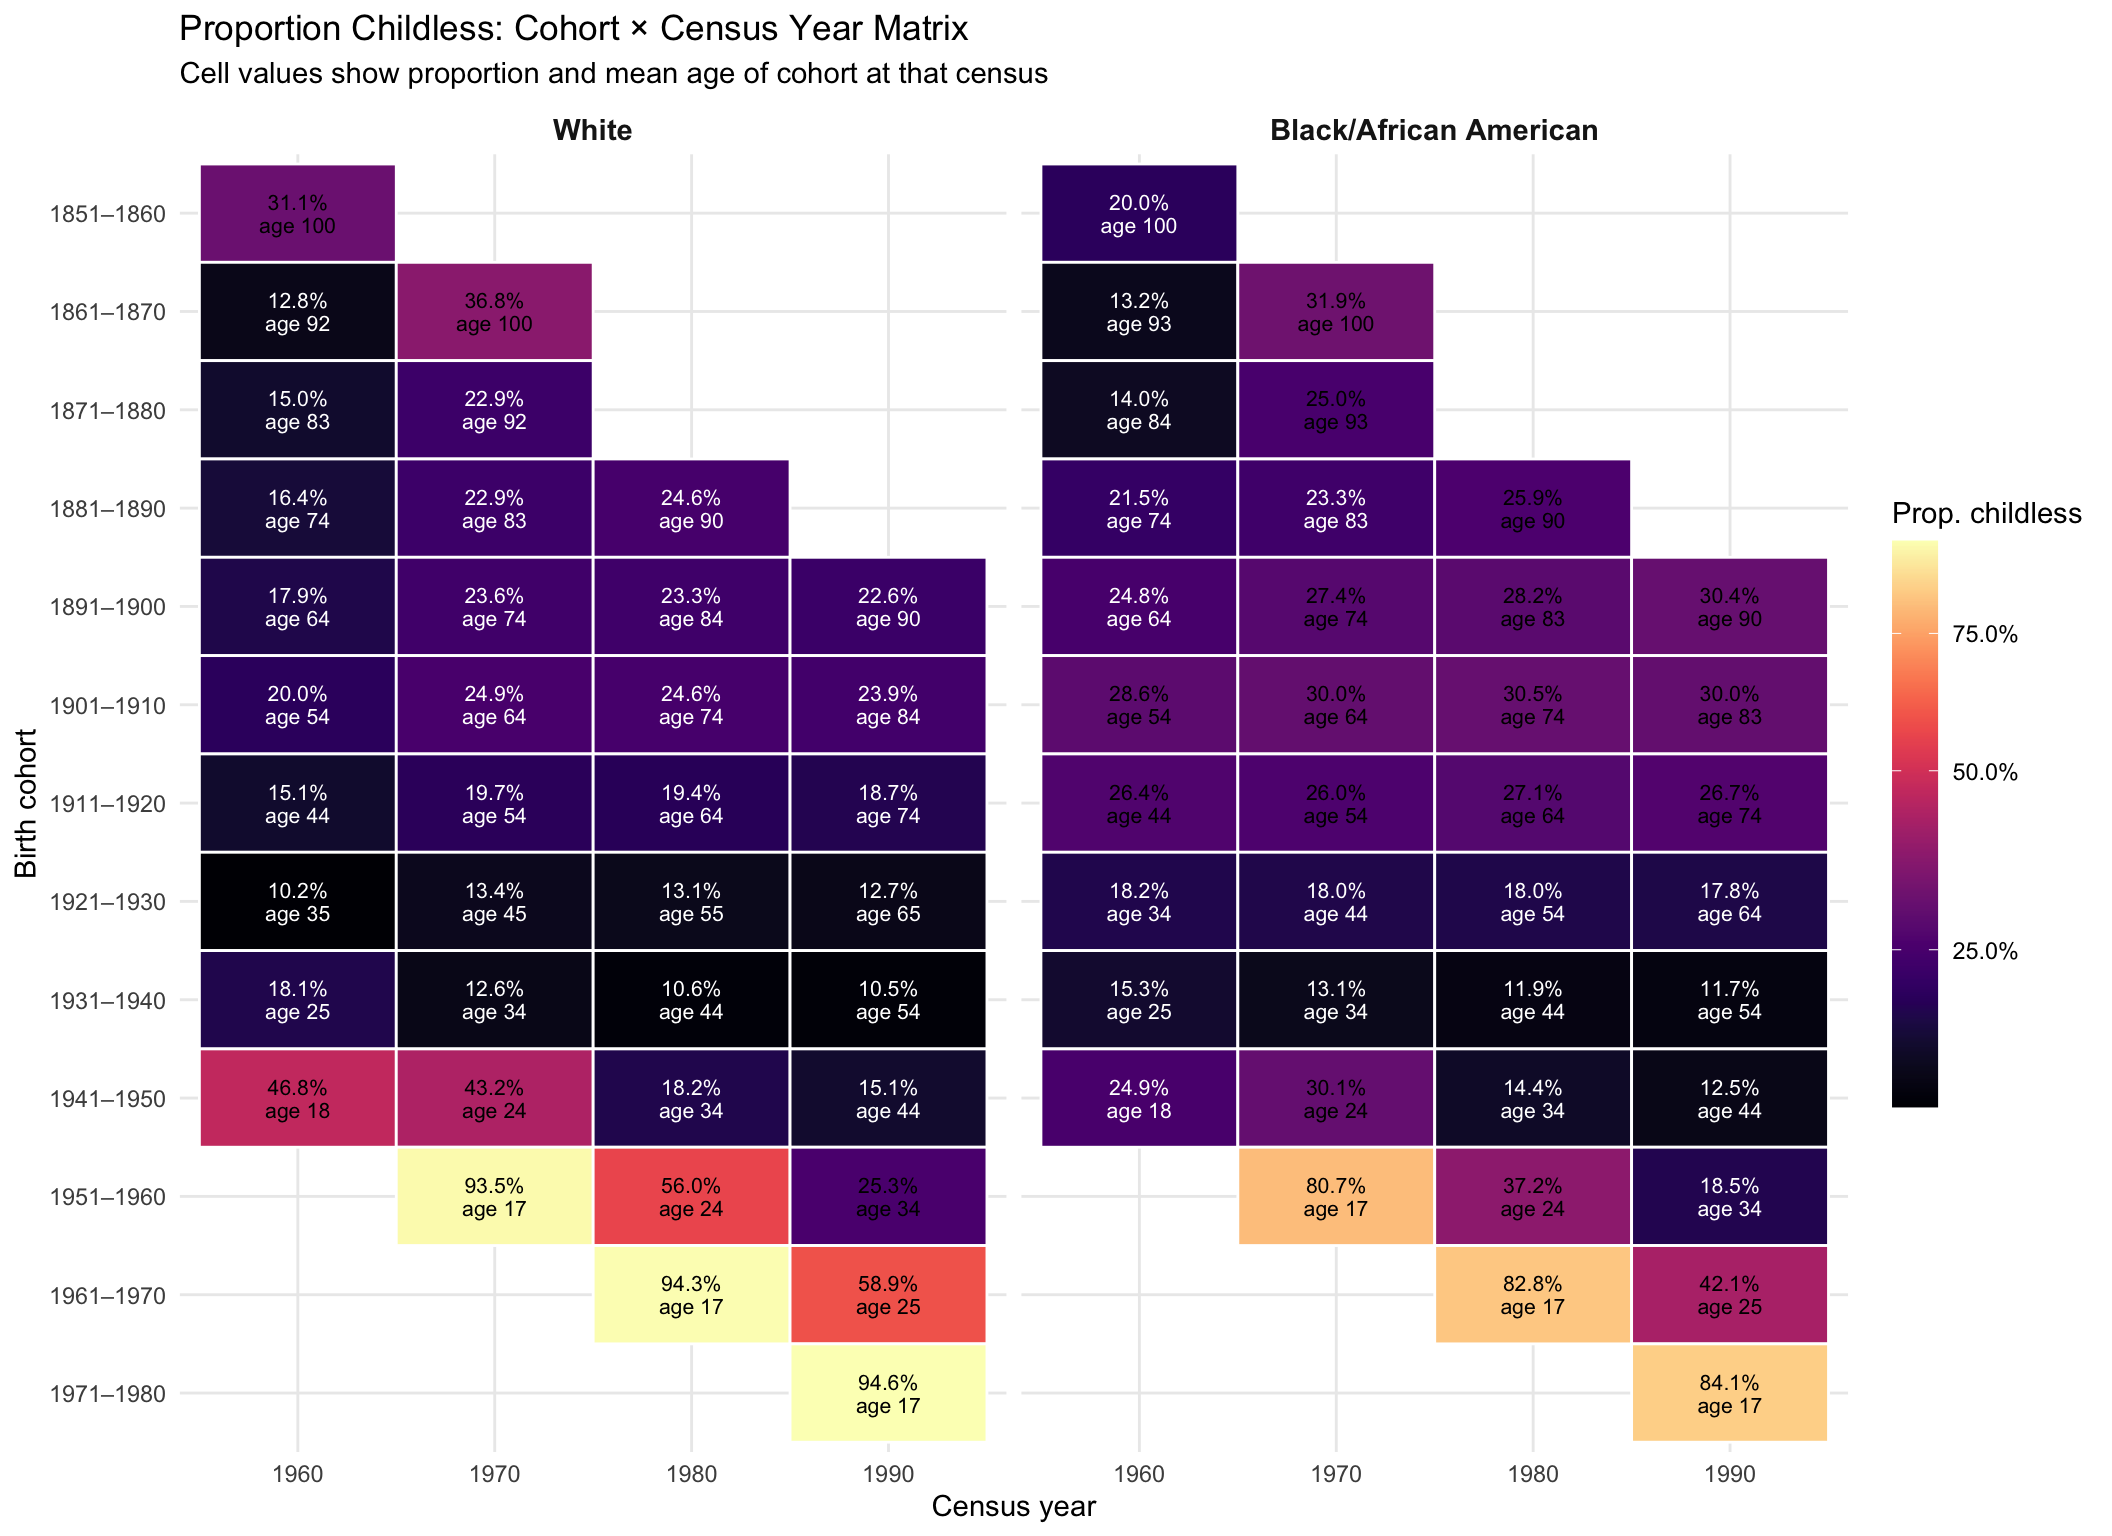
9b. State-level cohort analysis
For state-level analysis we require n ≥ 30 per cohort × age × race × state cell.
cohort_state <- data_cohort %>%
  group_by(state_name, cohort_label, YEAR, AGE_RANGE, RACE) %>%
  summarise(
    n_obs     = n(),
    prop_zero = weighted.mean(chborn_num == 0, w = PERWT),
    n_pop     = sum(PERWT),
    mean_age  = weighted.mean(AGE, w = PERWT),
    .groups   = "drop"
  ) %>%
  mutate(
    prop_zero = prop_zero,
    age_label = paste0("age ", round(mean_age)),
    completed = AGE_RANGE >= "50-59"
  ) %>%
  filter(cohort_label %in% cohorts_of_interest)
Choropleth maps: Birth Cohort × Age Group
# Grid: rows = birth cohort, columns = census year
# Panel title shows the age group that cohort was at that census year
# Shared colour scale across all panels for direct comparison

plot_cohort_grid <- function(df, race_filter, palette_option = "magma") {
  df <- df %>%
    filter(RACE == race_filter) %>%
    rename(state = state_name)

  lims    <- range(df$prop_zero, na.rm = TRUE)
  cohorts <- sort(unique(df$cohort_label))
  ages    <- levels(df$AGE_RANGE)  # ordered factor: 15-19 ... 80-89

  plots <- list()
  for (ag in ages) {
    for (ch in cohorts) {
      sub <- df %>% filter(AGE_RANGE == ag, cohort_label == ch)
      # derive census year for subtitle
      yr_lab <- if (nrow(sub) > 0) paste(sort(unique(sub$YEAR)), collapse = "/") else "—"
      panel_title <- paste0(ch, "\n", ag, "\n(", yr_lab, ")")

      if (nrow(sub) > 0 && any(!is.na(sub$prop_zero))) {
        p <- plot_usmap(data = sub, values = "prop_zero",
                        color = "grey70", linewidth = 0.15) +
          scale_fill_viridis(option = palette_option, na.value = "grey90",
                             name = NULL, limits = lims, trans = "sqrt") +
          labs(title = panel_title) +
          theme(plot.title = element_text(size = 6.5, hjust = 0.5))
      } else {
        p <- ggplot() + theme_void() +
          labs(title = panel_title) +
          theme(plot.title = element_text(size = 6.5, hjust = 0.5, color = "grey60"))
      }
      plots <- c(plots, list(p))
    }
  }

  # columns = cohorts, rows = age groups
  wrap_plots(plots, ncol = length(cohorts)) +
    plot_layout(guides = "collect") +
    plot_annotation(
      title    = paste0("Proportion Childless: Birth Cohort × Age Group\n", race_filter),
      subtitle = "Rows = age group  |  Columns = birth cohort  |  Panel label shows cohort, age group, census year",
      caption  = "Proportion reporting zero children ever born (CHBORN = 0), weighted by PERWT. Shared colour scale. Source: IPUMS USA 1% samples."
    ) &
    theme(legend.position = "right",
          plot.title = element_text(size = 13, hjust = 0.5))
}

plot_cohort_grid(cohort_state, "White")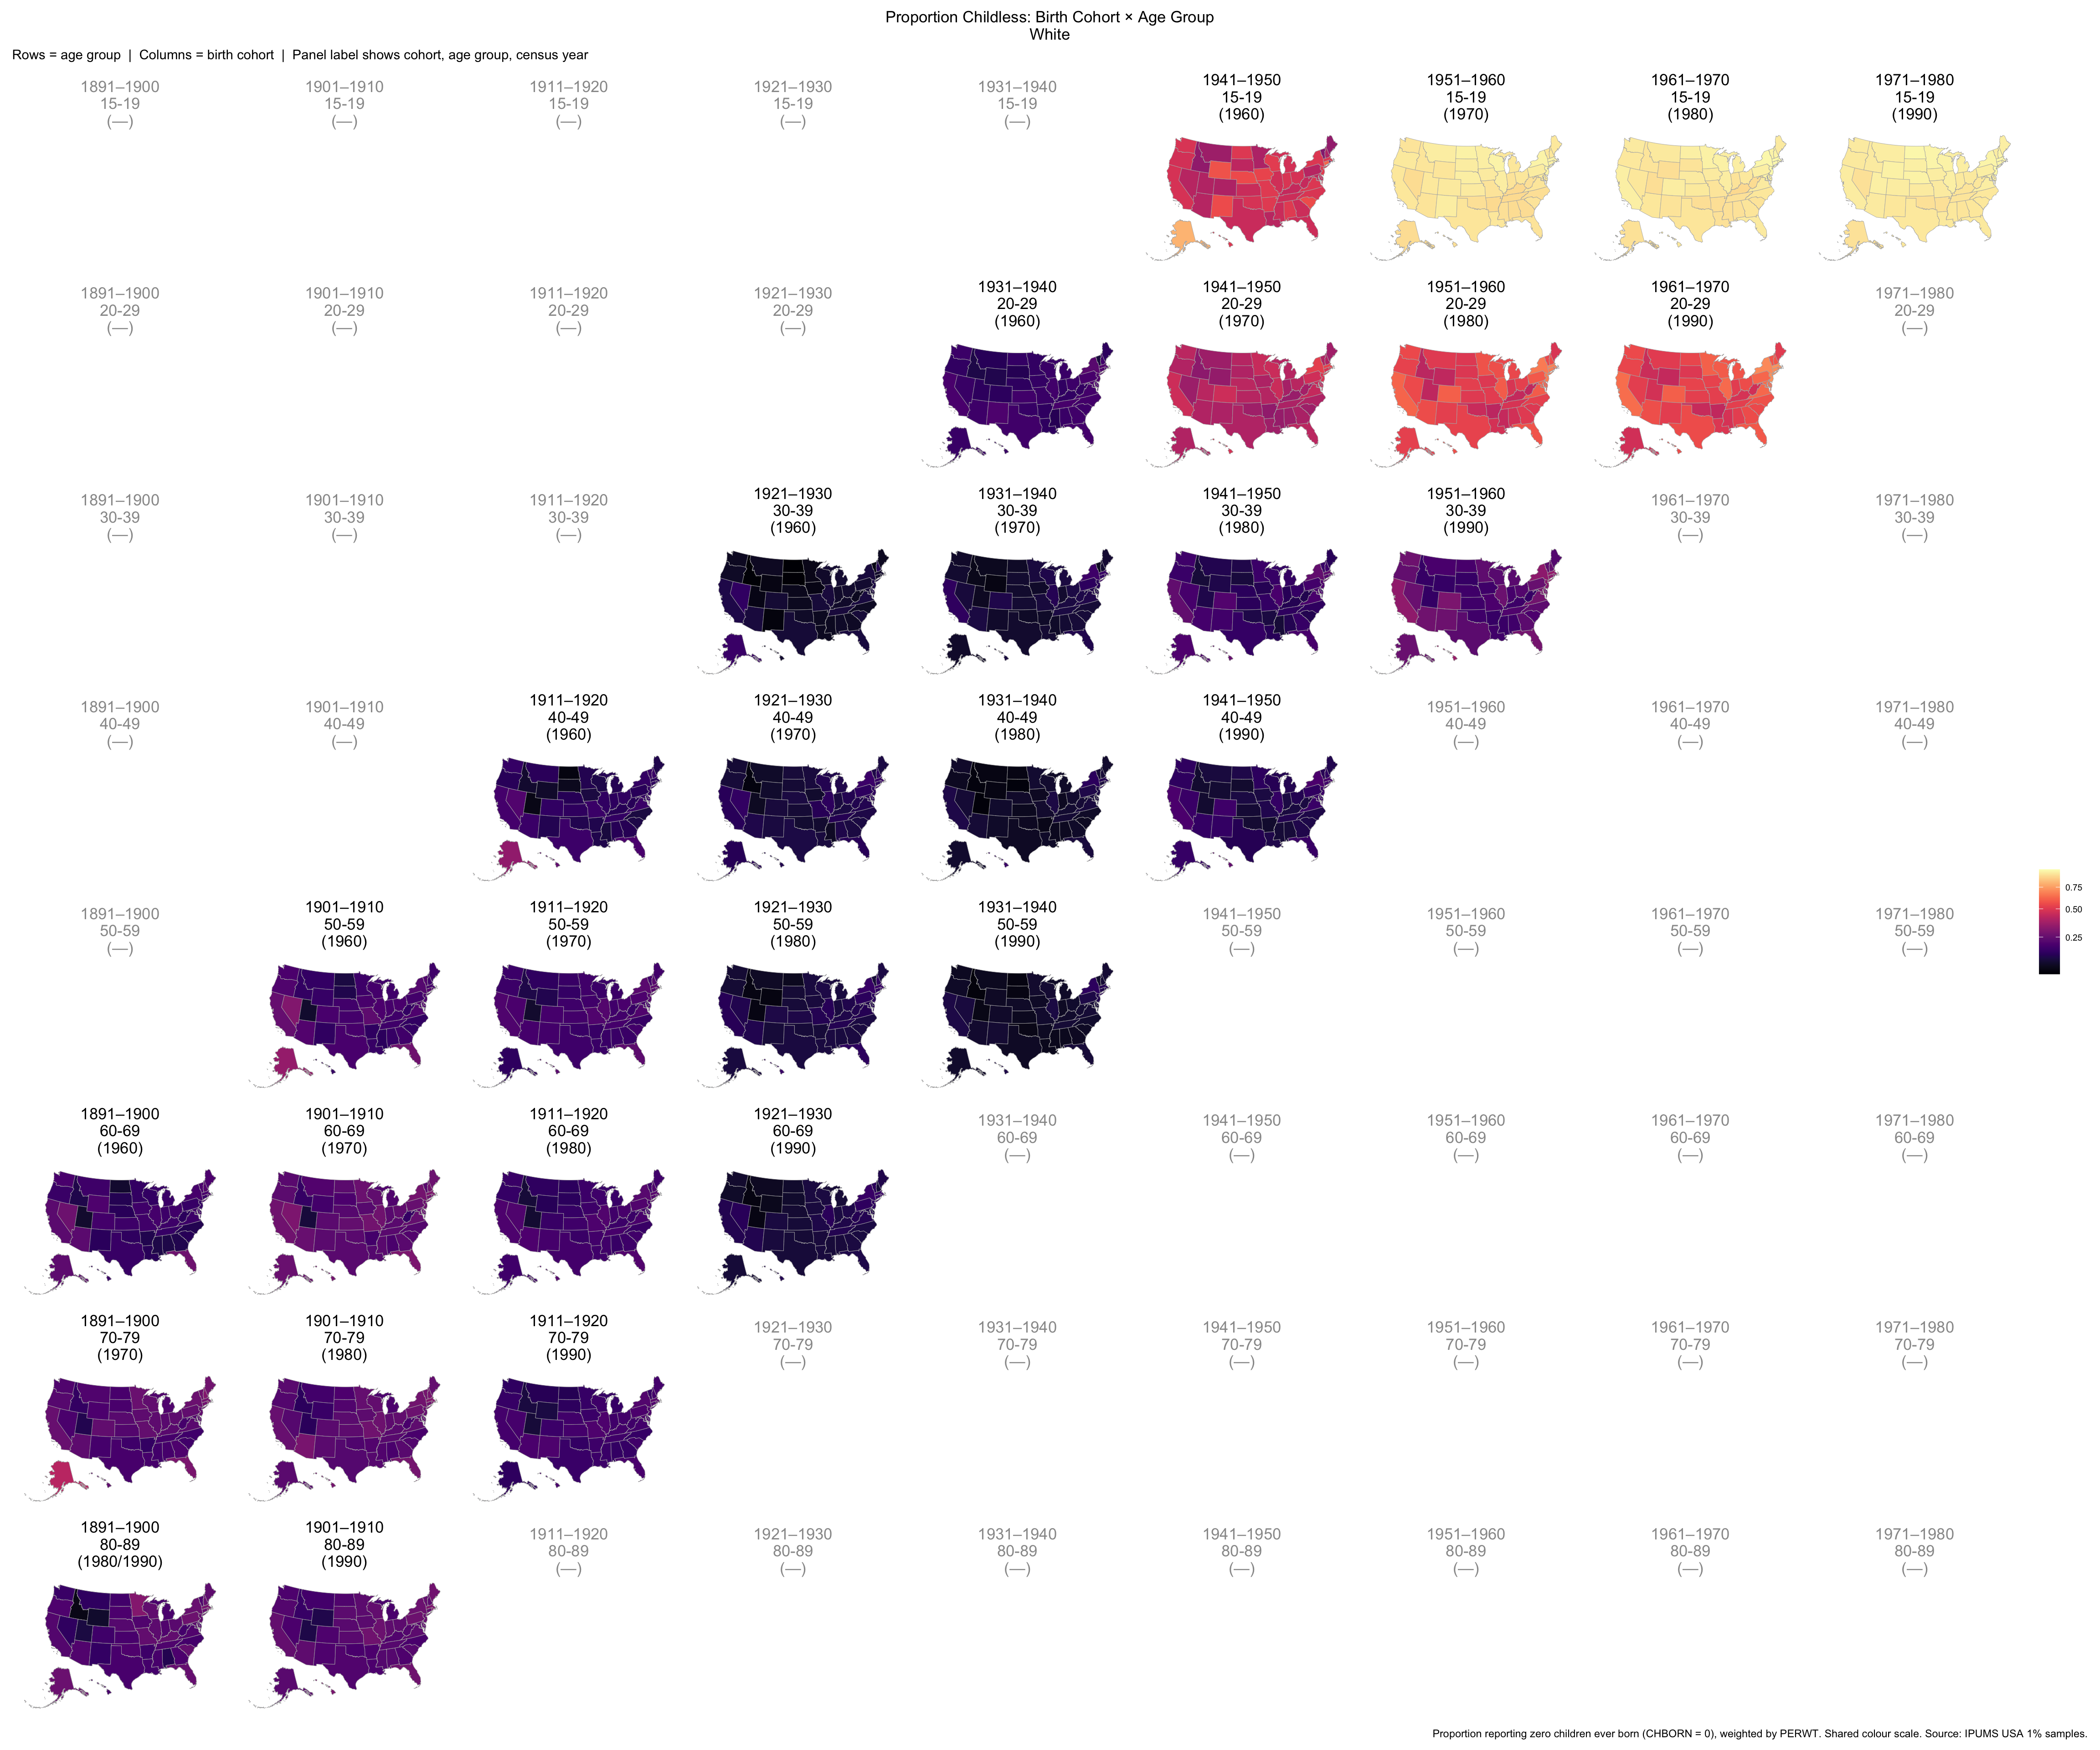
plot_cohort_grid(cohort_state, "Black/African American")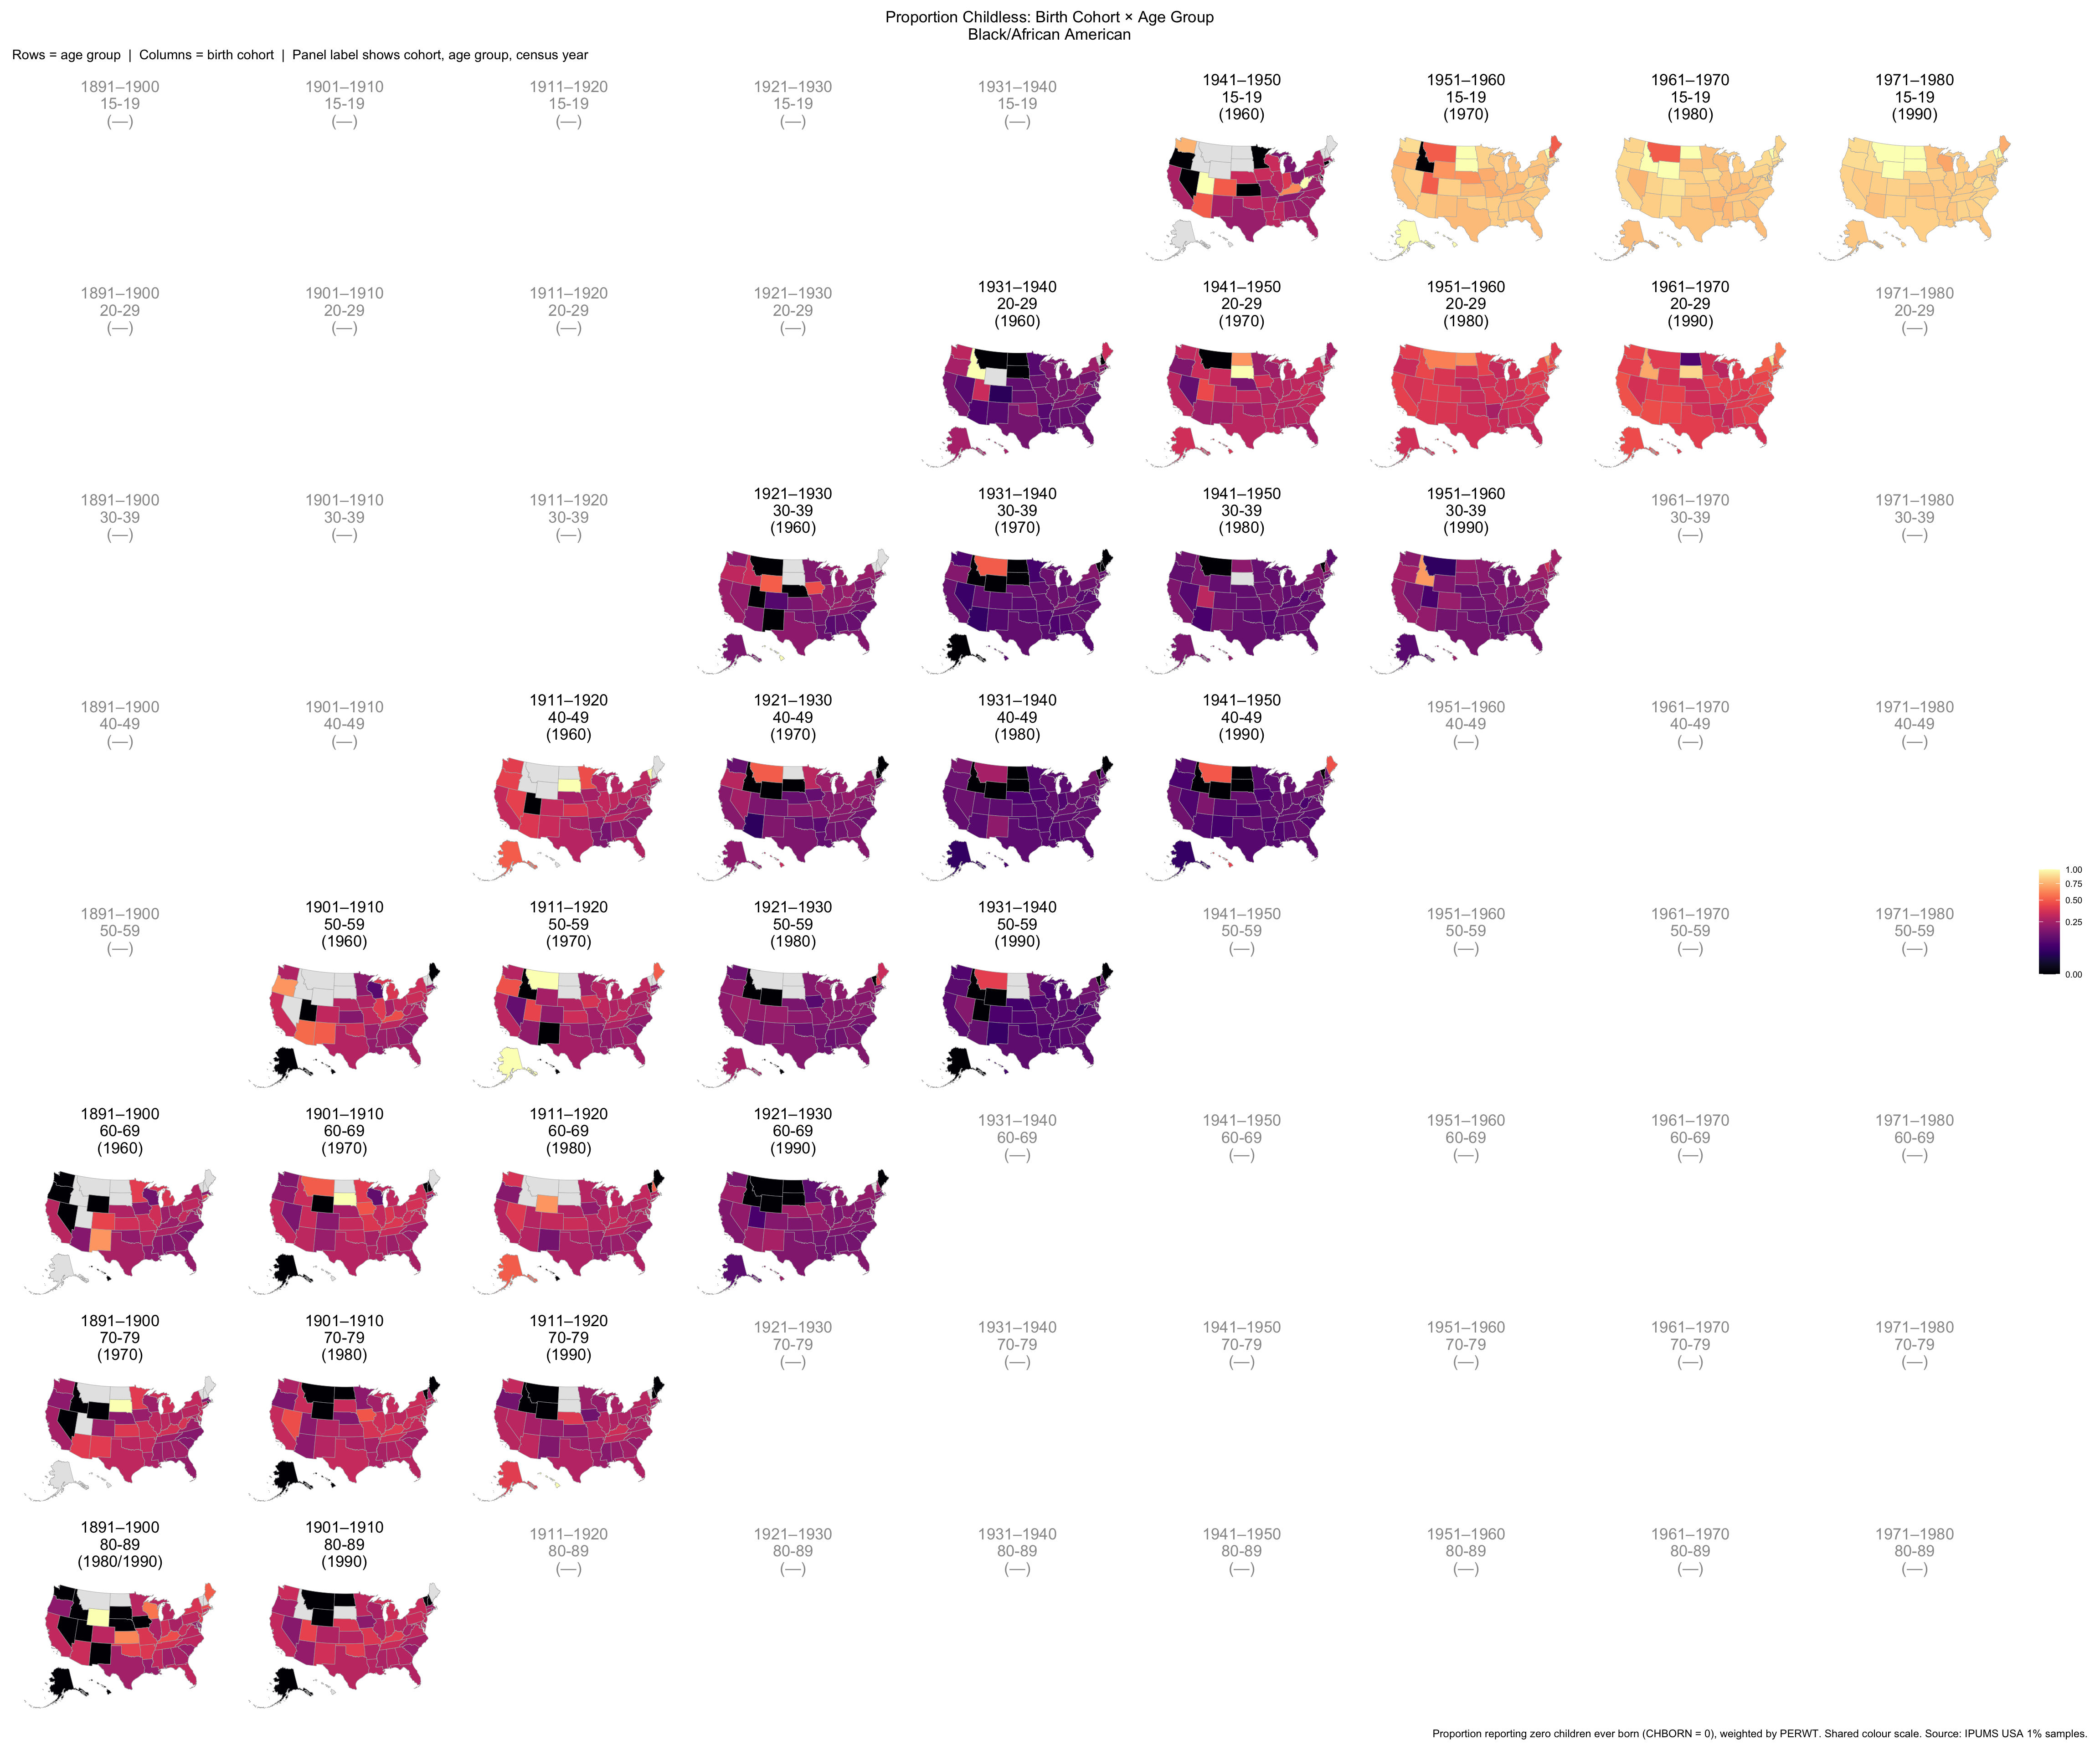
# Regional choropleth grid: each state is coloured by its region's prop_zero.
# regional_df  : summarised data with columns (group_var, cohort_label, YEAR,
#                AGE_RANGE, RACE, prop_zero)
# group_var    : name of the grouping column ("division" or "conference")
# state_lookup : function(state_name) -> group label (state_to_division / state_to_conference)
# all_states   : character vector of all state names in the data
plot_cohort_grid_regional <- function(regional_df, race_filter,
                                      group_var, state_lookup,
                                      all_states,
                                      palette_option = "magma") {
  df <- regional_df %>% filter(RACE == race_filter)

  lims    <- range(df$prop_zero, na.rm = TRUE)
  cohorts <- sort(unique(df$cohort_label))
  ages    <- levels(df$AGE_RANGE)

  # Build a state-level lookup table: state -> group label
  state_group <- tibble(
    state = all_states,
    grp   = state_lookup(all_states)
  ) %>% filter(!is.na(grp))

  plots <- list()
  for (ag in ages) {
    for (ch in cohorts) {
      sub_reg <- df %>% filter(AGE_RANGE == ag, cohort_label == ch)
      yr_lab  <- if (nrow(sub_reg) > 0) paste(sort(unique(sub_reg$YEAR)), collapse = "/") else "—"
      panel_title <- paste0(ch, "\n", ag, "\n(", yr_lab, ")")

      if (nrow(sub_reg) > 0 && any(!is.na(sub_reg$prop_zero))) {
        # Join regional values onto each state
        sub_state <- state_group %>%
          left_join(
            sub_reg %>% select(grp = all_of(group_var), prop_zero),
            by = "grp"
          )

        p <- plot_usmap(data = sub_state, values = "prop_zero",
                        color = "grey70", linewidth = 0.15) +
          scale_fill_viridis(option = palette_option, na.value = "grey90",
                             name = NULL, limits = lims, trans = "sqrt") +
          labs(title = panel_title) +
          theme(plot.title = element_text(size = 6.5, hjust = 0.5))
      } else {
        p <- ggplot() + theme_void() +
          labs(title = panel_title) +
          theme(plot.title = element_text(size = 6.5, hjust = 0.5, color = "grey60"))
      }
      plots <- c(plots, list(p))
    }
  }

  wrap_plots(plots, ncol = length(cohorts)) +
    plot_layout(guides = "collect") +
    plot_annotation(
      title    = paste0("Proportion Childless: Birth Cohort × Age Group\n",
                        race_filter, " — by ", group_var),
      subtitle = "Rows = age group  |  Columns = birth cohort  |  States coloured by regional value",
      caption  = "Proportion reporting zero children ever born (CHBORN = 0), weighted by PERWT. Source: IPUMS USA 1% samples."
    ) &
    theme(legend.position = "right",
          plot.title = element_text(size = 13, hjust = 0.5))
}
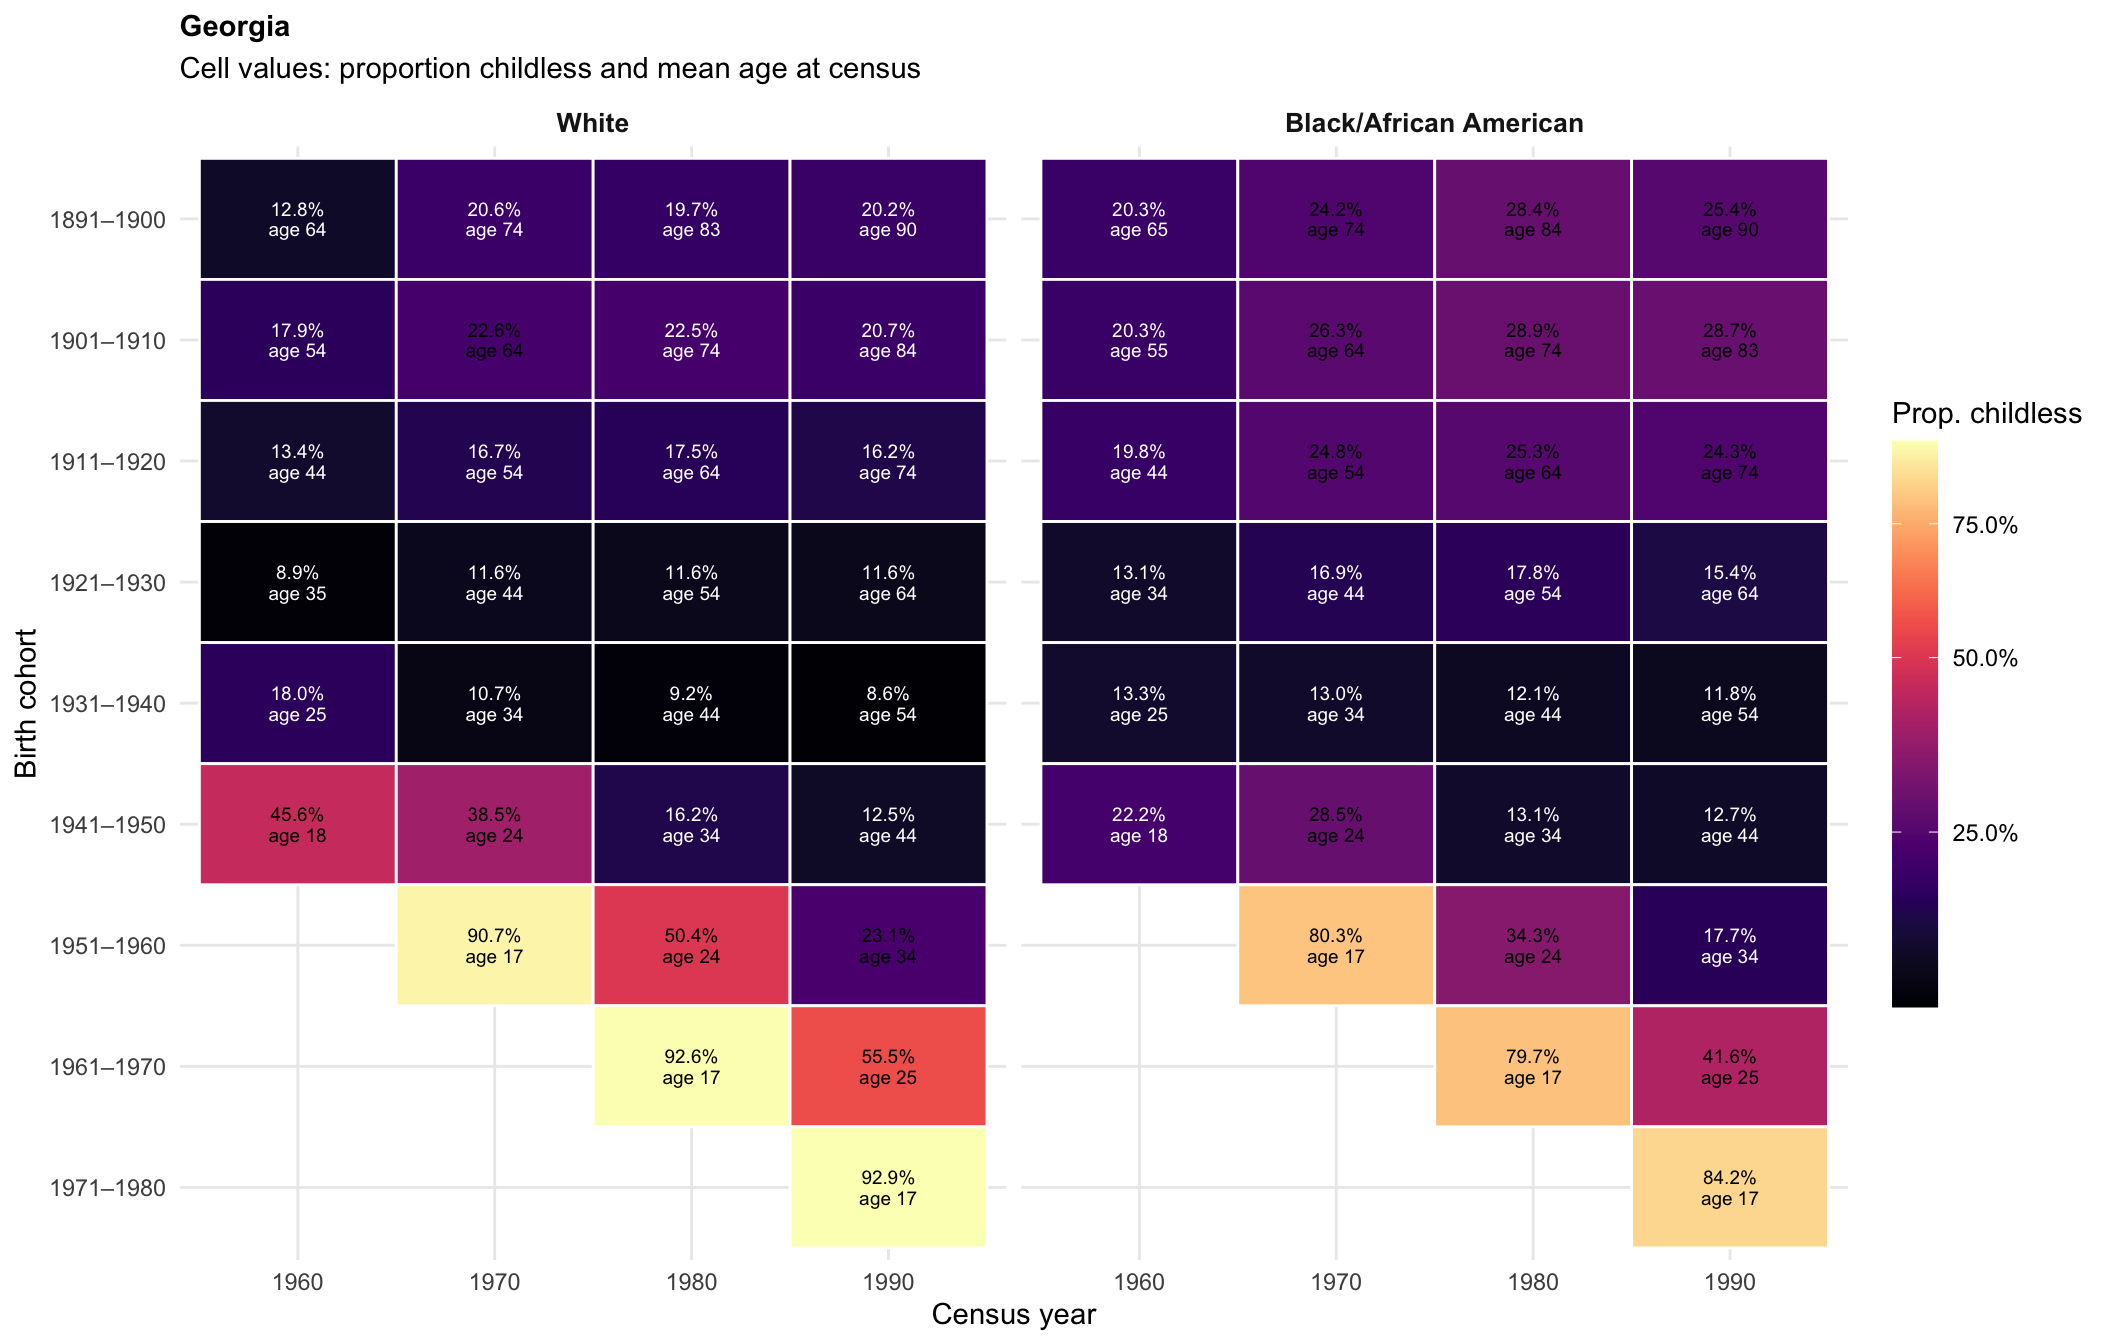
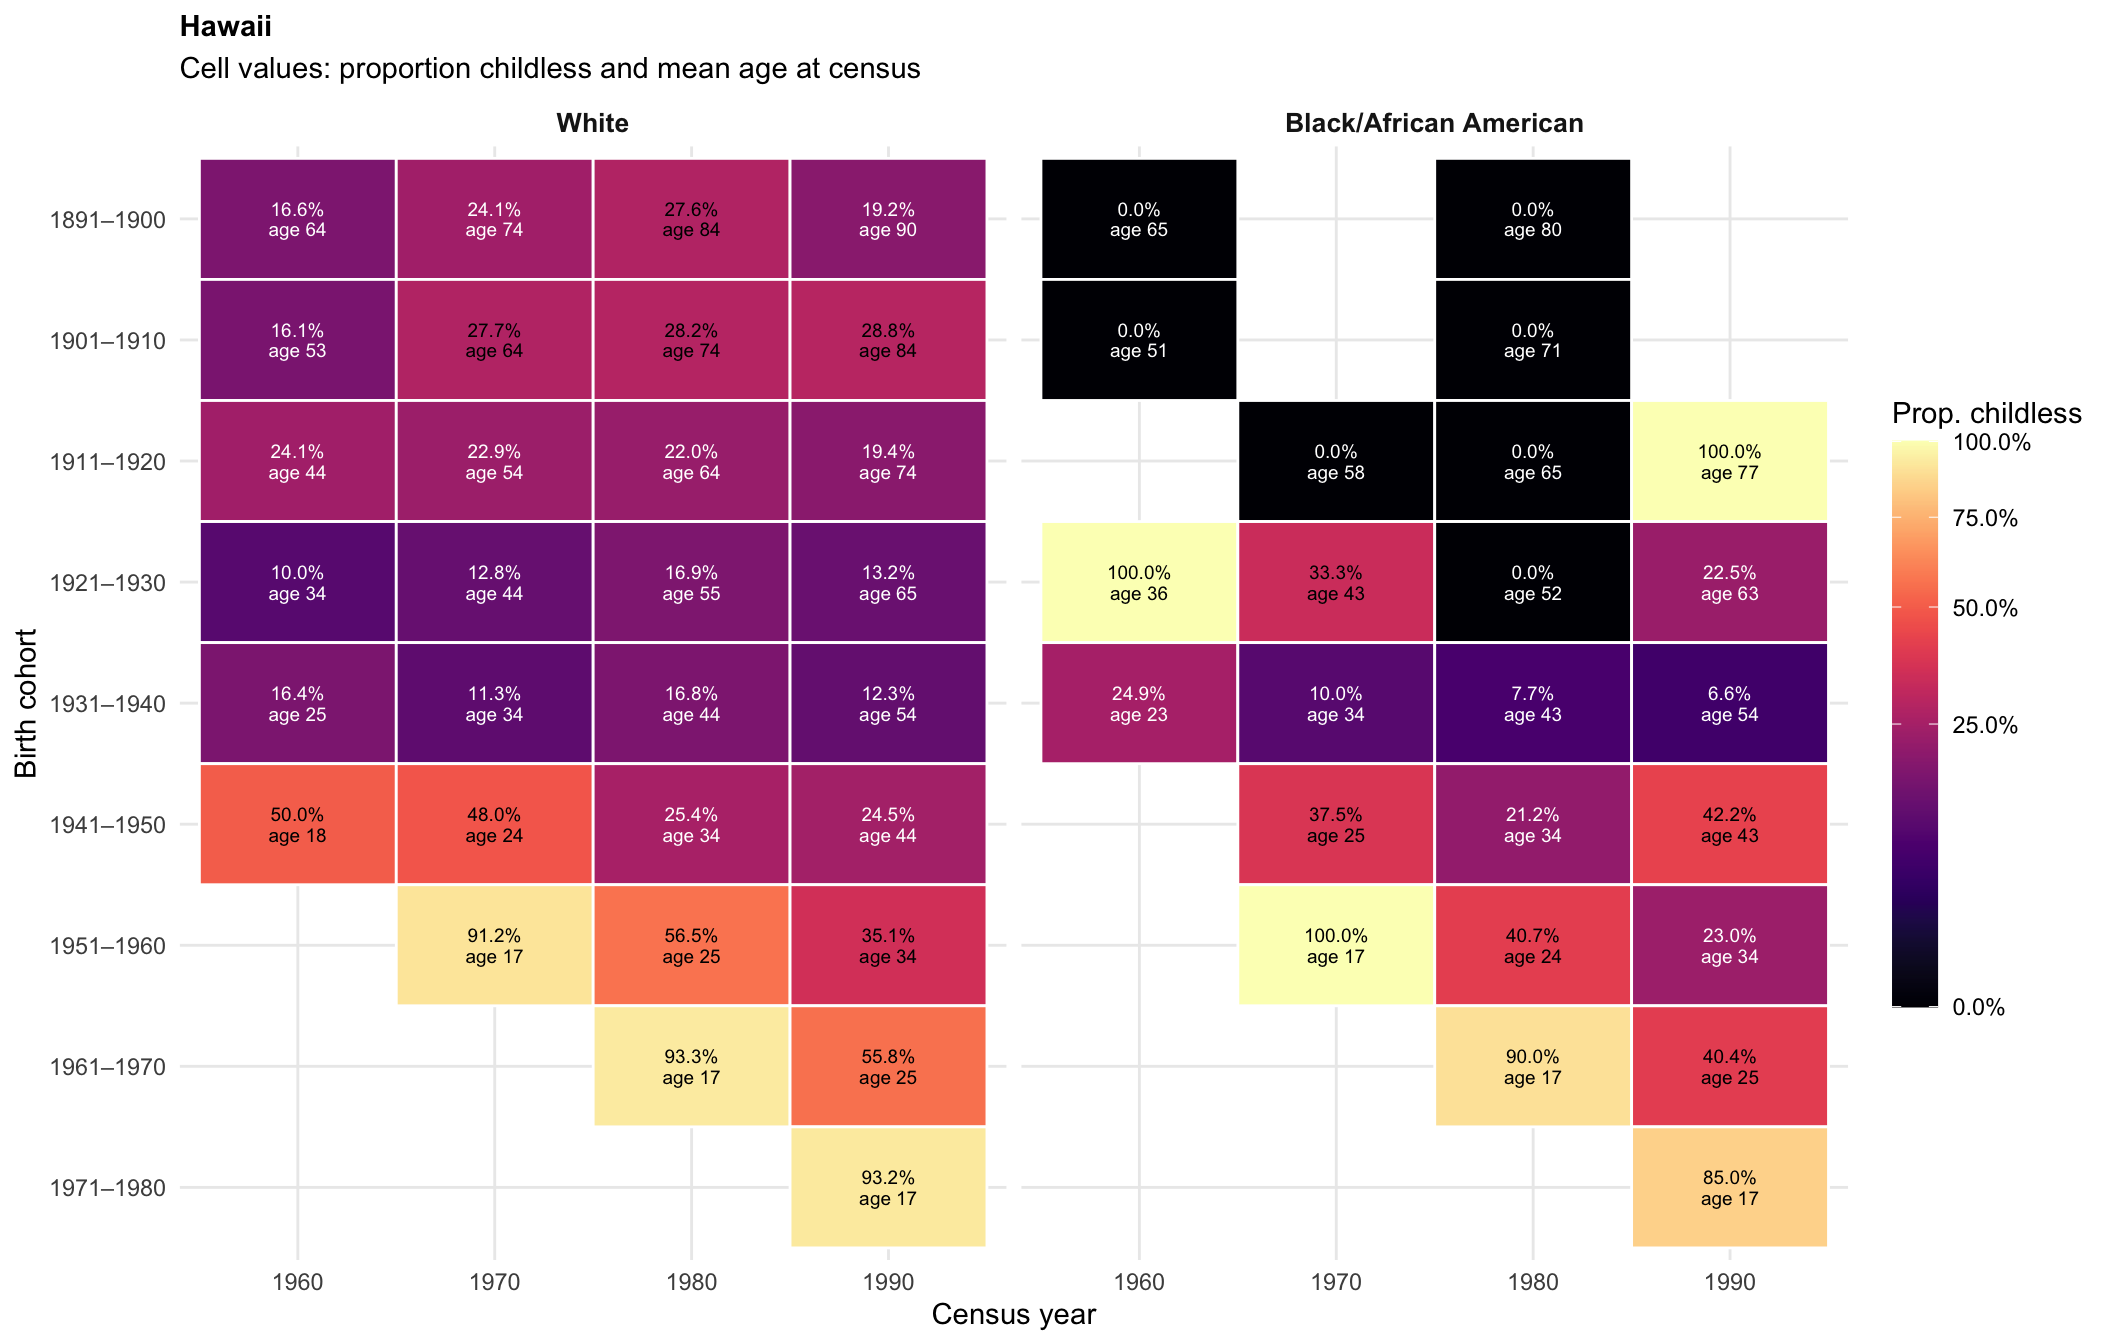
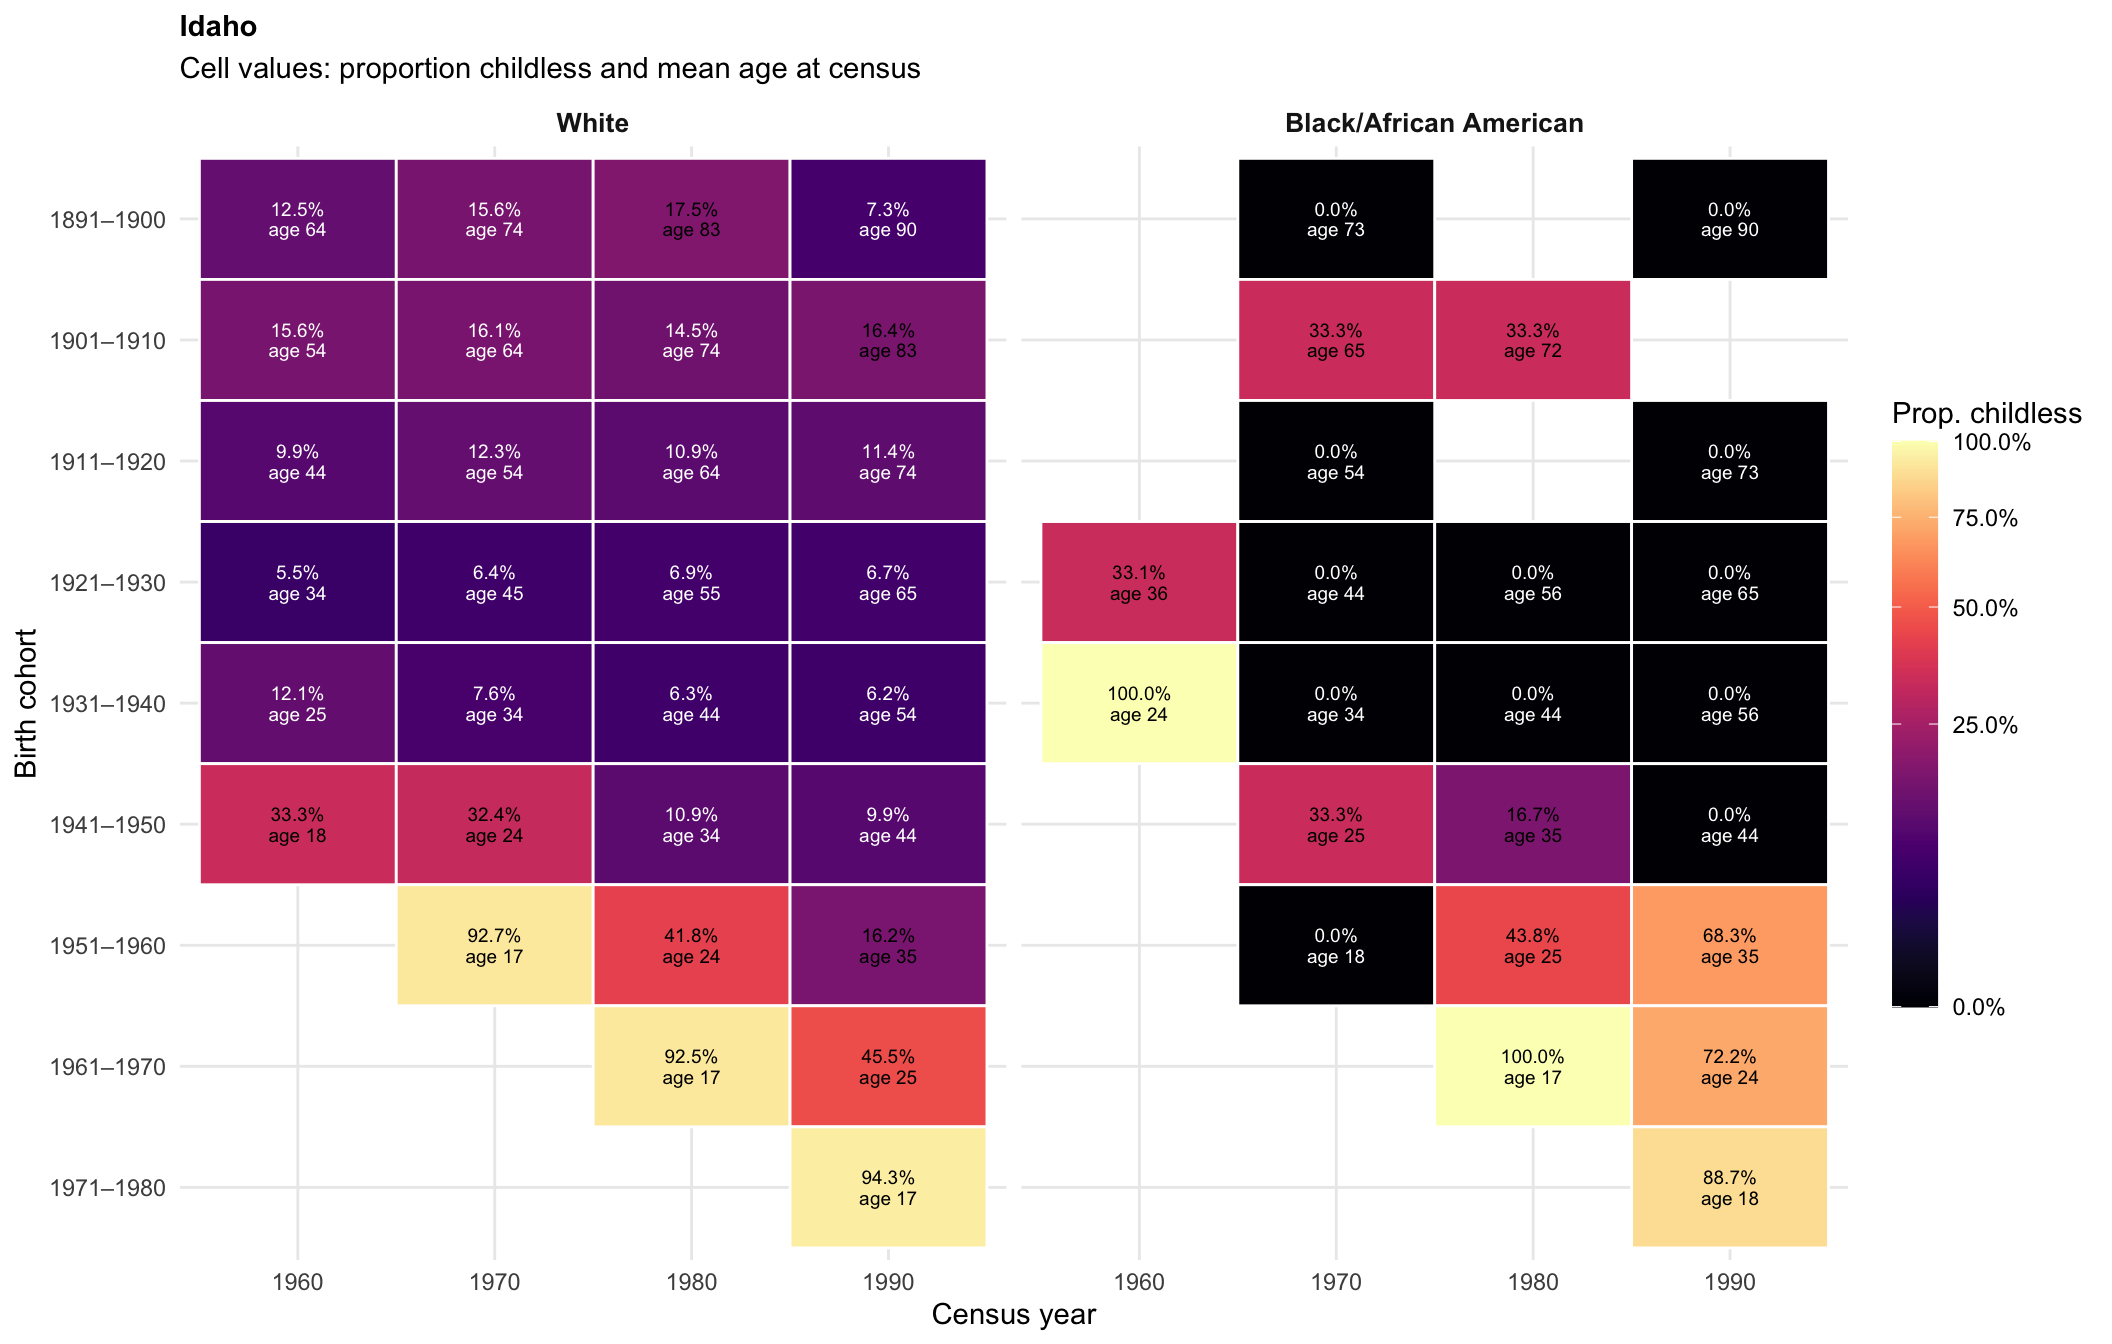
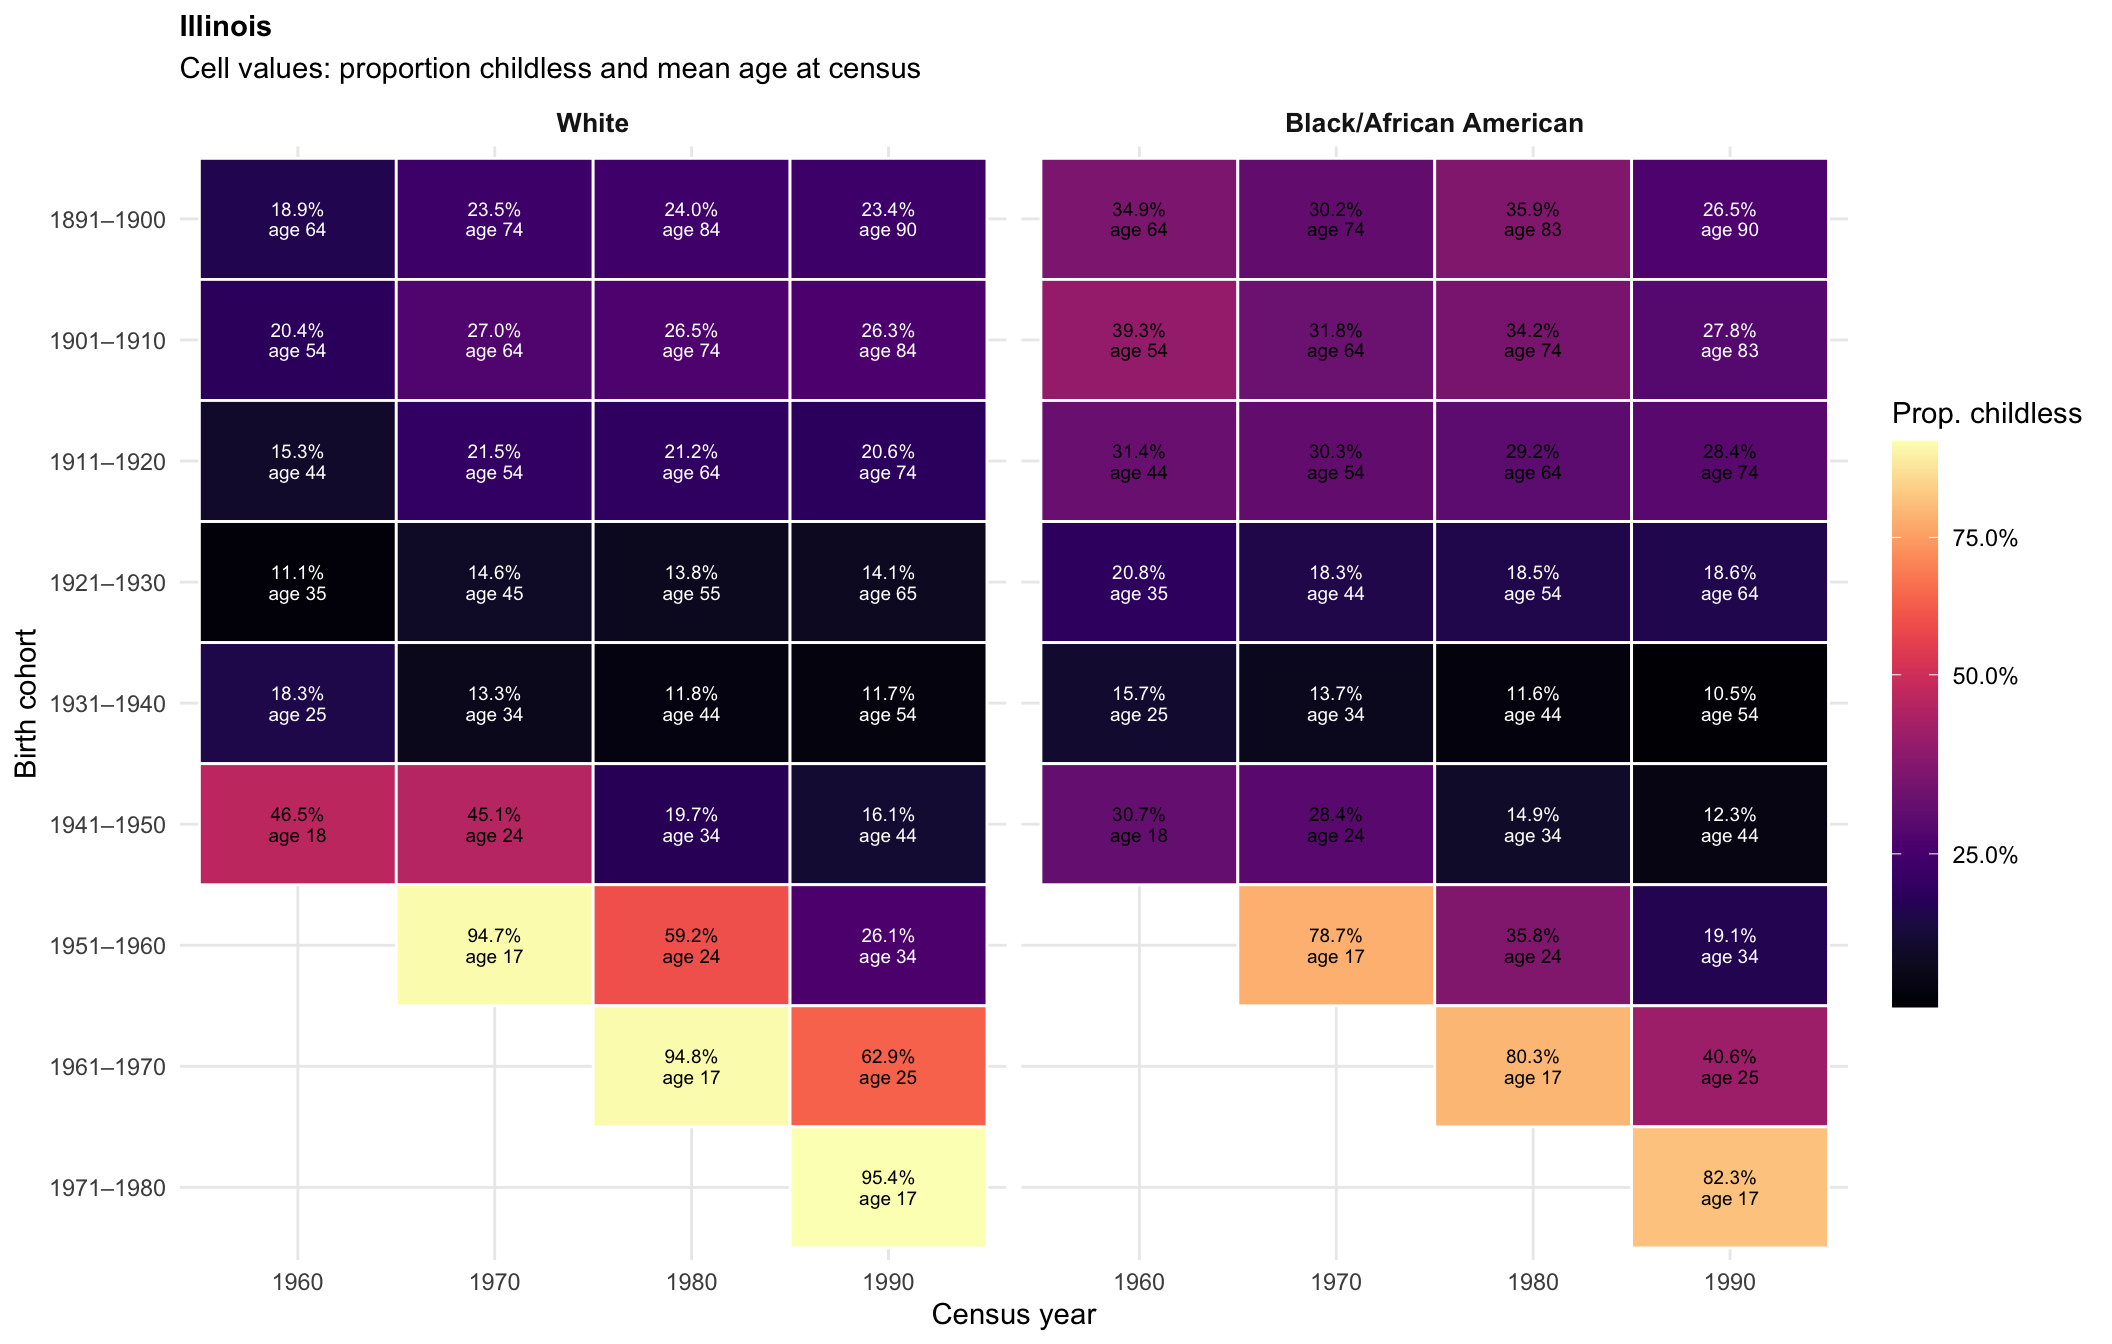
Cohort × Census Year matrices (per state)
# Reusable cohort × census year heatmap for a single grouping unit (state, division, etc.)
plot_cohort_matrix <- function(df, title) {
  df %>%
    mutate(
      cell_label = if_else(
        !is.na(prop_zero),
        paste0(percent(prop_zero, accuracy = 0.1), "\n", age_label),
        "—"
      ),
      text_color = if_else(
        is.na(prop_zero) |
          prop_zero > quantile(prop_zero, 0.6, na.rm = TRUE),
        "black", "white"
      )
    ) %>%
    ggplot(aes(x = as.factor(YEAR), y = fct_rev(cohort_label), fill = prop_zero)) +
    geom_tile(color = "white", linewidth = 0.5) +
    geom_text(aes(label = cell_label, color = text_color), size = 2.5, lineheight = 0.9) +
    scale_color_identity() +
    scale_fill_viridis(
      option = "magma", na.value = "grey90",
      labels = percent_format(accuracy = 0.1),
      name   = "Prop. childless",
      trans  = "sqrt"
    ) +
    facet_wrap(~ RACE) +
    labs(
      title    = title,
      subtitle = "Cell values: proportion childless and mean age at census",
      x        = "Census year",
      y        = "Birth cohort"
    ) +
    theme_minimal() +
    theme(strip.text = element_text(size = 10, face = "bold"),
          plot.title = element_text(size = 11, face = "bold"),
          legend.position = "right",
          legend.key.height = unit(1.5, "cm"))
}
all_states <- sort(unique(cohort_state$state_name))
for (st in all_states) {
st_mat <- cohort_state %>%
filter(state_name == st)
if (nrow(st_mat) == 0) next
p <- plot_cohort_matrix(st_mat, title = st)
print(p)
cat("\n\n")
}
| Version | Author | Date |
|---|---|---|
| 5634d2b | Tina Lasisi | 2026-04-16 |
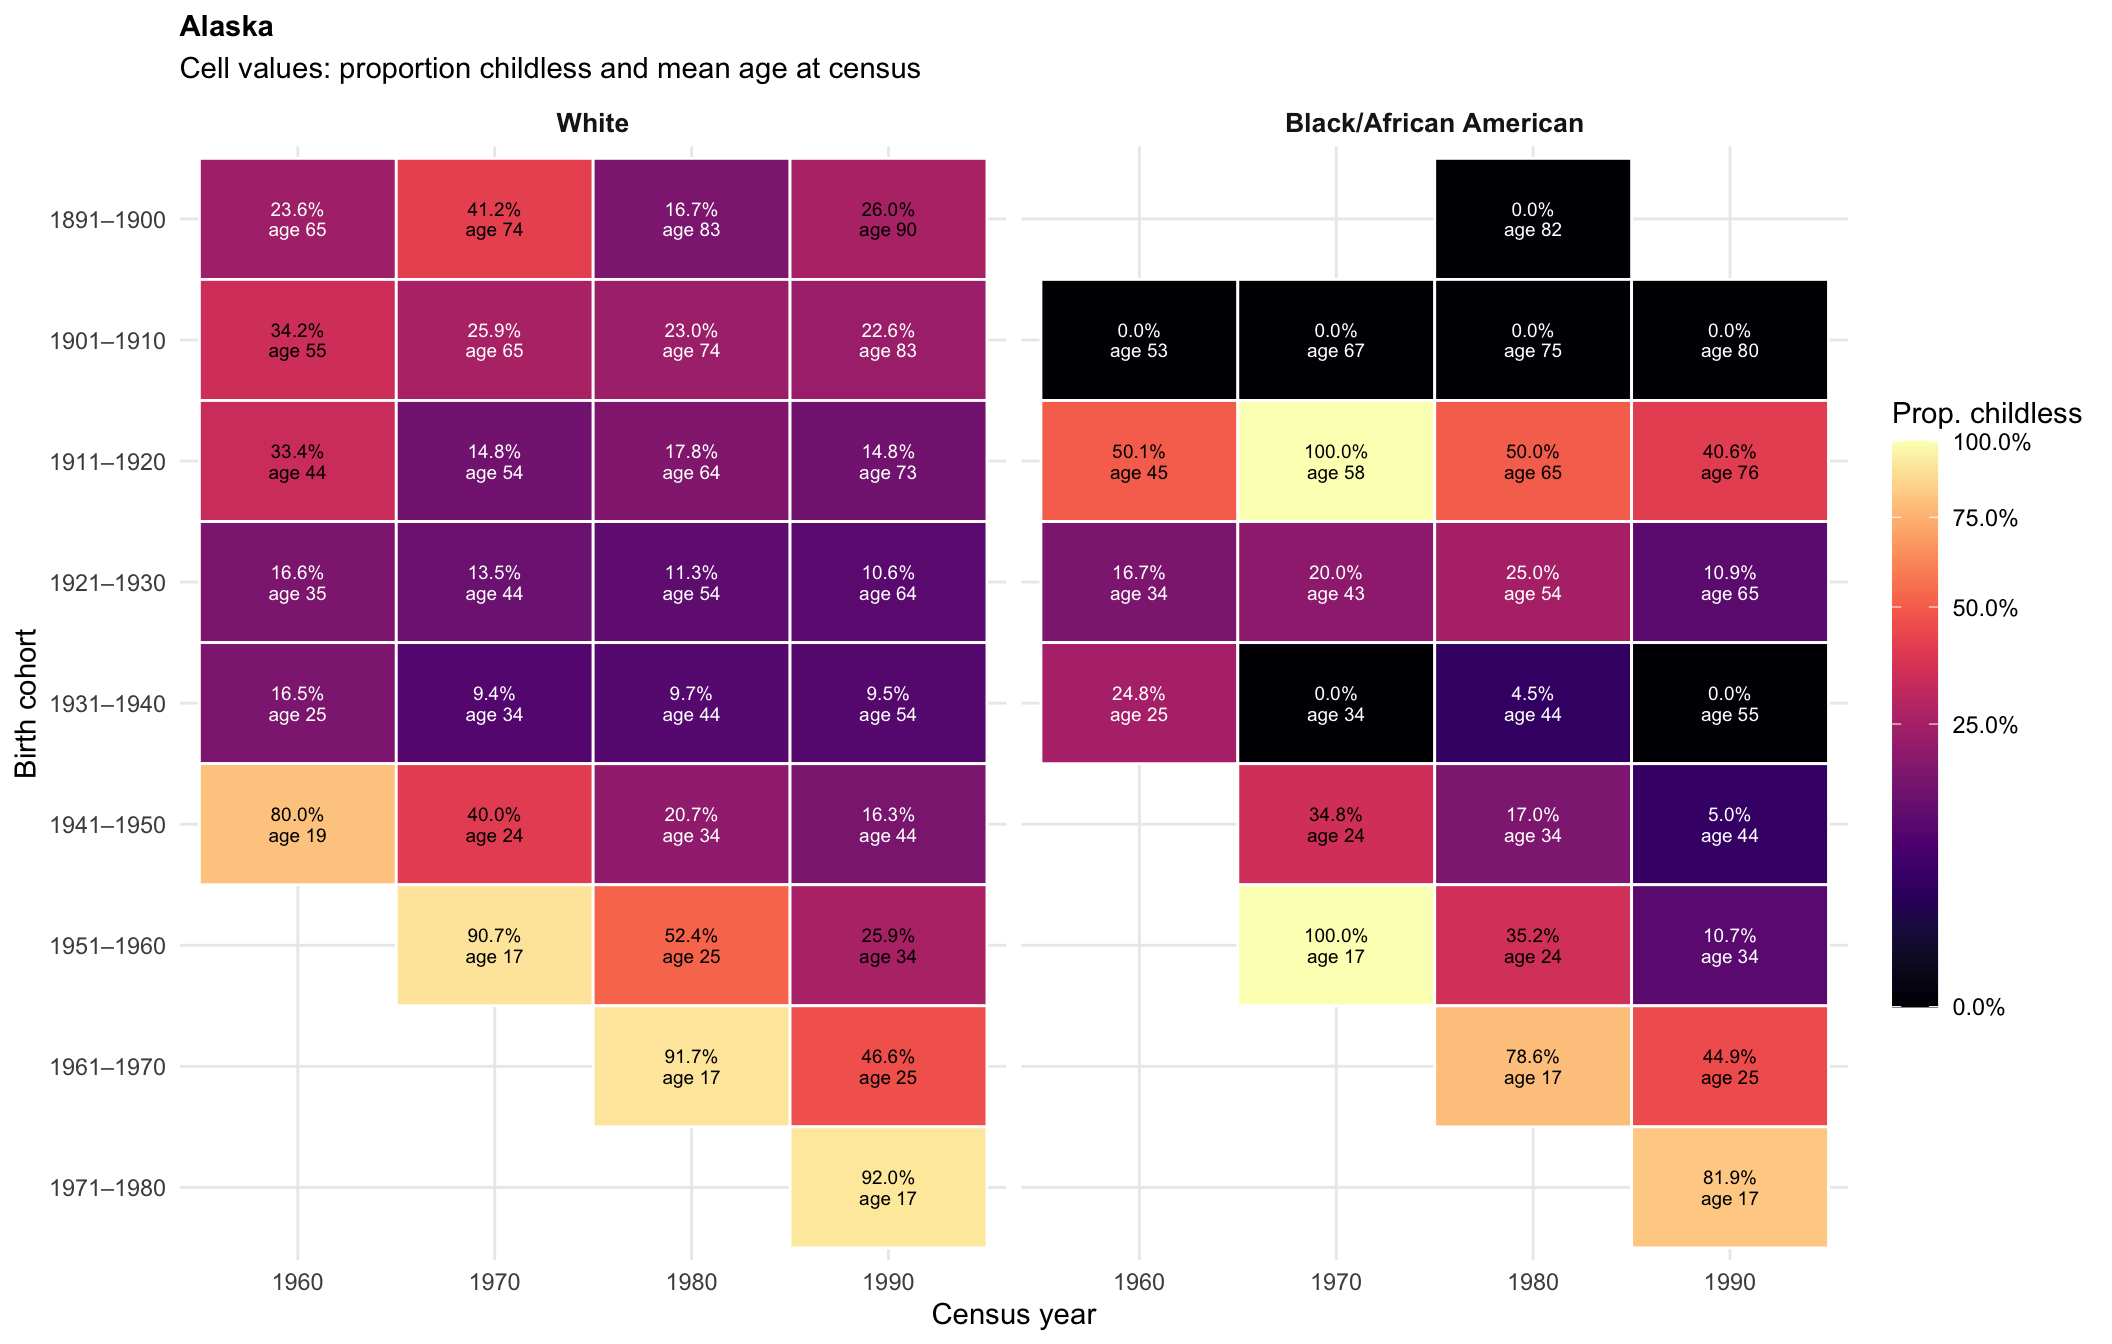
| Version | Author | Date |
|---|---|---|
| 5634d2b | Tina Lasisi | 2026-04-16 |
| Version | Author | Date |
|---|---|---|
| 5634d2b | Tina Lasisi | 2026-04-16 |
| Version | Author | Date |
|---|---|---|
| 5634d2b | Tina Lasisi | 2026-04-16 |
| Version | Author | Date |
|---|---|---|
| 5634d2b | Tina Lasisi | 2026-04-16 |
| Version | Author | Date |
|---|---|---|
| 5634d2b | Tina Lasisi | 2026-04-16 |
| Version | Author | Date |
|---|---|---|
| 5634d2b | Tina Lasisi | 2026-04-16 |
| Version | Author | Date |
|---|---|---|
| 5634d2b | Tina Lasisi | 2026-04-16 |
| Version | Author | Date |
|---|---|---|
| 5634d2b | Tina Lasisi | 2026-04-16 |
| Version | Author | Date |
|---|---|---|
| 5634d2b | Tina Lasisi | 2026-04-16 |
| Version | Author | Date |
|---|---|---|
| 5634d2b | Tina Lasisi | 2026-04-16 |
| Version | Author | Date |
|---|---|---|
| 5634d2b | Tina Lasisi | 2026-04-16 |
| Version | Author | Date |
|---|---|---|
| 5634d2b | Tina Lasisi | 2026-04-16 |
| Version | Author | Date |
|---|---|---|
| 5634d2b | Tina Lasisi | 2026-04-16 |
| Version | Author | Date |
|---|---|---|
| 5634d2b | Tina Lasisi | 2026-04-16 |
| Version | Author | Date |
|---|---|---|
| 5634d2b | Tina Lasisi | 2026-04-16 |
| Version | Author | Date |
|---|---|---|
| 5634d2b | Tina Lasisi | 2026-04-16 |
| Version | Author | Date |
|---|---|---|
| 5634d2b | Tina Lasisi | 2026-04-16 |
| Version | Author | Date |
|---|---|---|
| 5634d2b | Tina Lasisi | 2026-04-16 |
| Version | Author | Date |
|---|---|---|
| 5634d2b | Tina Lasisi | 2026-04-16 |
| Version | Author | Date |
|---|---|---|
| 5634d2b | Tina Lasisi | 2026-04-16 |
| Version | Author | Date |
|---|---|---|
| 5634d2b | Tina Lasisi | 2026-04-16 |
| Version | Author | Date |
|---|---|---|
| 5634d2b | Tina Lasisi | 2026-04-16 |
| Version | Author | Date |
|---|---|---|
| 5634d2b | Tina Lasisi | 2026-04-16 |
| Version | Author | Date |
|---|---|---|
| 5634d2b | Tina Lasisi | 2026-04-16 |
| Version | Author | Date |
|---|---|---|
| 5634d2b | Tina Lasisi | 2026-04-16 |
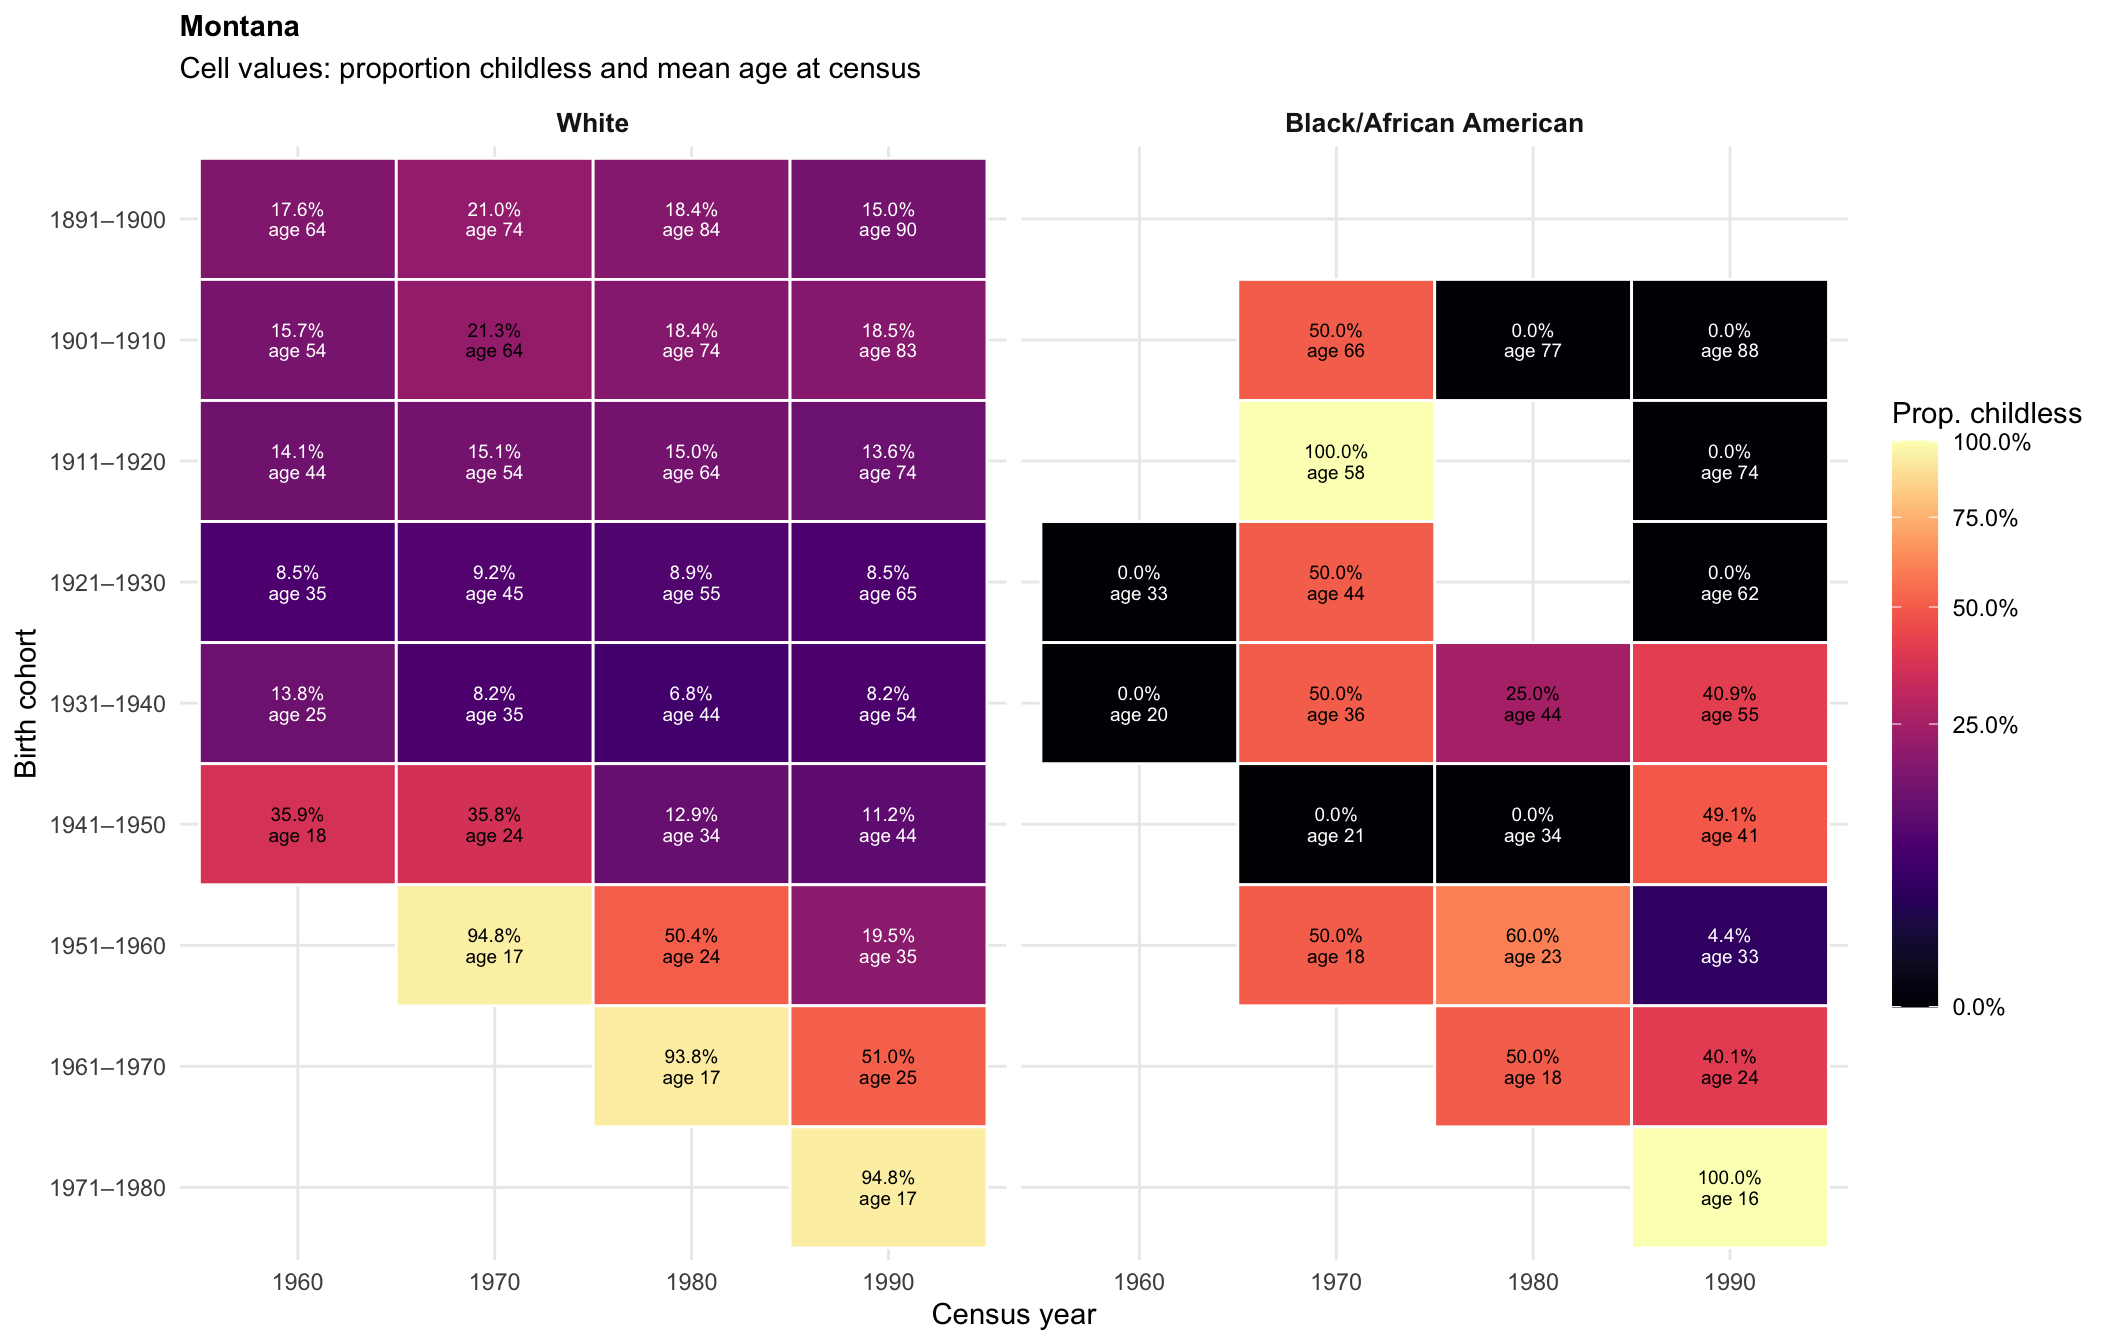
| Version | Author | Date |
|---|---|---|
| 5634d2b | Tina Lasisi | 2026-04-16 |
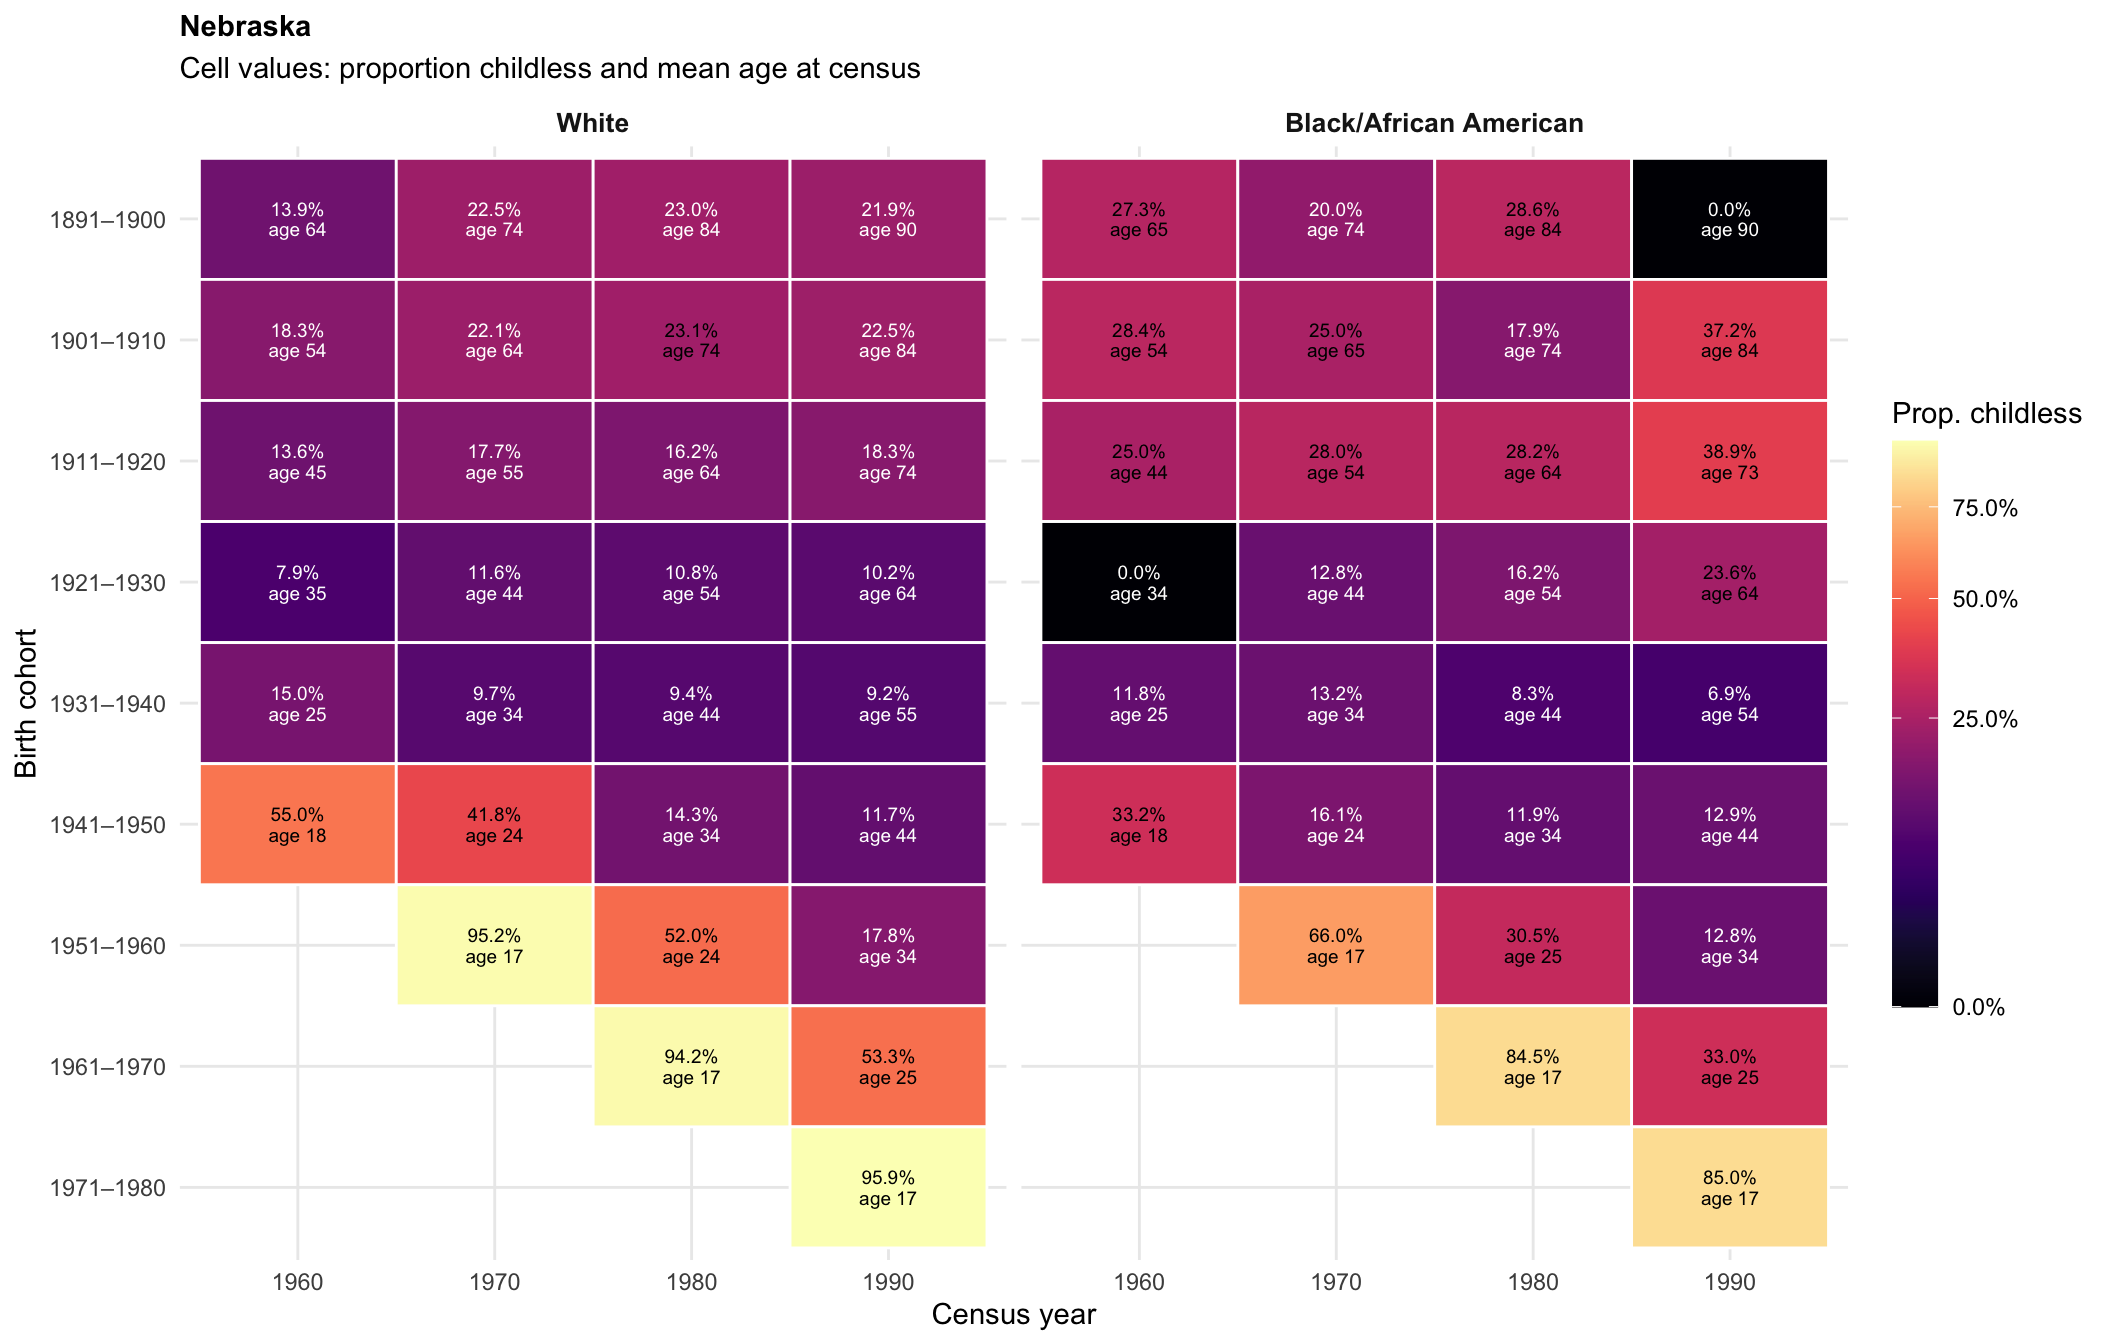
| Version | Author | Date |
|---|---|---|
| 5634d2b | Tina Lasisi | 2026-04-16 |
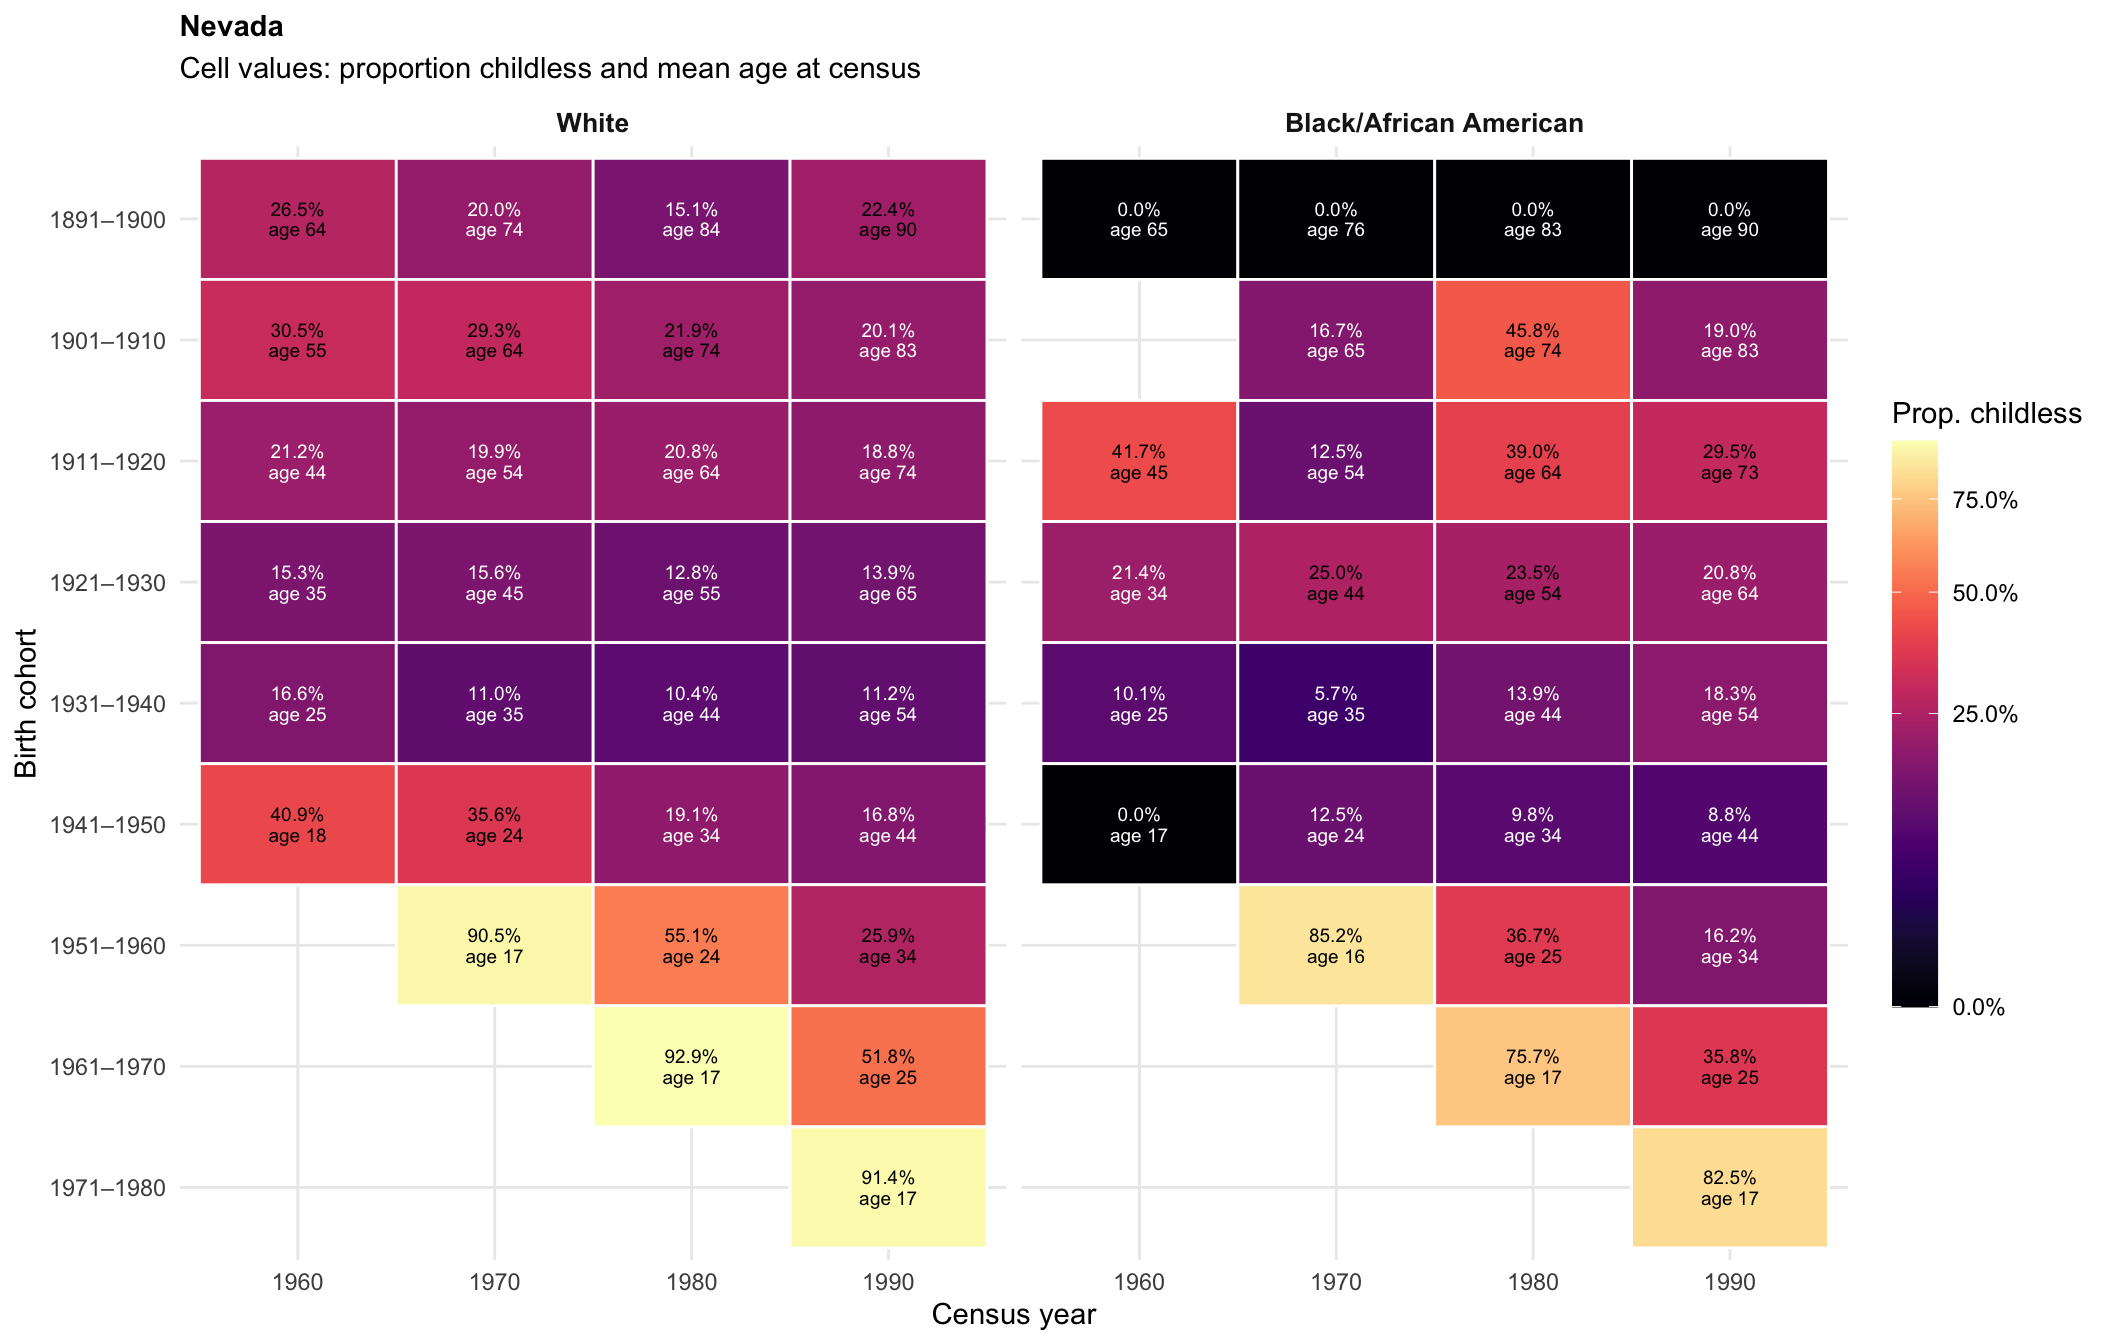
| Version | Author | Date |
|---|---|---|
| 5634d2b | Tina Lasisi | 2026-04-16 |
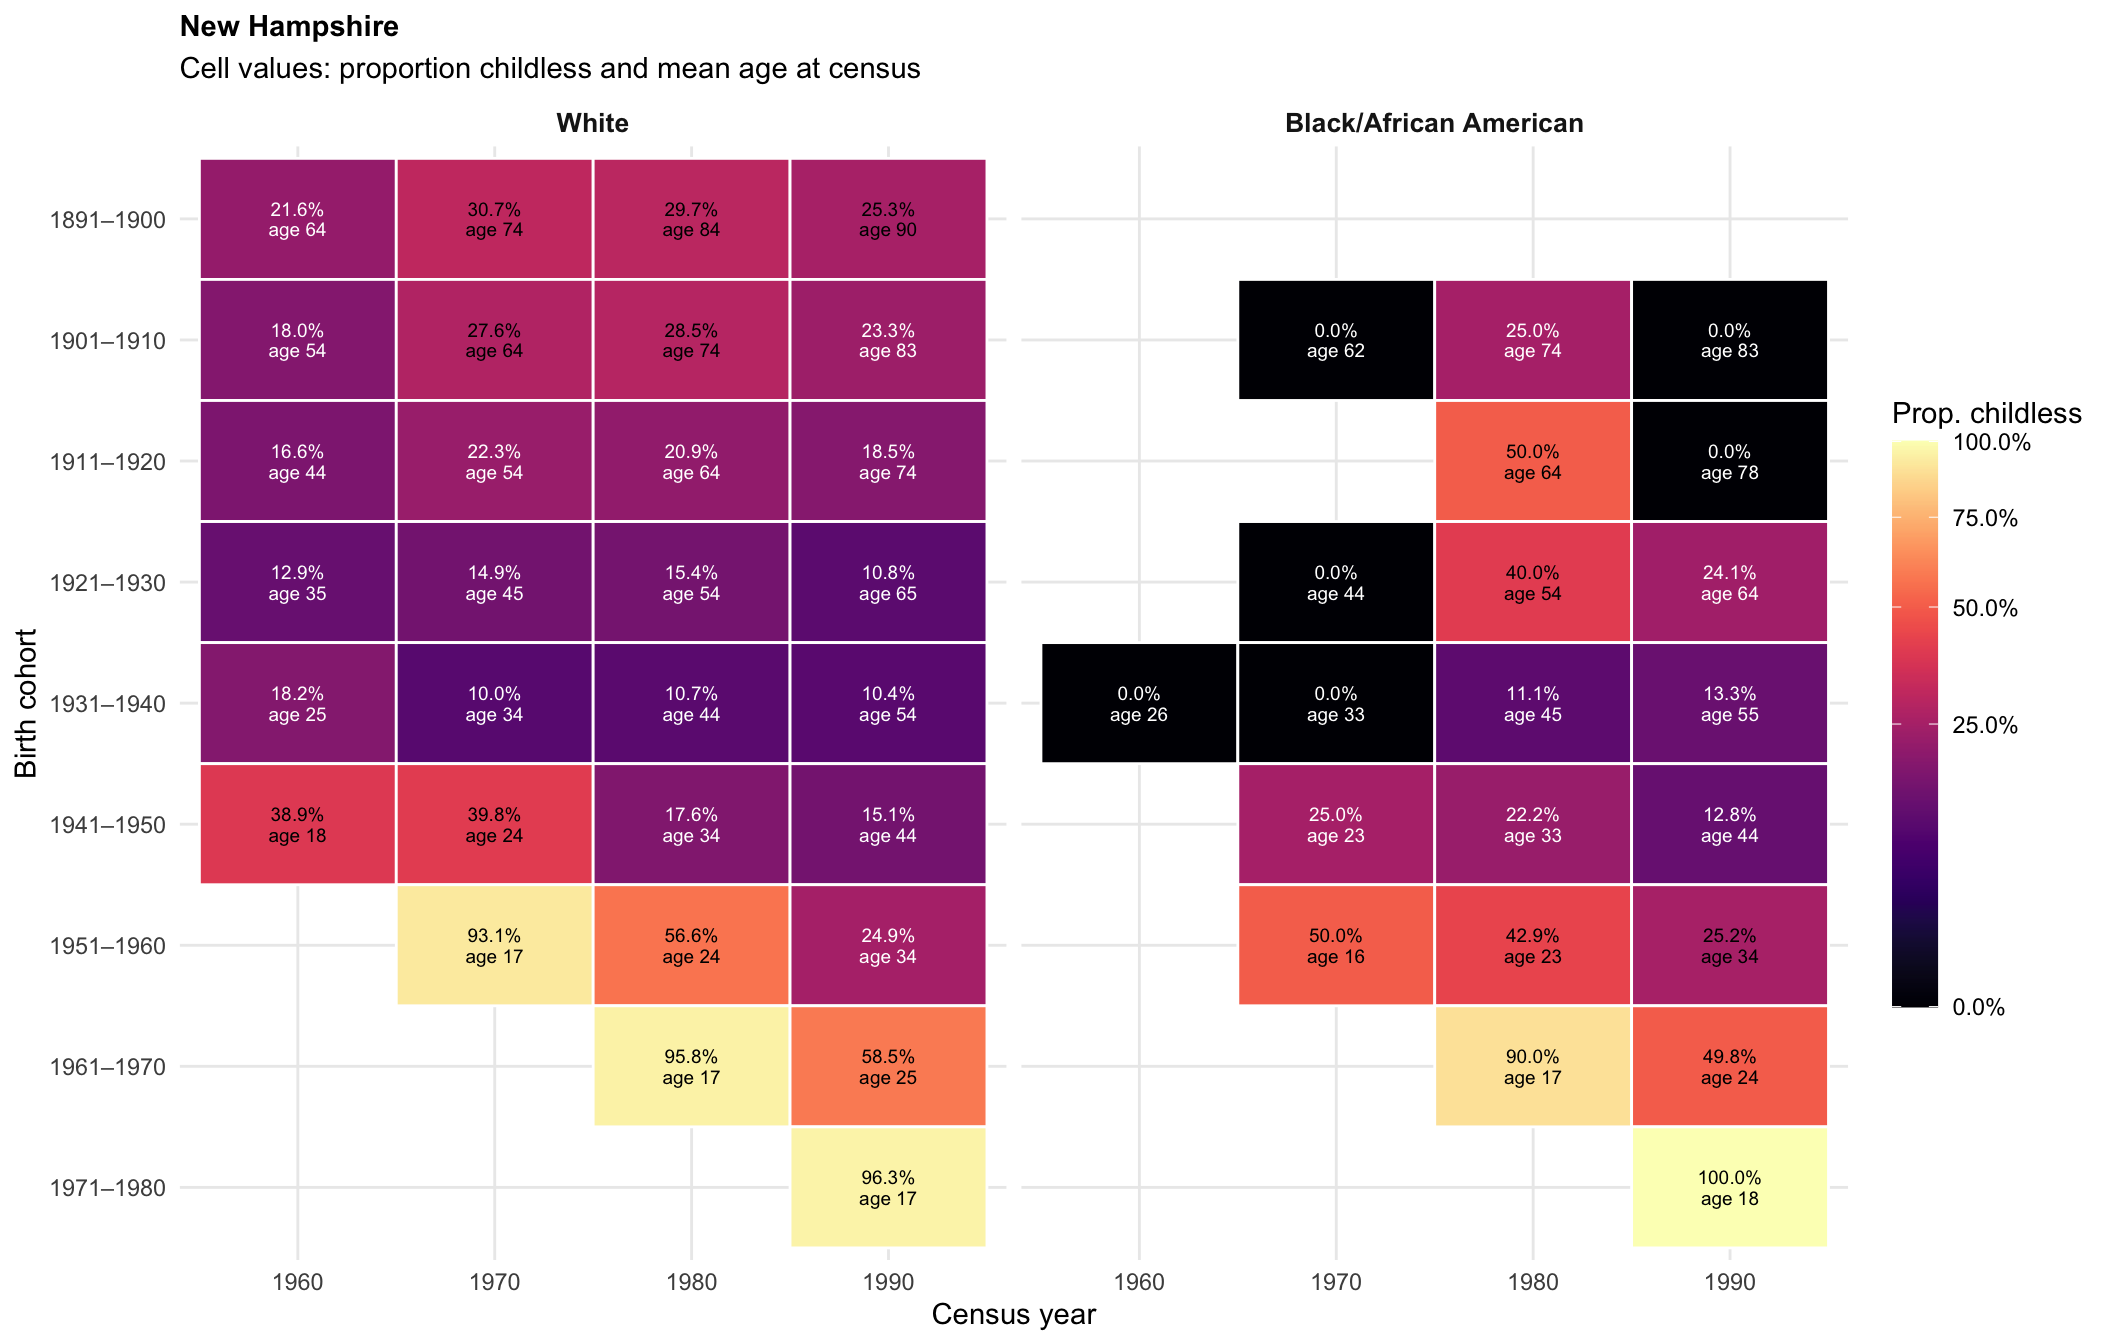
| Version | Author | Date |
|---|---|---|
| 5634d2b | Tina Lasisi | 2026-04-16 |
| Version | Author | Date |
|---|---|---|
| 5634d2b | Tina Lasisi | 2026-04-16 |
| Version | Author | Date |
|---|---|---|
| 5634d2b | Tina Lasisi | 2026-04-16 |
| Version | Author | Date |
|---|---|---|
| 5634d2b | Tina Lasisi | 2026-04-16 |
| Version | Author | Date |
|---|---|---|
| 5634d2b | Tina Lasisi | 2026-04-16 |
| Version | Author | Date |
|---|---|---|
| 5634d2b | Tina Lasisi | 2026-04-16 |
| Version | Author | Date |
|---|---|---|
| 5634d2b | Tina Lasisi | 2026-04-16 |
| Version | Author | Date |
|---|---|---|
| 5634d2b | Tina Lasisi | 2026-04-16 |
| Version | Author | Date |
|---|---|---|
| 5634d2b | Tina Lasisi | 2026-04-16 |
| Version | Author | Date |
|---|---|---|
| 5634d2b | Tina Lasisi | 2026-04-16 |
| Version | Author | Date |
|---|---|---|
| 5634d2b | Tina Lasisi | 2026-04-16 |
| Version | Author | Date |
|---|---|---|
| 5634d2b | Tina Lasisi | 2026-04-16 |
| Version | Author | Date |
|---|---|---|
| 5634d2b | Tina Lasisi | 2026-04-16 |
| Version | Author | Date |
|---|---|---|
| 5634d2b | Tina Lasisi | 2026-04-16 |
| Version | Author | Date |
|---|---|---|
| 5634d2b | Tina Lasisi | 2026-04-16 |
| Version | Author | Date |
|---|---|---|
| 5634d2b | Tina Lasisi | 2026-04-16 |
| Version | Author | Date |
|---|---|---|
| 5634d2b | Tina Lasisi | 2026-04-16 |
| Version | Author | Date |
|---|---|---|
| 5634d2b | Tina Lasisi | 2026-04-16 |
| Version | Author | Date |
|---|---|---|
| 5634d2b | Tina Lasisi | 2026-04-16 |
| Version | Author | Date |
|---|---|---|
| 5634d2b | Tina Lasisi | 2026-04-16 |
| Version | Author | Date |
|---|---|---|
| 5634d2b | Tina Lasisi | 2026-04-16 |
| Version | Author | Date |
|---|---|---|
| 5634d2b | Tina Lasisi | 2026-04-16 |
Trajectory plots (per state)
eligible_cohort_states <- cohort_state %>%
  filter(!is.na(prop_zero)) %>%
  group_by(state_name, RACE) %>%
  summarise(n_points = n_distinct(paste(cohort_label, YEAR)), .groups = "drop") %>%
  filter(n_points >= 2) %>%
  pull(state_name) %>%
  unique() %>%
  sort()

cat(length(eligible_cohort_states),
    "states with adequate cohort data for trajectory plots\n")
51 states with adequate cohort data for trajectory plots
for (st in eligible_cohort_states) {
  st_cohort <- cohort_state %>%
    filter(state_name == st, !is.na(prop_zero))

  if (nrow(st_cohort) == 0) next

  p <- plot_cohort_stability(st_cohort, title = st,
                             pop_unit = 1e3, pop_label = "thousands")

  print(p)
  cat("\n\n")
}
9c. Regional cohort trajectories: Census divisions
cohort_division <- data_cohort %>%
  mutate(division = state_to_division(as.character(STATEFIP))) %>%
  filter(!is.na(division)) %>%
  group_by(division, cohort_label, YEAR, AGE_RANGE, RACE) %>%
  summarise(
    n_obs     = n(),
    prop_zero = weighted.mean(chborn_num == 0, w = PERWT),
    n_pop     = sum(PERWT),
    mean_age  = weighted.mean(AGE, w = PERWT),
    .groups   = "drop"
  ) %>%
  mutate(
    prop_zero = prop_zero,
    age_label = paste0("age ", round(mean_age)),
    completed = AGE_RANGE >= "50-59"
  ) %>%
  filter(cohort_label %in% cohorts_of_interest)
Trajectory plots (per division)
for (div in sort(unique(cohort_division$division))) {
  div_cohort <- cohort_division %>%
    filter(division == div, !is.na(prop_zero))

  if (nrow(div_cohort) == 0) next

  states_in_div <- data_cohort %>%
    mutate(division = state_to_division(as.character(STATEFIP))) %>%
    filter(division == div) %>%
    pull(state_name) %>% unique() %>% sort()

  plot_title <- paste0("Census Division: ", div, "\n",
                       str_wrap(paste(states_in_div, collapse = ", "), width = 80))

  p <- plot_cohort_stability(div_cohort, title = plot_title)

  print(p)
  cat("\n\n")
}
Cohort × Census Year matrices (per division)
for (div in sort(unique(cohort_division$division))) {
  div_mat <- cohort_division %>%
    filter(division == div)

  if (nrow(div_mat) == 0) next

  states_in_div <- data_cohort %>%
    mutate(division = state_to_division(as.character(STATEFIP))) %>%
    filter(division == div) %>%
    pull(state_name) %>% unique() %>% sort()

  mat_title <- paste0("Census Division: ", div, "\n",
                      str_wrap(paste(states_in_div, collapse = ", "), width = 80))

  p <- plot_cohort_matrix(div_mat, title = mat_title)
  print(p)
  cat("\n\n")
}
| Version | Author | Date |
|---|---|---|
| 5634d2b | Tina Lasisi | 2026-04-16 |
| Version | Author | Date |
|---|---|---|
| 5634d2b | Tina Lasisi | 2026-04-16 |
| Version | Author | Date |
|---|---|---|
| 5634d2b | Tina Lasisi | 2026-04-16 |
| Version | Author | Date |
|---|---|---|
| 5634d2b | Tina Lasisi | 2026-04-16 |
| Version | Author | Date |
|---|---|---|
| 5634d2b | Tina Lasisi | 2026-04-16 |
| Version | Author | Date |
|---|---|---|
| 5634d2b | Tina Lasisi | 2026-04-16 |
| Version | Author | Date |
|---|---|---|
| 5634d2b | Tina Lasisi | 2026-04-16 |
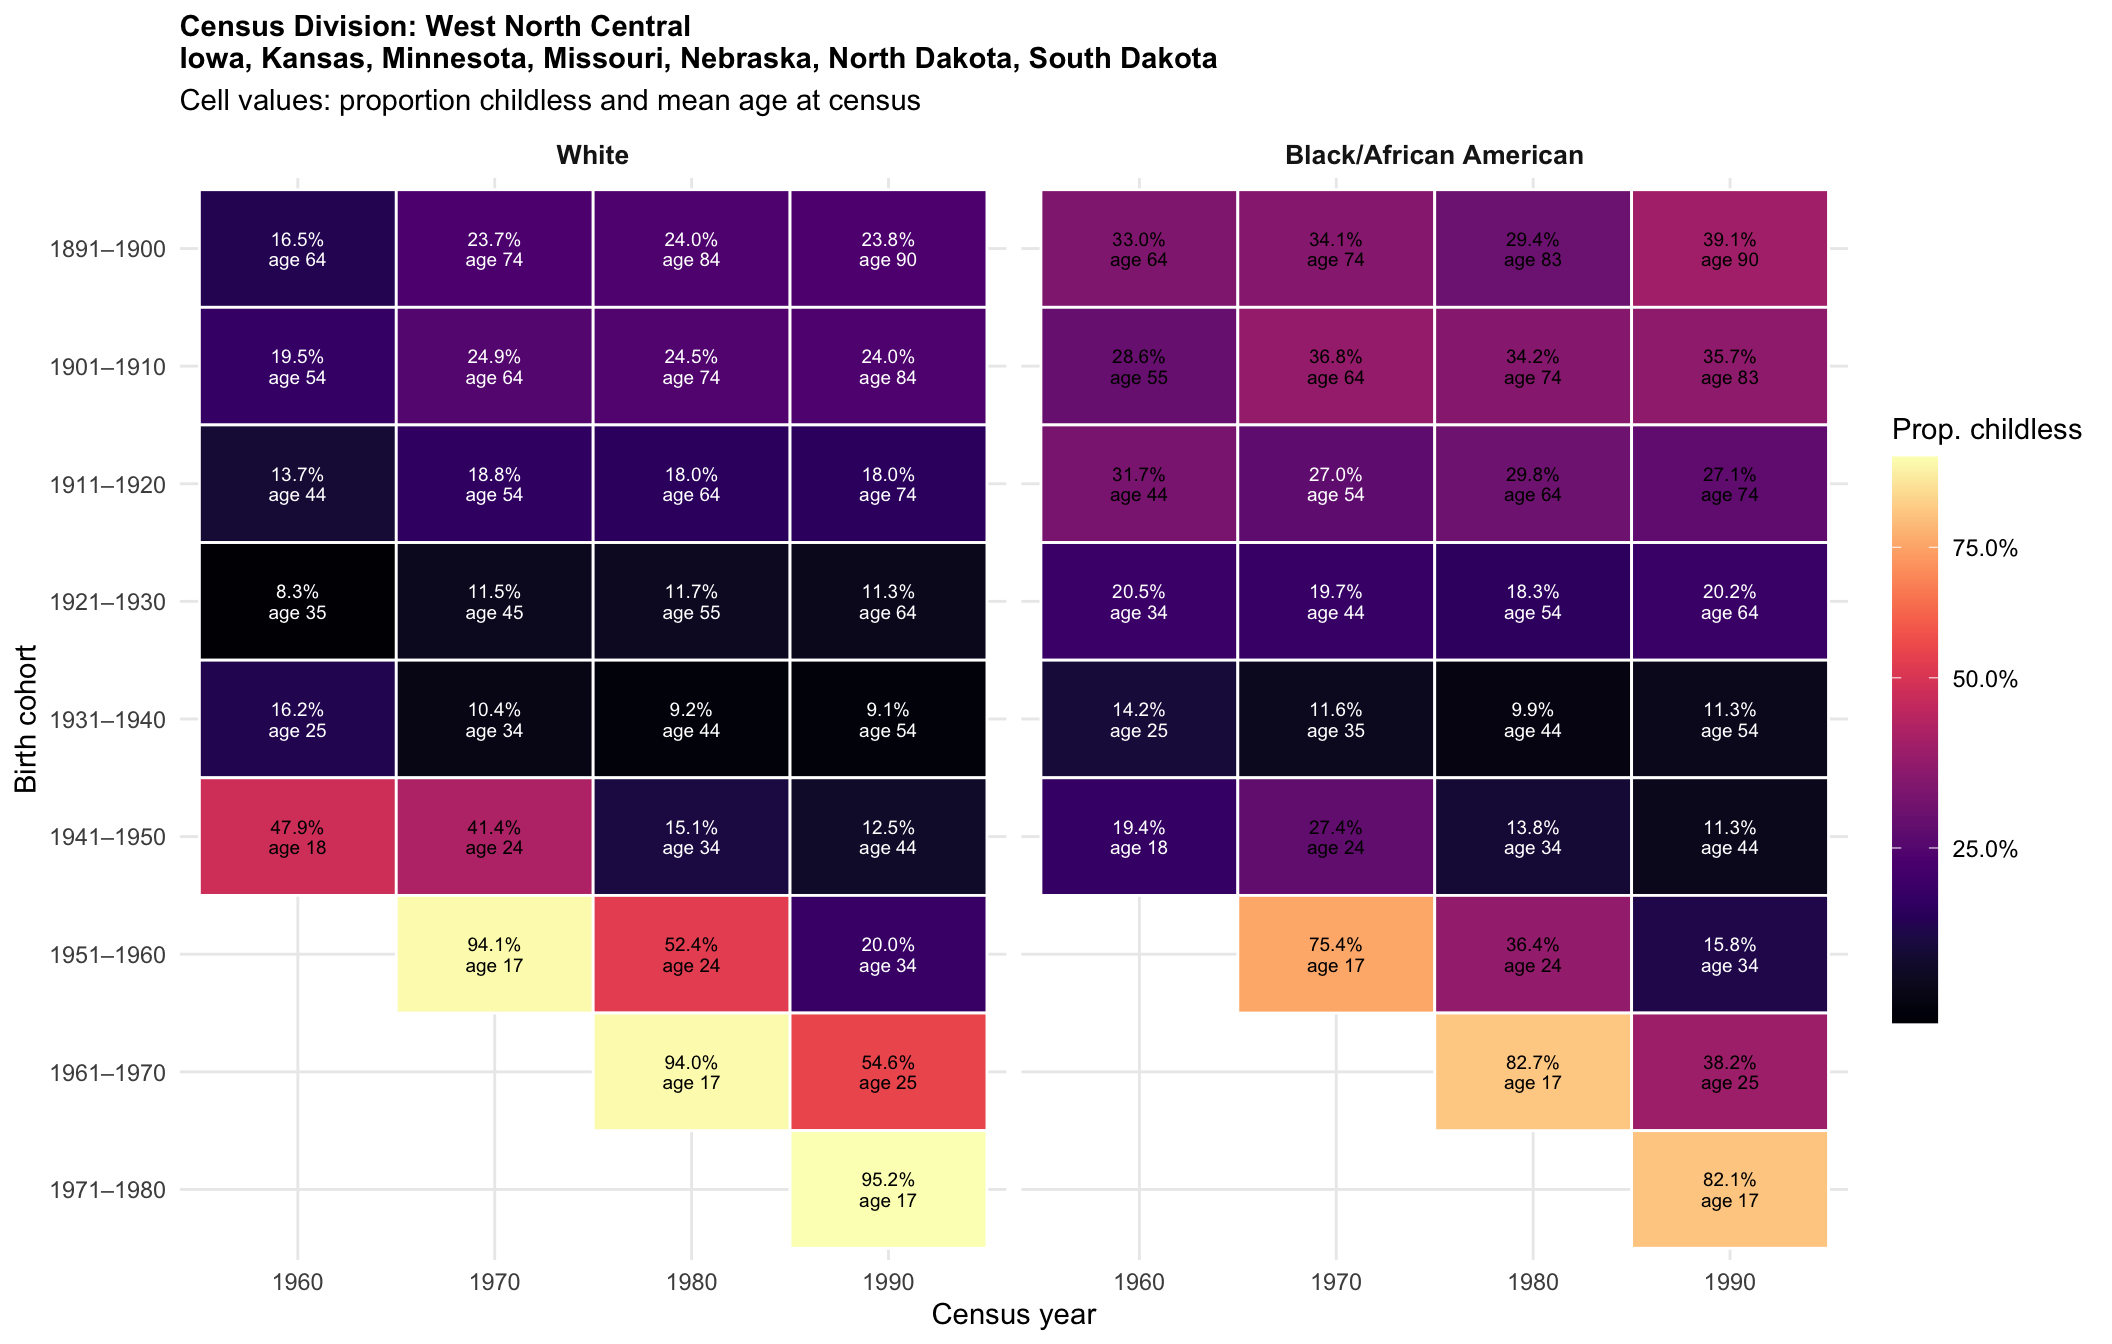
| Version | Author | Date |
|---|---|---|
| 5634d2b | Tina Lasisi | 2026-04-16 |
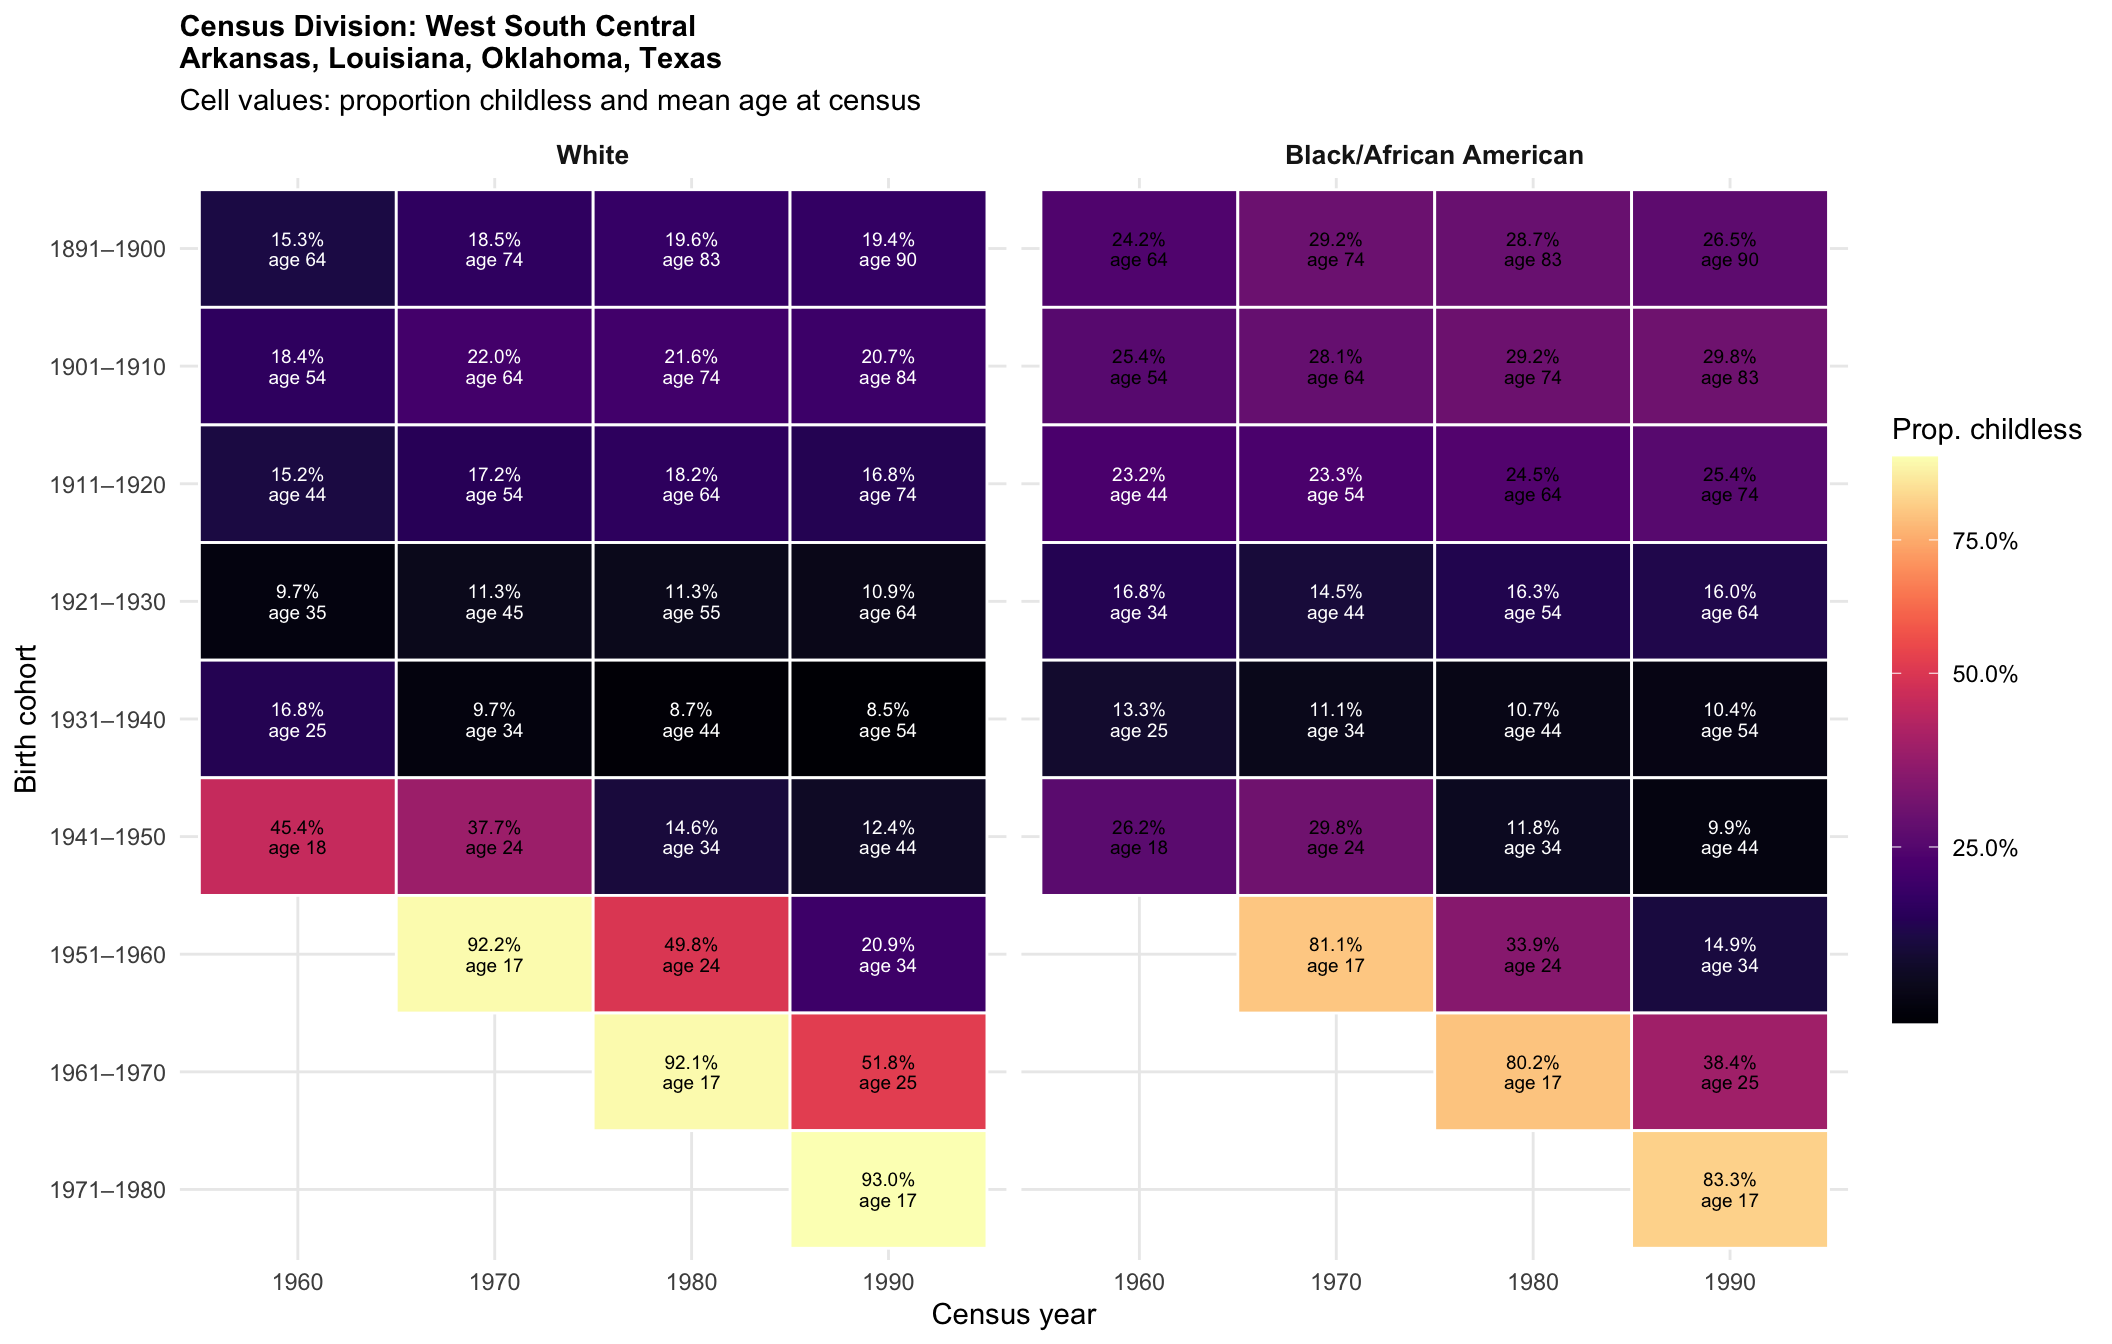
| Version | Author | Date |
|---|---|---|
| 5634d2b | Tina Lasisi | 2026-04-16 |
Choropleth maps: Birth Cohort × Age Group (by division)
all_state_names <- sort(unique(data_cohort$state_name))

plot_cohort_grid_regional(
  cohort_division, "White",
  group_var    = "division",
  state_lookup = state_to_division,
  all_states   = all_state_names
)
Warning in left_join(., sub_reg %>% select(grp = all_of(group_var), prop_zero), : Detected an unexpected many-to-many relationship between `x` and `y`.
ℹ Row 1 of `x` matches multiple rows in `y`.
ℹ Row 11 of `y` matches multiple rows in `x`.
ℹ If a many-to-many relationship is expected, set `relationship =
"many-to-many"` to silence this warning.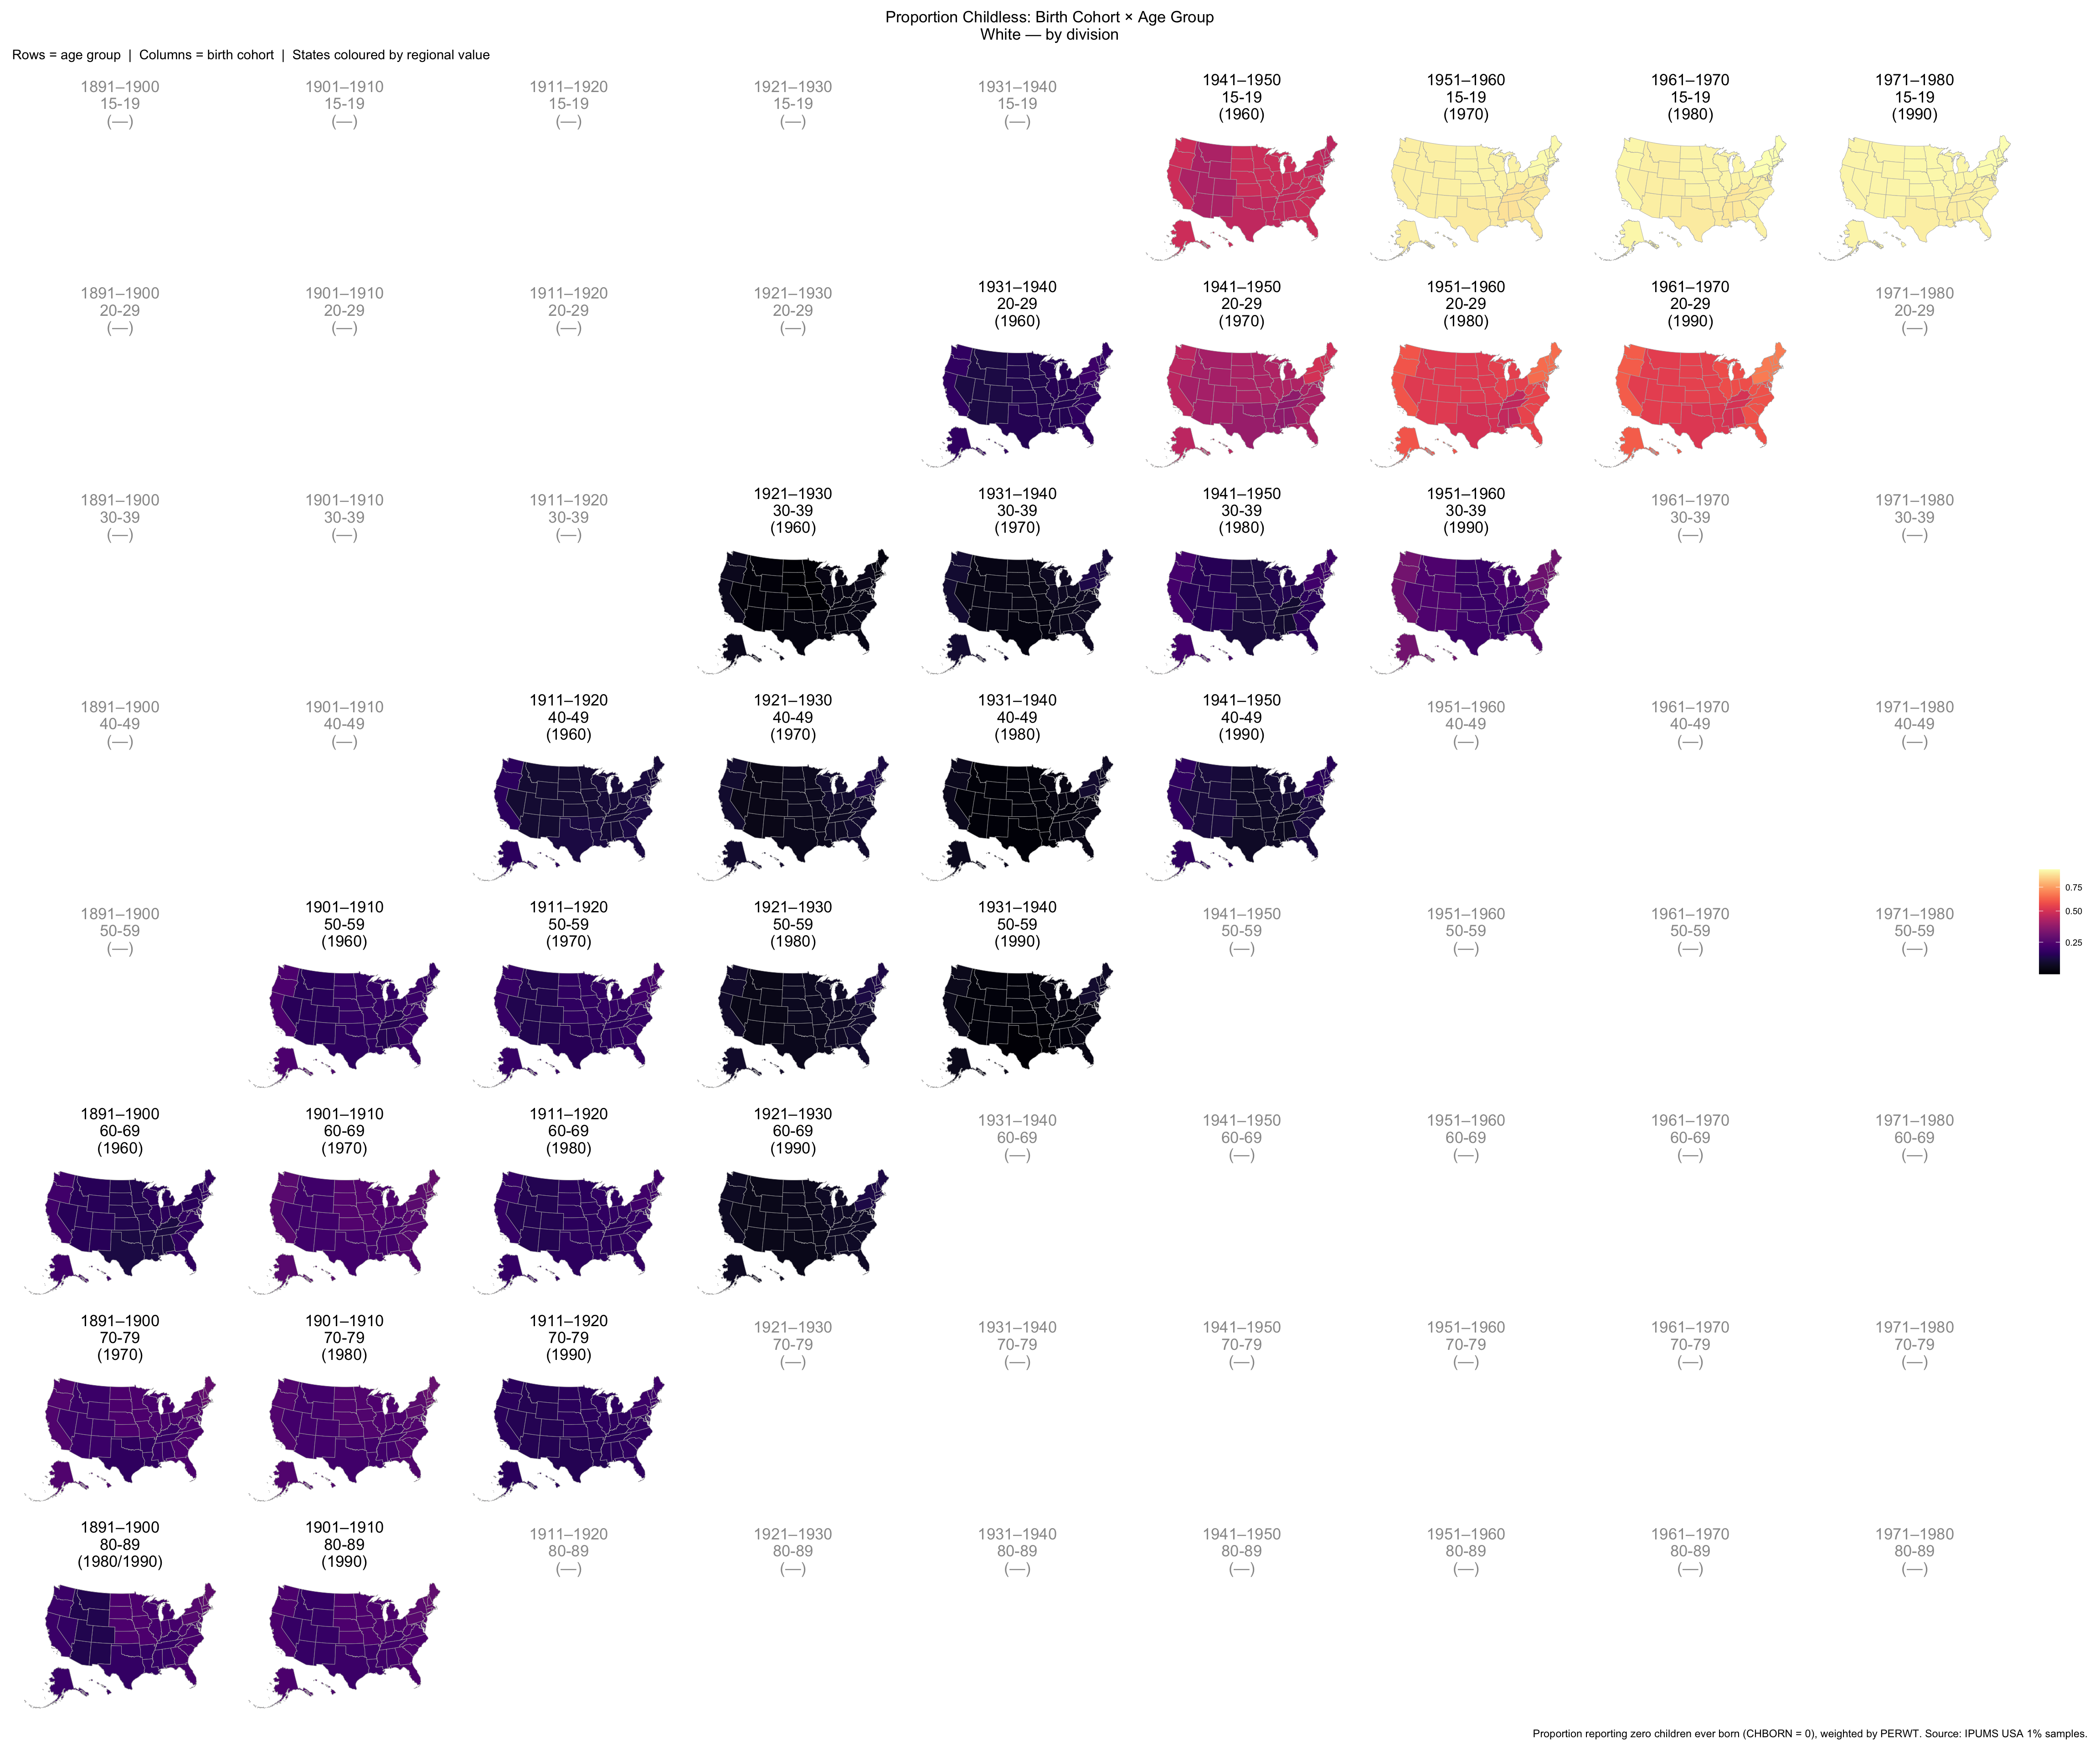
plot_cohort_grid_regional(
  cohort_division, "Black/African American",
  group_var    = "division",
  state_lookup = state_to_division,
  all_states   = all_state_names
)
Warning in left_join(., sub_reg %>% select(grp = all_of(group_var), prop_zero), : Detected an unexpected many-to-many relationship between `x` and `y`.
ℹ Row 1 of `x` matches multiple rows in `y`.
ℹ Row 11 of `y` matches multiple rows in `x`.
ℹ If a many-to-many relationship is expected, set `relationship =
"many-to-many"` to silence this warning.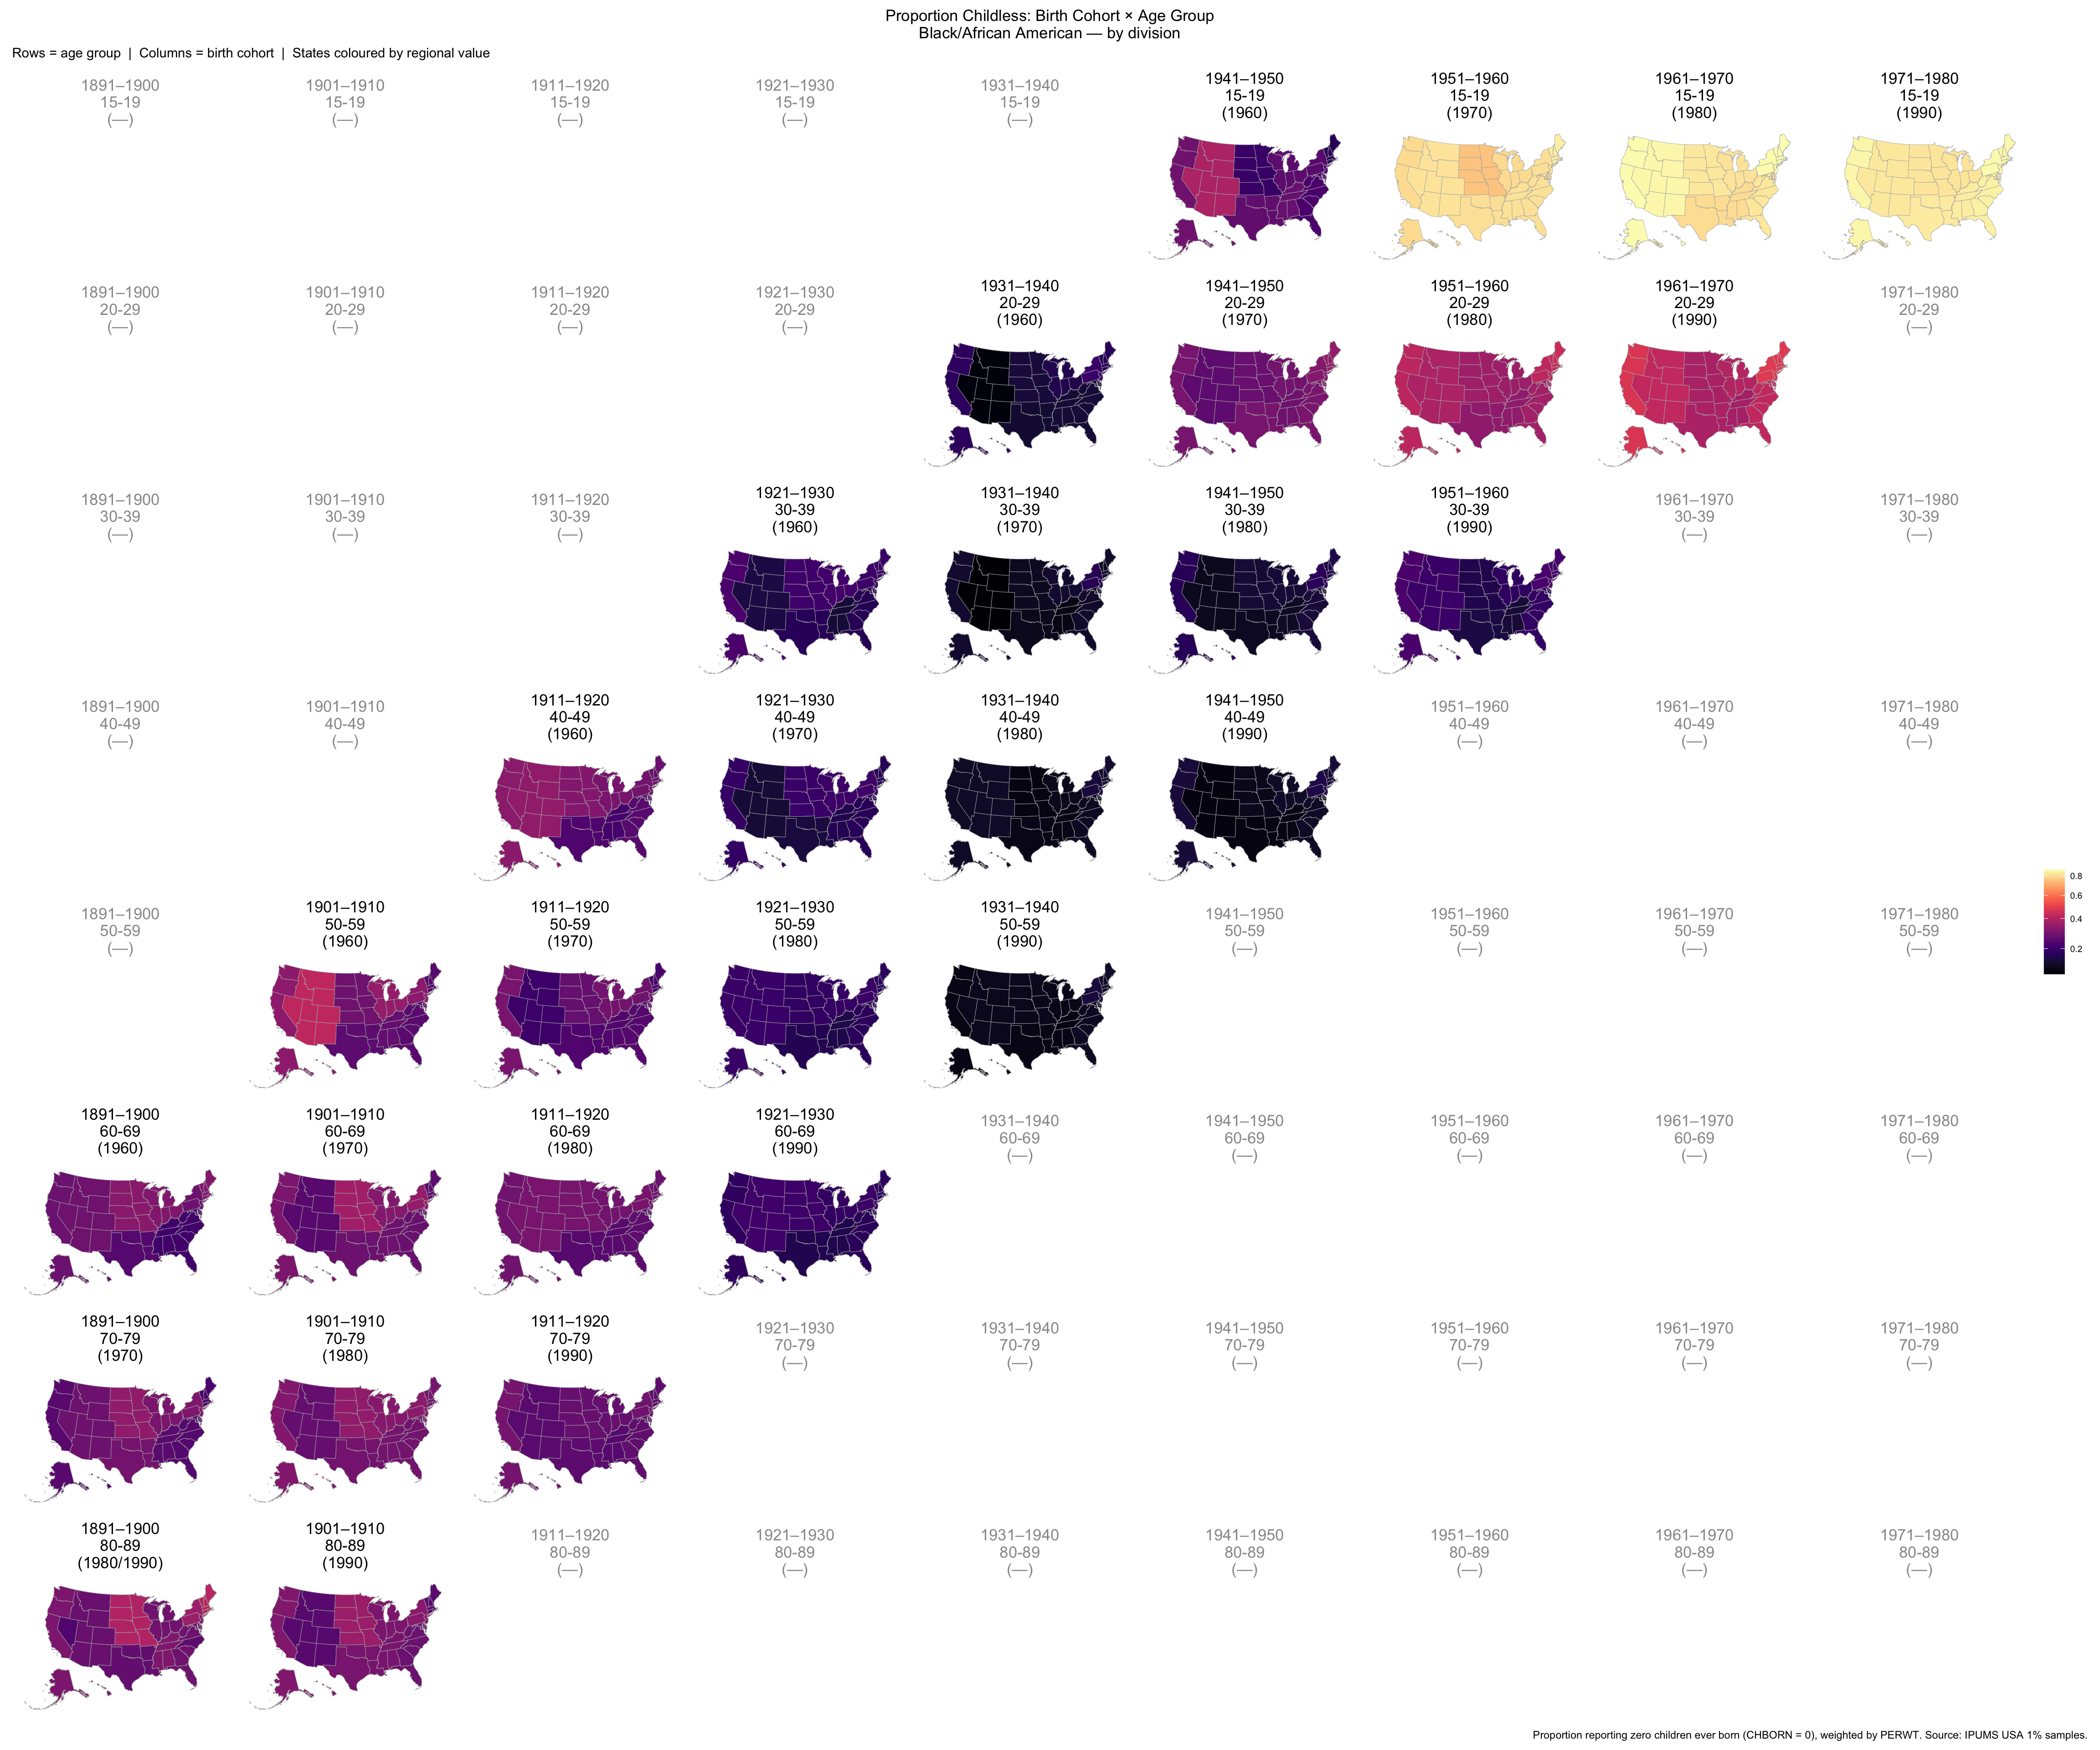
9d. Regional cohort trajectories: College sports conferences
cohort_conf <- data_cohort %>%
  mutate(conference = state_to_conference(as.character(STATEFIP))) %>%
  filter(!is.na(conference)) %>%
  group_by(conference, cohort_label, YEAR, AGE_RANGE, RACE) %>%
  summarise(
    n_obs     = n(),
    prop_zero = weighted.mean(chborn_num == 0, w = PERWT),
    n_pop     = sum(PERWT),
    mean_age  = weighted.mean(AGE, w = PERWT),
    .groups   = "drop"
  ) %>%
  mutate(
    prop_zero = prop_zero,
    age_label = paste0("age ", round(mean_age)),
    completed = AGE_RANGE >= "50-59"
  ) %>%
  filter(cohort_label %in% cohorts_of_interest)
Trajectory plots (per conference)
for (conf in sort(unique(cohort_conf$conference))) {
  conf_cohort <- cohort_conf %>%
    filter(conference == conf, !is.na(prop_zero))

  if (nrow(conf_cohort) == 0) next

  states_in_conf <- data_cohort %>%
    mutate(conference = state_to_conference(as.character(STATEFIP))) %>%
    filter(conference == conf) %>%
    pull(state_name) %>% unique() %>% sort()

  plot_title <- paste0("Conference: ", conf, "\n",
                       str_wrap(paste(states_in_conf, collapse = ", "), width = 80))

  p <- plot_cohort_stability(conf_cohort, title = plot_title)

  print(p)
  cat("\n\n")
}
Cohort × Census Year matrices (per conference)
for (conf in sort(unique(cohort_conf$conference))) {
  conf_mat <- cohort_conf %>%
    filter(conference == conf)

  if (nrow(conf_mat) == 0) next

  states_in_conf <- data_cohort %>%
    mutate(conference = state_to_conference(as.character(STATEFIP))) %>%
    filter(conference == conf) %>%
    pull(state_name) %>% unique() %>% sort()

  mat_title <- paste0("Conference: ", conf, "\n",
                      str_wrap(paste(states_in_conf, collapse = ", "), width = 80))

  p <- plot_cohort_matrix(conf_mat, title = mat_title)
  print(p)
  cat("\n\n")
}
| Version | Author | Date |
|---|---|---|
| 5634d2b | Tina Lasisi | 2026-04-16 |
| Version | Author | Date |
|---|---|---|
| 5634d2b | Tina Lasisi | 2026-04-16 |
| Version | Author | Date |
|---|---|---|
| 5634d2b | Tina Lasisi | 2026-04-16 |
| Version | Author | Date |
|---|---|---|
| 5634d2b | Tina Lasisi | 2026-04-16 |
| Version | Author | Date |
|---|---|---|
| 5634d2b | Tina Lasisi | 2026-04-16 |
Choropleth maps: Birth Cohort × Age Group (by conference)
plot_cohort_grid_regional(
  cohort_conf, "White",
  group_var    = "conference",
  state_lookup = state_to_conference,
  all_states   = all_state_names
)
Warning in left_join(., sub_reg %>% select(grp = all_of(group_var), prop_zero), : Detected an unexpected many-to-many relationship between `x` and `y`.
ℹ Row 1 of `x` matches multiple rows in `y`.
ℹ Row 9 of `y` matches multiple rows in `x`.
ℹ If a many-to-many relationship is expected, set `relationship =
"many-to-many"` to silence this warning.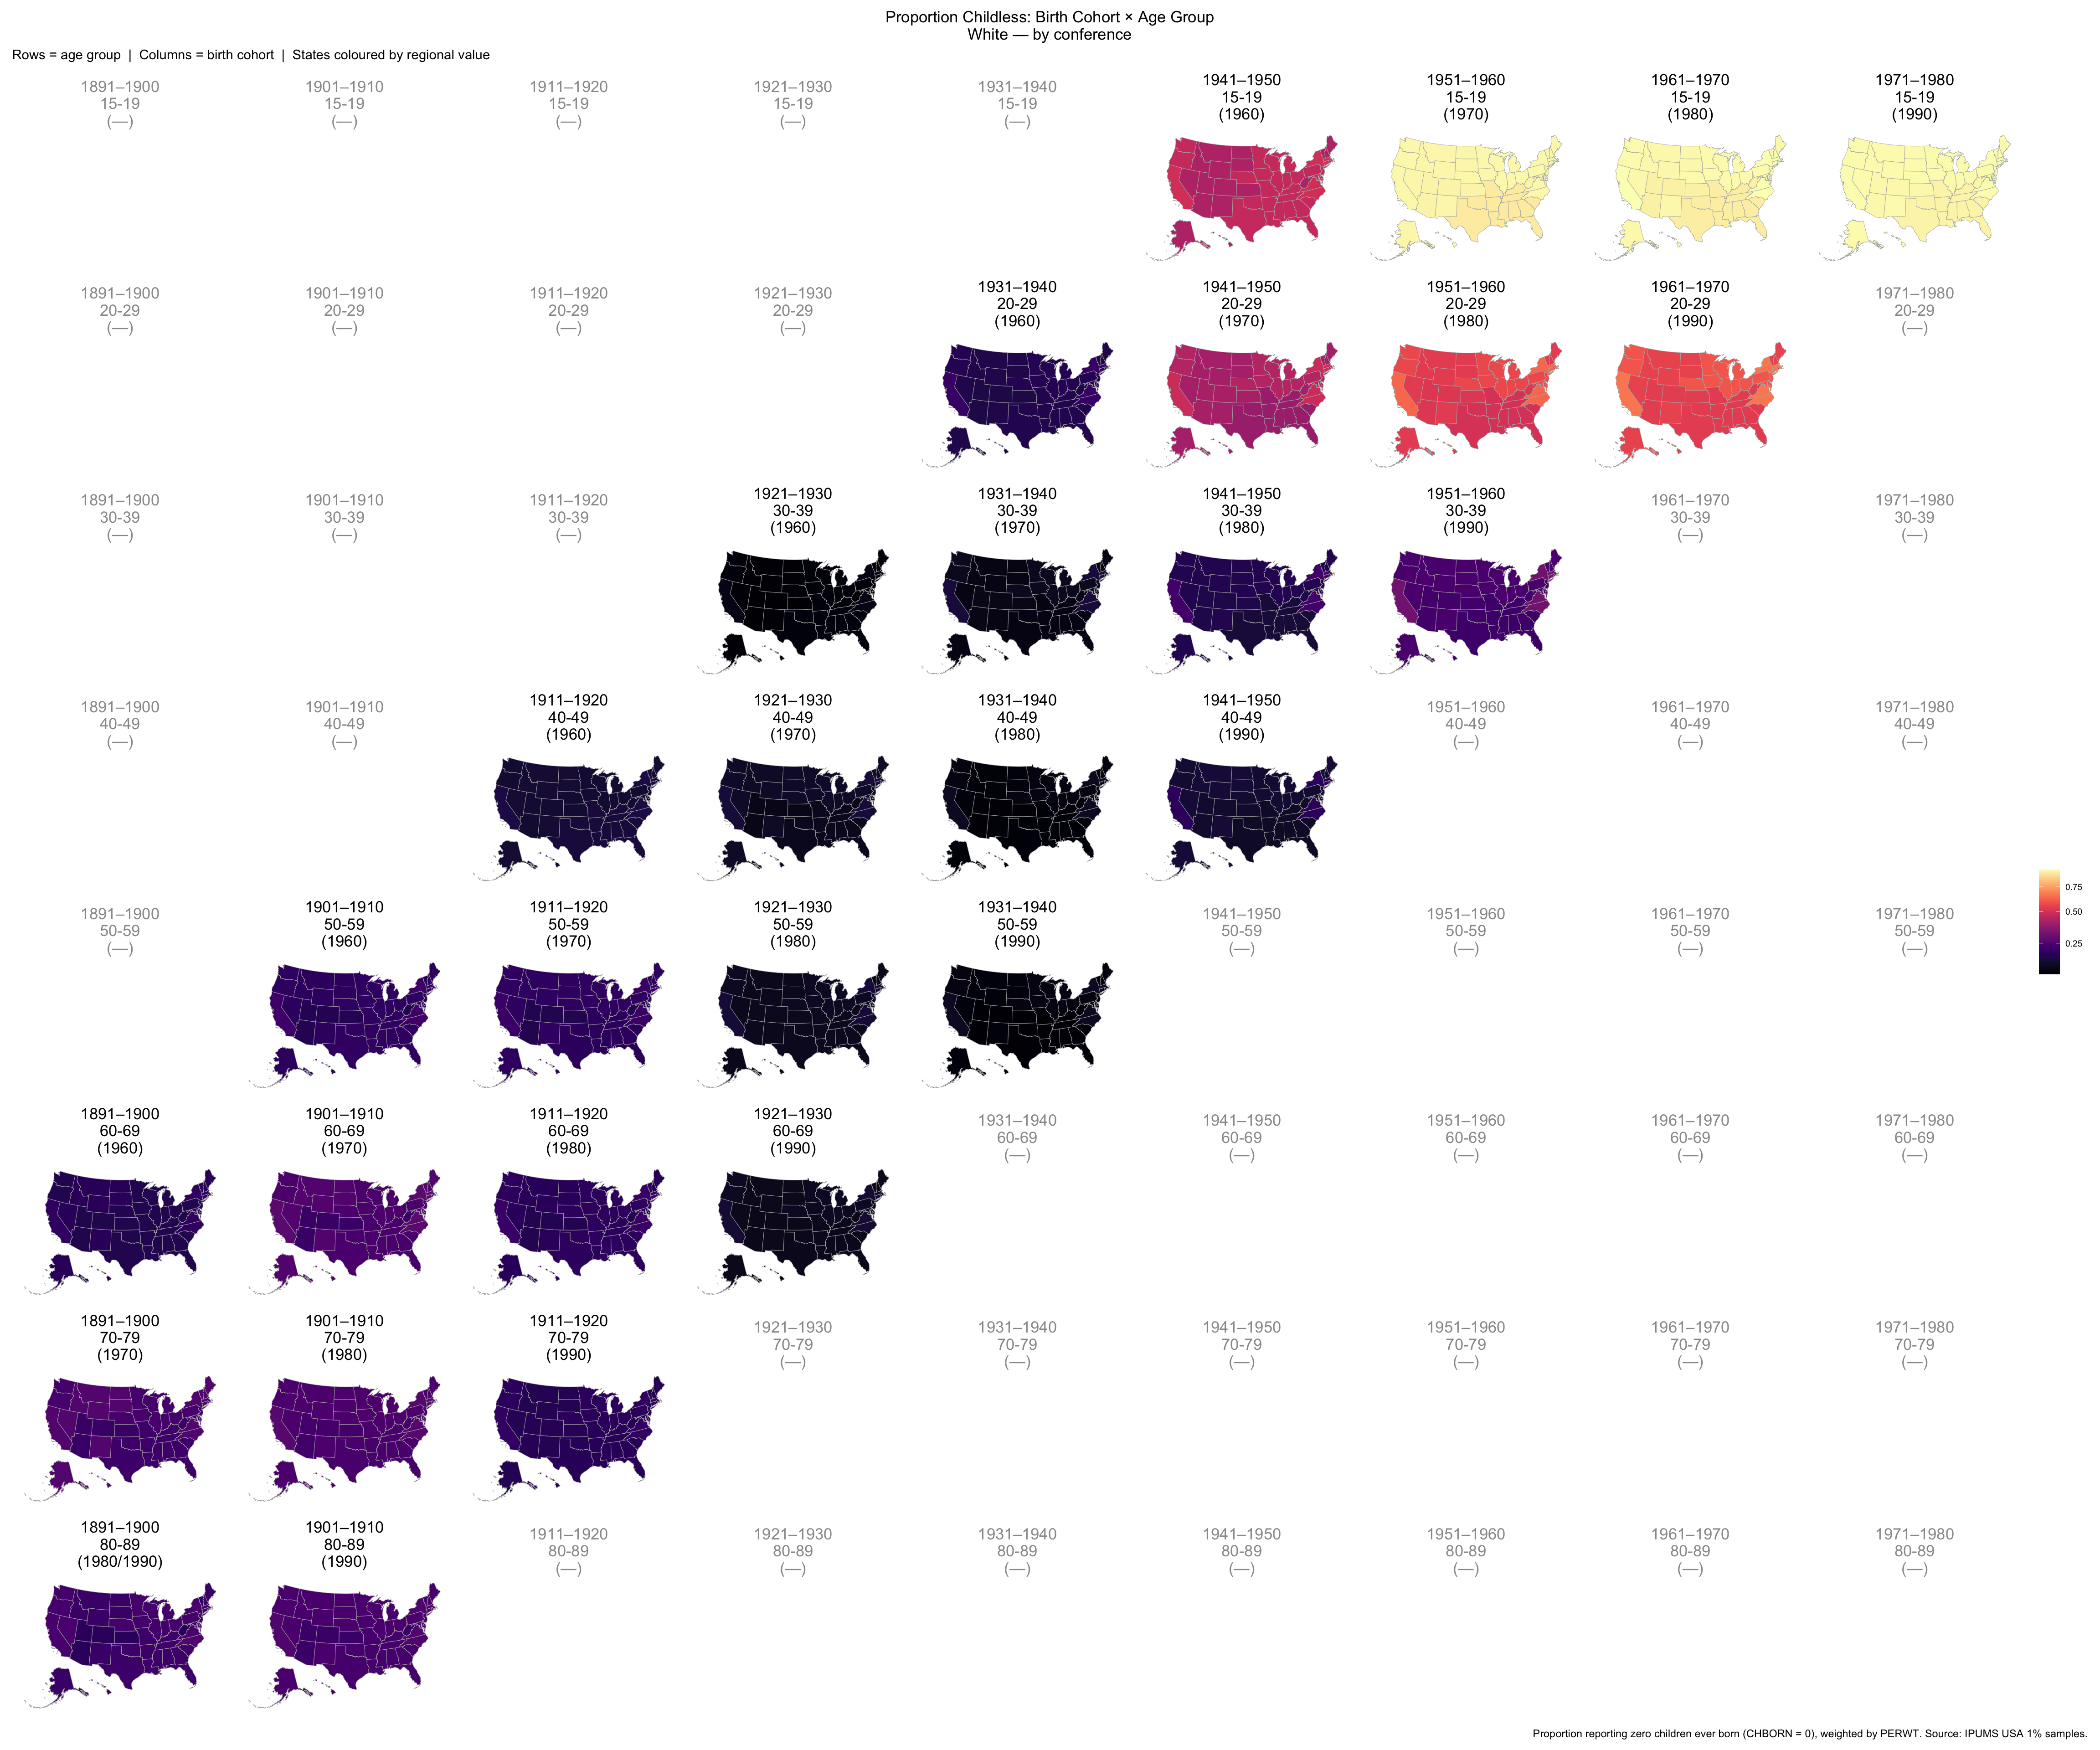
plot_cohort_grid_regional(
  cohort_conf, "Black/African American",
  group_var    = "conference",
  state_lookup = state_to_conference,
  all_states   = all_state_names
)
Warning in left_join(., sub_reg %>% select(grp = all_of(group_var), prop_zero), : Detected an unexpected many-to-many relationship between `x` and `y`.
ℹ Row 1 of `x` matches multiple rows in `y`.
ℹ Row 9 of `y` matches multiple rows in `x`.
ℹ If a many-to-many relationship is expected, set `relationship =
"many-to-many"` to silence this warning.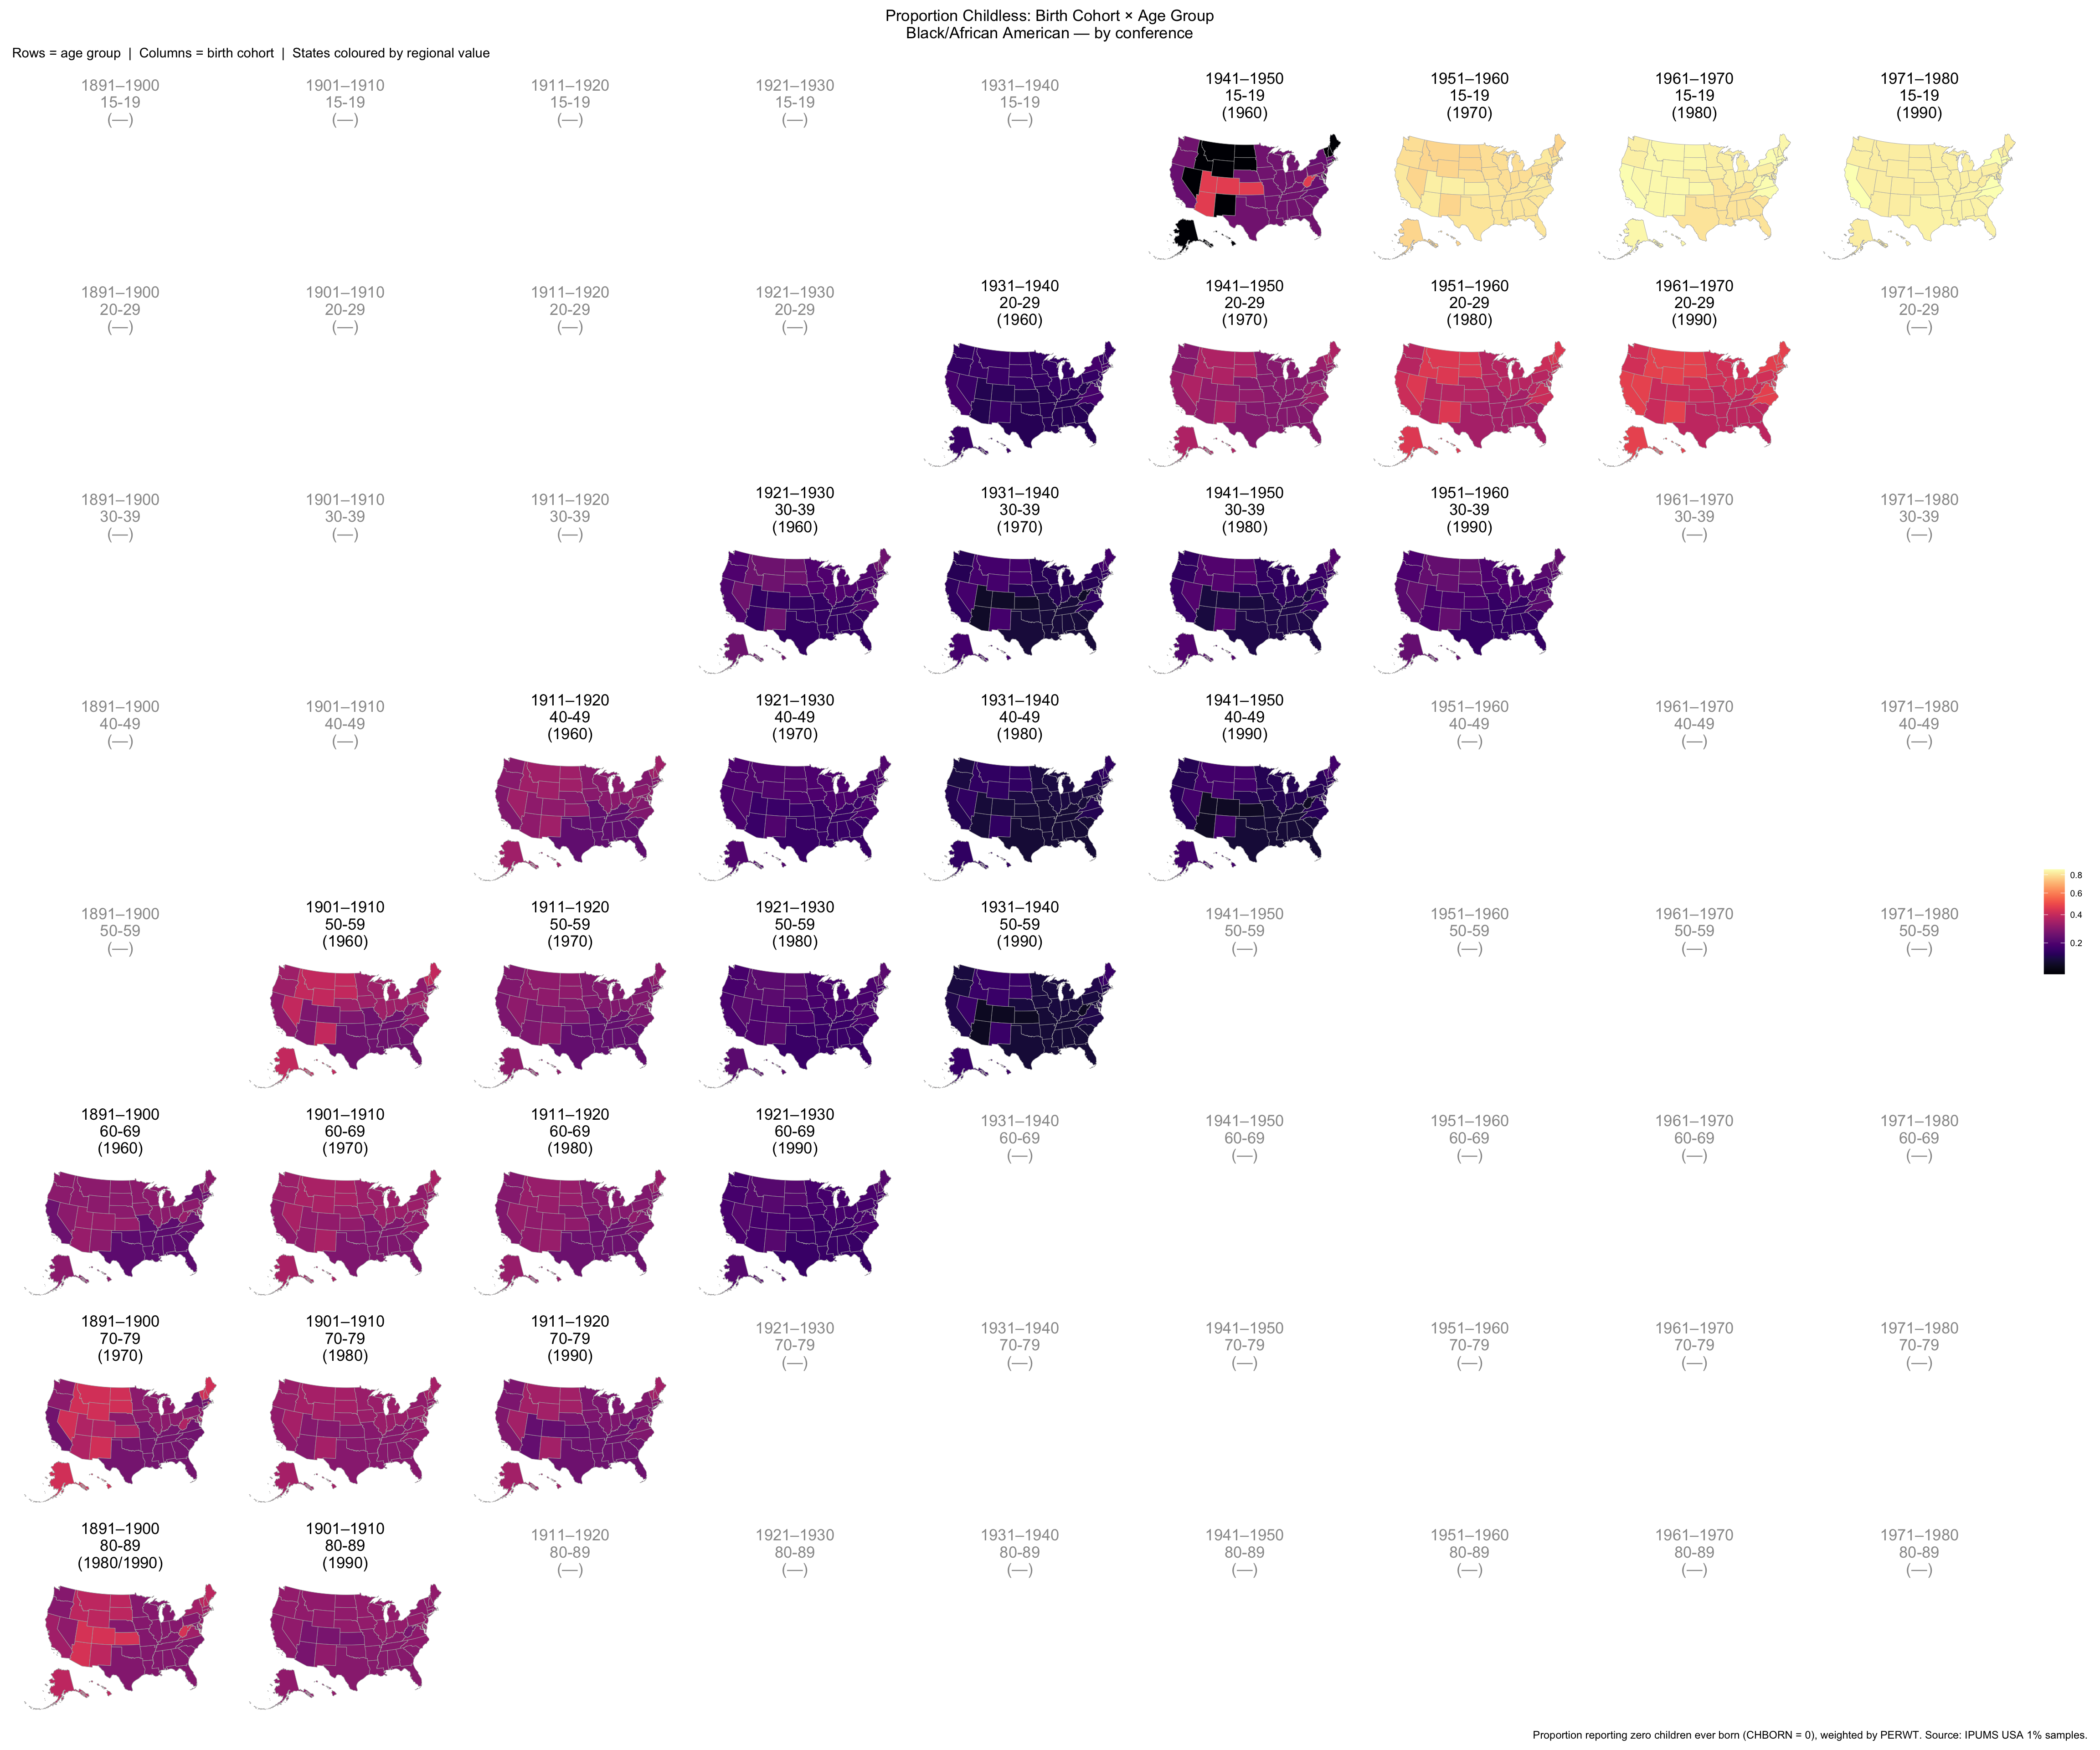
Session info
sessionInfo()R version 4.5.3 (2026-03-11)
Platform: aarch64-apple-darwin20
Running under: macOS Tahoe 26.4.1
Matrix products: default
BLAS: /Library/Frameworks/R.framework/Versions/4.5-arm64/Resources/lib/libRblas.0.dylib
LAPACK: /Library/Frameworks/R.framework/Versions/4.5-arm64/Resources/lib/libRlapack.dylib; LAPACK version 3.12.1
locale:
[1] C.UTF-8/C.UTF-8/C.UTF-8/C/C.UTF-8/C.UTF-8
time zone: America/Detroit
tzcode source: internal
attached base packages:
[1] stats graphics grDevices utils datasets methods base
other attached packages:
[1] ggrepel_0.9.8 scales_1.4.0 patchwork_1.3.1 viridis_0.6.5
[5] viridisLite_0.4.2 usmap_1.0.0 data.table_1.17.6 lubridate_1.9.4
[9] forcats_1.0.0 stringr_1.6.0 dplyr_1.1.4 purrr_1.2.0
[13] readr_2.1.5 tidyr_1.3.1 tibble_3.3.0 ggplot2_3.5.2
[17] tidyverse_2.0.0 ipumsr_0.10.0 workflowr_1.7.1
loaded via a namespace (and not attached):
[1] gtable_0.3.6 xfun_0.54 bslib_0.9.0 processx_3.8.6
[5] callr_3.7.6 tzdb_0.5.0 vctrs_0.6.5 tools_4.5.3
[9] ps_1.9.1 generics_0.1.4 proxy_0.4-27 pkgconfig_2.0.3
[13] KernSmooth_2.23-26 RColorBrewer_1.1-3 S7_0.2.1 lifecycle_1.0.4
[17] compiler_4.5.3 farver_2.1.2 git2r_0.36.2 getPass_0.2-4
[21] codetools_0.2-20 hipread_0.2.6 httpuv_1.6.16 class_7.3-23
[25] htmltools_0.5.8.1 sass_0.4.10 yaml_2.3.10 later_1.4.2
[29] pillar_1.11.1 jquerylib_0.1.4 whisker_0.4.1 classInt_0.4-11
[33] cachem_1.1.0 tidyselect_1.2.1 digest_0.6.37 stringi_1.8.7
[37] sf_1.0-21 labeling_0.4.3 rprojroot_2.1.1 fastmap_1.2.0
[41] grid_4.5.3 cli_3.6.5 magrittr_2.0.4 utf8_1.2.6
[45] dichromat_2.0-0.1 e1071_1.7-16 withr_3.0.2 promises_1.3.3
[49] timechange_0.3.0 rmarkdown_2.29 httr_1.4.7 gridExtra_2.3
[53] hms_1.1.3 evaluate_1.0.4 knitr_1.50 haven_2.5.5
[57] rlang_1.1.6 Rcpp_1.1.0 zeallot_0.2.0 DBI_1.2.3
[61] glue_1.8.0 xml2_1.3.8 usmapdata_1.0.0 rstudioapi_0.17.1
[65] jsonlite_2.0.0 R6_2.6.1 units_1.0-0 fs_1.6.6
sessionInfo()R version 4.5.3 (2026-03-11)
Platform: aarch64-apple-darwin20
Running under: macOS Tahoe 26.4.1
Matrix products: default
BLAS: /Library/Frameworks/R.framework/Versions/4.5-arm64/Resources/lib/libRblas.0.dylib
LAPACK: /Library/Frameworks/R.framework/Versions/4.5-arm64/Resources/lib/libRlapack.dylib; LAPACK version 3.12.1
locale:
[1] C.UTF-8/C.UTF-8/C.UTF-8/C/C.UTF-8/C.UTF-8
time zone: America/Detroit
tzcode source: internal
attached base packages:
[1] stats graphics grDevices utils datasets methods base
other attached packages:
[1] ggrepel_0.9.8 scales_1.4.0 patchwork_1.3.1 viridis_0.6.5
[5] viridisLite_0.4.2 usmap_1.0.0 data.table_1.17.6 lubridate_1.9.4
[9] forcats_1.0.0 stringr_1.6.0 dplyr_1.1.4 purrr_1.2.0
[13] readr_2.1.5 tidyr_1.3.1 tibble_3.3.0 ggplot2_3.5.2
[17] tidyverse_2.0.0 ipumsr_0.10.0 workflowr_1.7.1
loaded via a namespace (and not attached):
[1] gtable_0.3.6 xfun_0.54 bslib_0.9.0 processx_3.8.6
[5] callr_3.7.6 tzdb_0.5.0 vctrs_0.6.5 tools_4.5.3
[9] ps_1.9.1 generics_0.1.4 proxy_0.4-27 pkgconfig_2.0.3
[13] KernSmooth_2.23-26 RColorBrewer_1.1-3 S7_0.2.1 lifecycle_1.0.4
[17] compiler_4.5.3 farver_2.1.2 git2r_0.36.2 getPass_0.2-4
[21] codetools_0.2-20 hipread_0.2.6 httpuv_1.6.16 class_7.3-23
[25] htmltools_0.5.8.1 sass_0.4.10 yaml_2.3.10 later_1.4.2
[29] pillar_1.11.1 jquerylib_0.1.4 whisker_0.4.1 classInt_0.4-11
[33] cachem_1.1.0 tidyselect_1.2.1 digest_0.6.37 stringi_1.8.7
[37] sf_1.0-21 labeling_0.4.3 rprojroot_2.1.1 fastmap_1.2.0
[41] grid_4.5.3 cli_3.6.5 magrittr_2.0.4 utf8_1.2.6
[45] dichromat_2.0-0.1 e1071_1.7-16 withr_3.0.2 promises_1.3.3
[49] timechange_0.3.0 rmarkdown_2.29 httr_1.4.7 gridExtra_2.3
[53] hms_1.1.3 evaluate_1.0.4 knitr_1.50 haven_2.5.5
[57] rlang_1.1.6 Rcpp_1.1.0 zeallot_0.2.0 DBI_1.2.3
[61] glue_1.8.0 xml2_1.3.8 usmapdata_1.0.0 rstudioapi_0.17.1
[65] jsonlite_2.0.0 R6_2.6.1 units_1.0-0 fs_1.6.6