Validation
Tina Lasisi
2021-05-05 12:46:29
Last updated: 2021-05-05
Checks: 7 0
Knit directory: 2020_HairPheno_manuscript/analysis/
This reproducible R Markdown analysis was created with workflowr (version 1.6.2). The Checks tab describes the reproducibility checks that were applied when the results were created. The Past versions tab lists the development history.
Great! Since the R Markdown file has been committed to the Git repository, you know the exact version of the code that produced these results.
Great job! The global environment was empty. Objects defined in the global environment can affect the analysis in your R Markdown file in unknown ways. For reproduciblity it’s best to always run the code in an empty environment.
The command set.seed(12345) was run prior to running the code in the R Markdown file. Setting a seed ensures that any results that rely on randomness, e.g. subsampling or permutations, are reproducible.
Great job! Recording the operating system, R version, and package versions is critical for reproducibility.
Nice! There were no cached chunks for this analysis, so you can be confident that you successfully produced the results during this run.
Great job! Using relative paths to the files within your workflowr project makes it easier to run your code on other machines.
Great! You are using Git for version control. Tracking code development and connecting the code version to the results is critical for reproducibility.
The results in this page were generated with repository version 1750869. See the Past versions tab to see a history of the changes made to the R Markdown and HTML files.
Note that you need to be careful to ensure that all relevant files for the analysis have been committed to Git prior to generating the results (you can use wflow_publish or wflow_git_commit). workflowr only checks the R Markdown file, but you know if there are other scripts or data files that it depends on. Below is the status of the Git repository when the results were generated:
Ignored files:
    Ignored:    .Rhistory
    Ignored:    .Rproj.user/
    Ignored:    output/.DS_Store
    Ignored:    output/knitr_docs/

Unstaged changes:
    Modified:   .DS_Store
Note that any generated files, e.g. HTML, png, CSS, etc., are not included in this status report because it is ok for generated content to have uncommitted changes.
These are the previous versions of the repository in which changes were made to the R Markdown (analysis/validation.Rmd) and HTML (docs/validation.html) files. If you’ve configured a remote Git repository (see ?wflow_git_remote), click on the hyperlinks in the table below to view the files as they were in that past version.
| File | Version | Author | Date | Message |
|---|---|---|---|---|
| html | 650ebff | tinalasisi | 2020-12-20 | Build site. |
| Rmd | 5f6c138 | tinalasisi | 2020-12-20 | wflow_publish("analysis/*", update = TRUE) |
| html | 68f0ec2 | tinalasisi | 2020-11-24 | Build site. |
| Rmd | 7ddd3f7 | tinalasisi | 2020-11-24 | Initial commit |
| html | 7ddd3f7 | tinalasisi | 2020-11-24 | Initial commit |
Curvature
Here, we will evaluate the accuracy of fibermorph in estimating the length and curvature of hair using simulated data. See simulation script here.
The simulated data can be found here.
We simulated arcs of various curvatures at a length of 1.57mm. There were 25 arcs per image.
Simulated vs. estimated curvature & length
To calculate the accuracy of our measurements, we compared the known parameters with the parameters estimated from our fibermorph package.
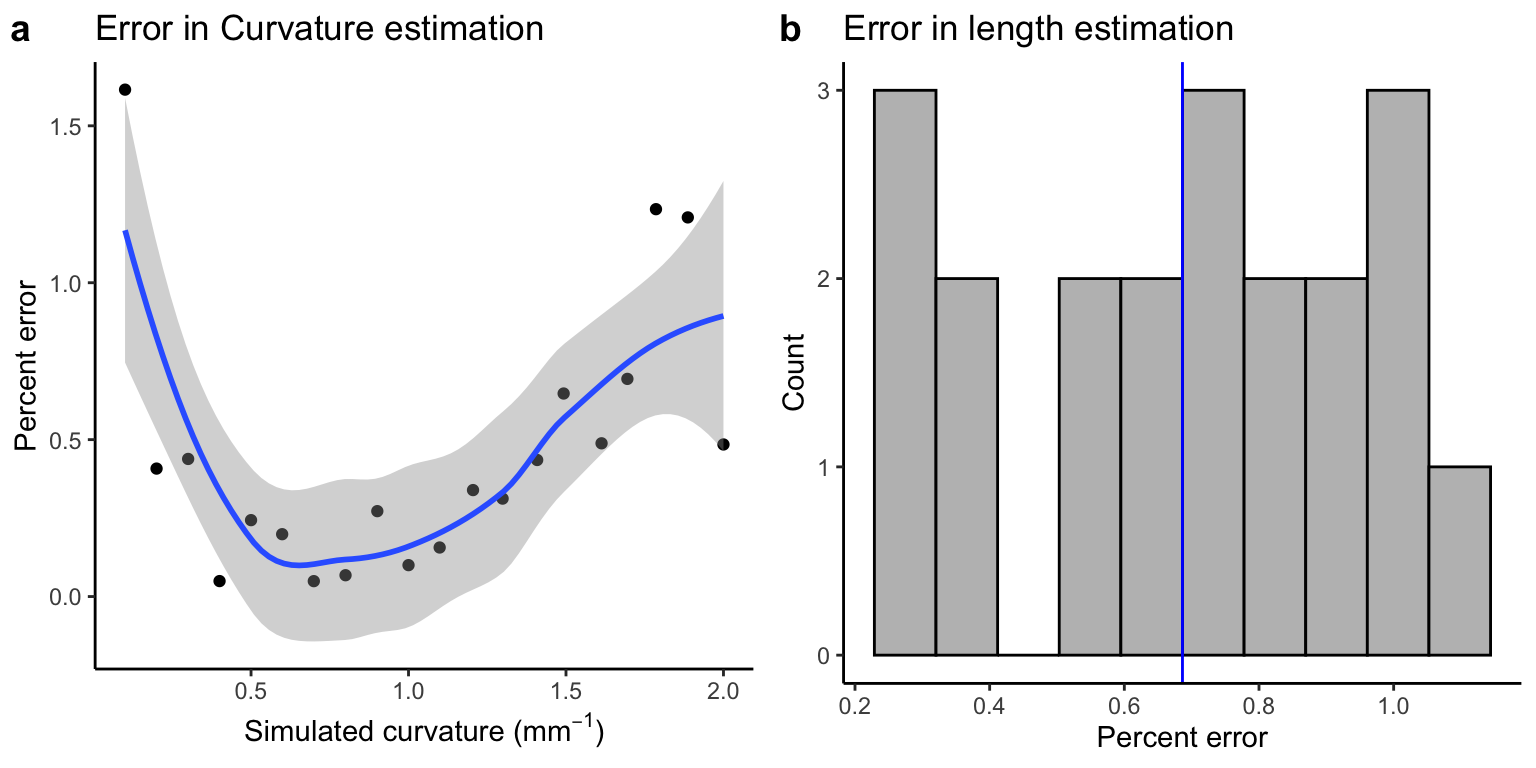
Error in estimated curvature and length
| Version | Author | Date |
|---|---|---|
| 7ddd3f7 | tinalasisi | 2020-11-24 |
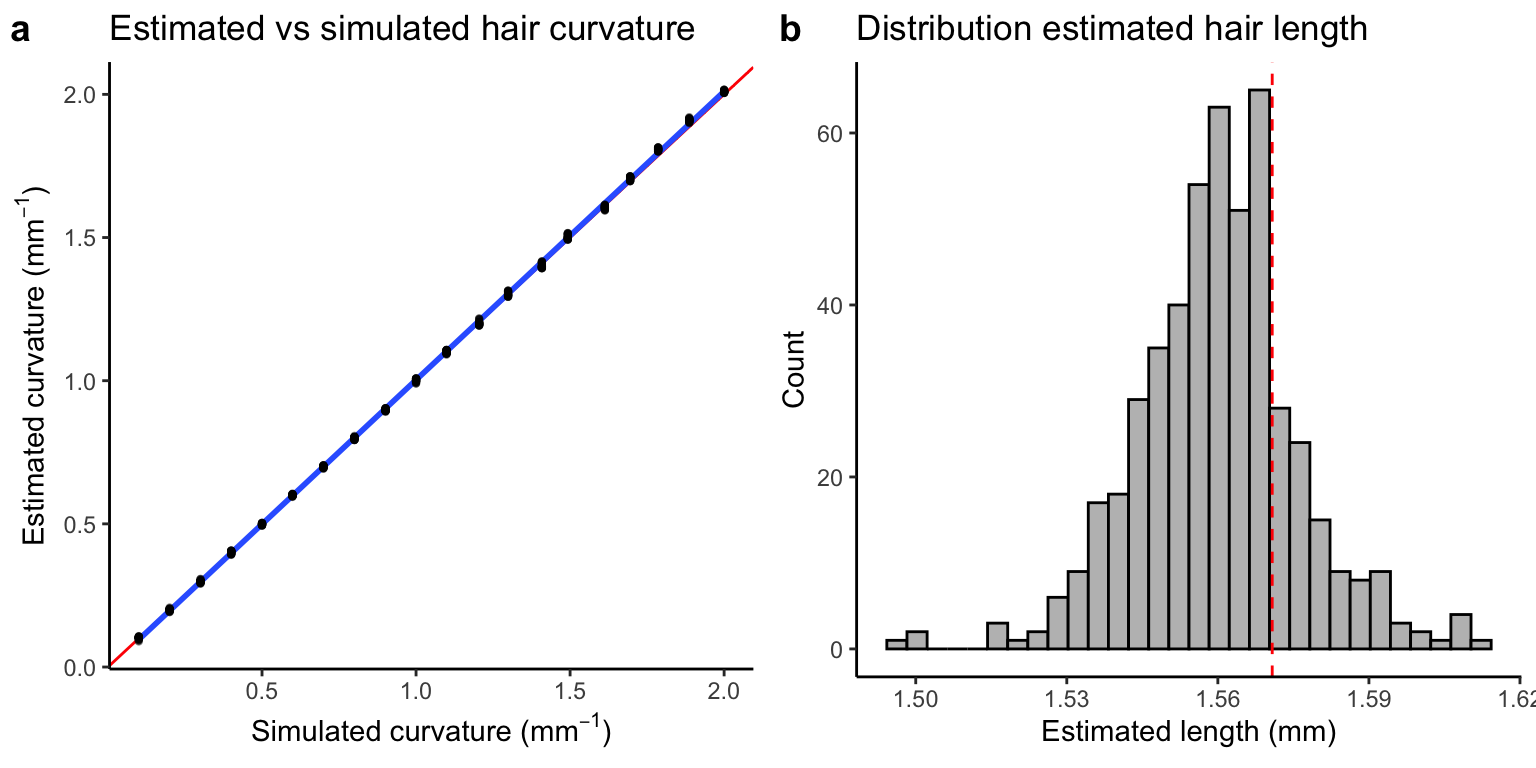
In Fig. 1a we see that there is a near perfect correlation between the simulated and estimated curvatures. Fig. 1b shows the distribution of estimated hair lengths around the simulated length (red line).
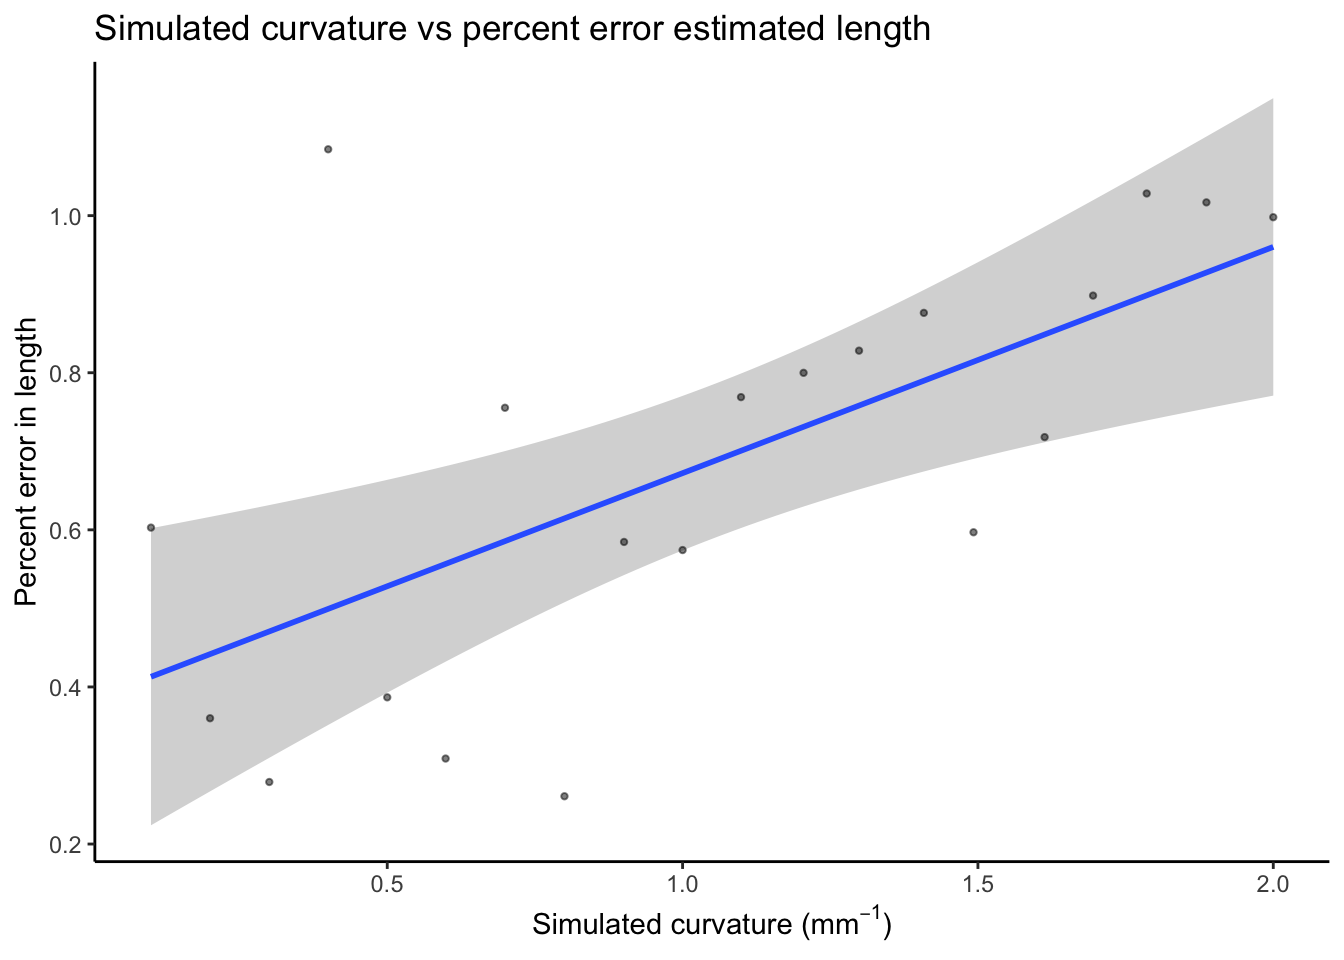
We plot simulated curvature against estimated length to show the distribution of estimated length as a function of curvature.
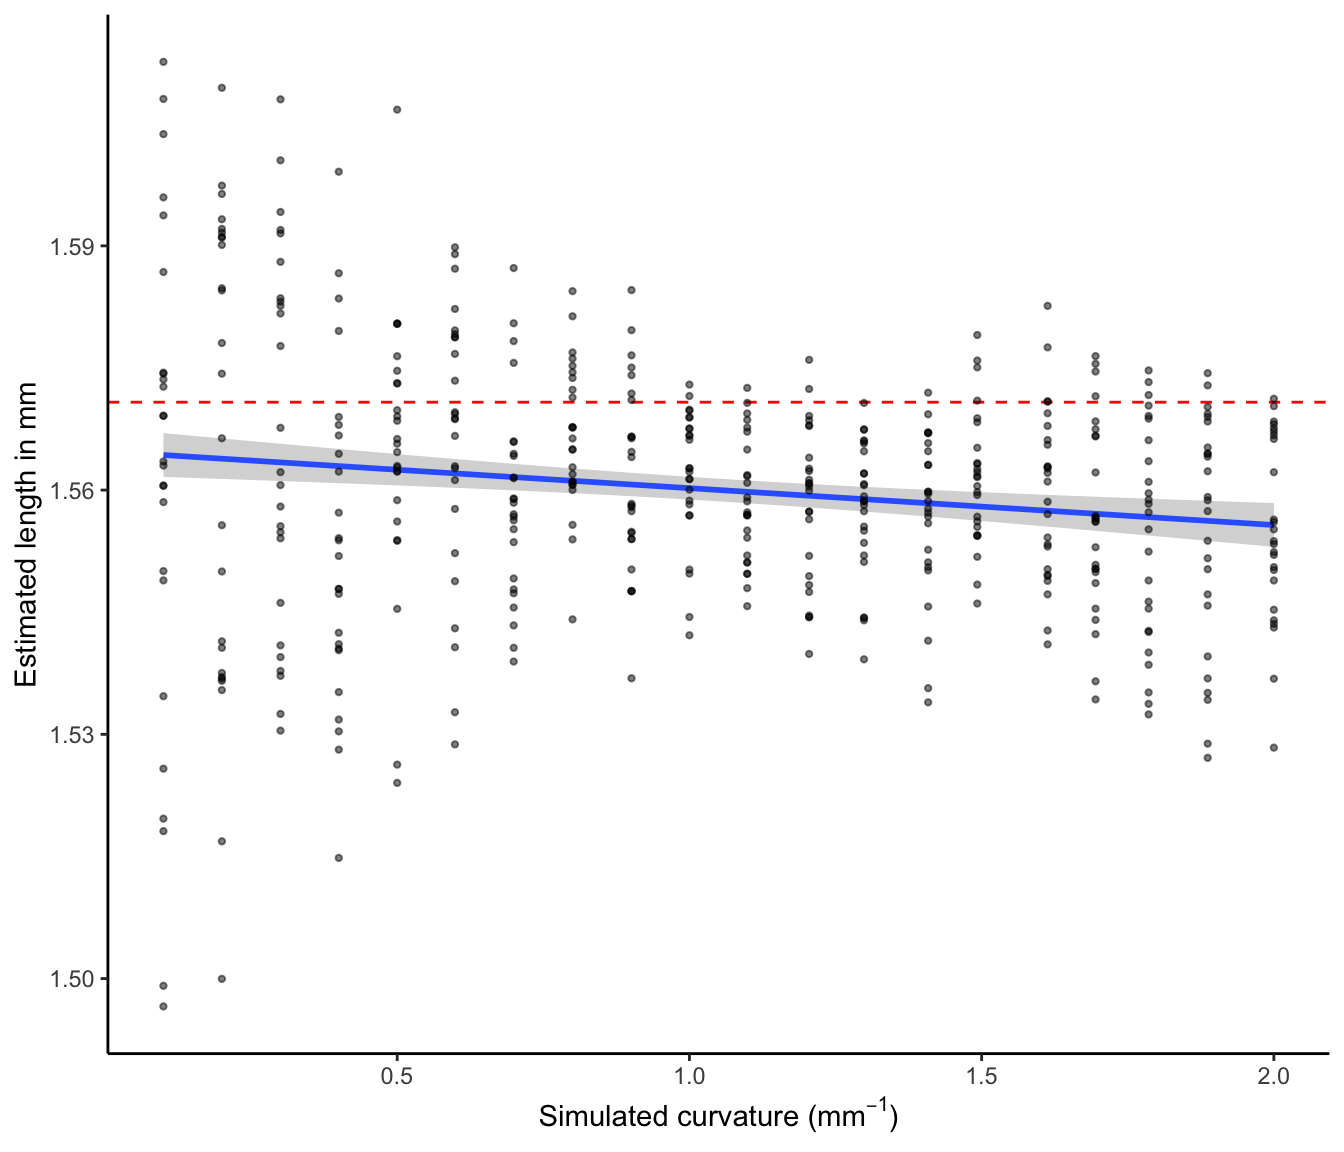
Simulated curvature vs estimated length
Figure 2 shows a broader range of error in the estimation of length in straighter hairs. This is likely a result of the majority of pixels being oriented in a manner that causes a divergence between the pixel length (number of pixels) and the real length that is being measured. We apply a correction for this known issue in image analysis, however, it is expected that there will still be some error. Note that each point in this figure represents an individual hair fragment within an image. This supports the notion that it is not the low curvature per se, but rather the combination of low curvature and specific orientations that increases the error in length estimation.
Measurement error in curvature and length
In addition to the correlations between simulated and estimated parameters, we calculate root mean square error (RMSE) and percent error as alternatives to investigate the measurement error of our package.
NB: we present the data summarized for each image (i.e. all 25 fragments) as we cannot provide a hair fragment to hair fragment comparison.
Error statistics
Below, we calculate the mean error values for both RMSE and percent error.
| var | mean.rmse | perent.error |
|---|---|---|
| curvature | 0.0002210 | 0.4720430 |
| length | 0.0004312 | 0.6863358 |
| radius | 0.0004624 | 0.4626120 |
We see less than 1% error across the variables and RMSE of less than 0.0005.
Below, we plot the data.
Root mean square error
First, we plot the root mean square error for curvature and length.
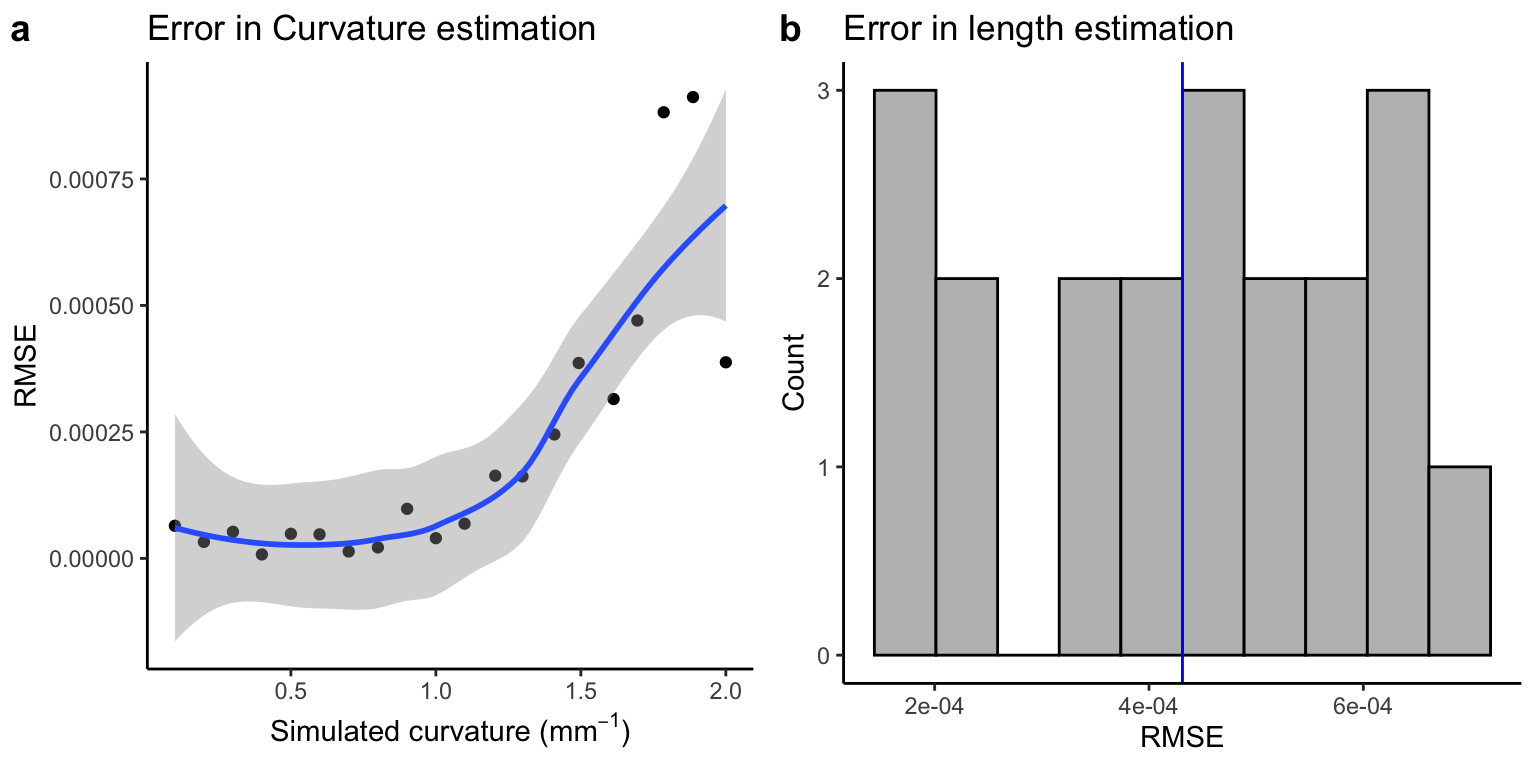
Root mean square error for curvature and length
| Version | Author | Date |
|---|---|---|
| 7ddd3f7 | tinalasisi | 2020-11-24 |
We then examine the relationship between curvature and RMSE of length
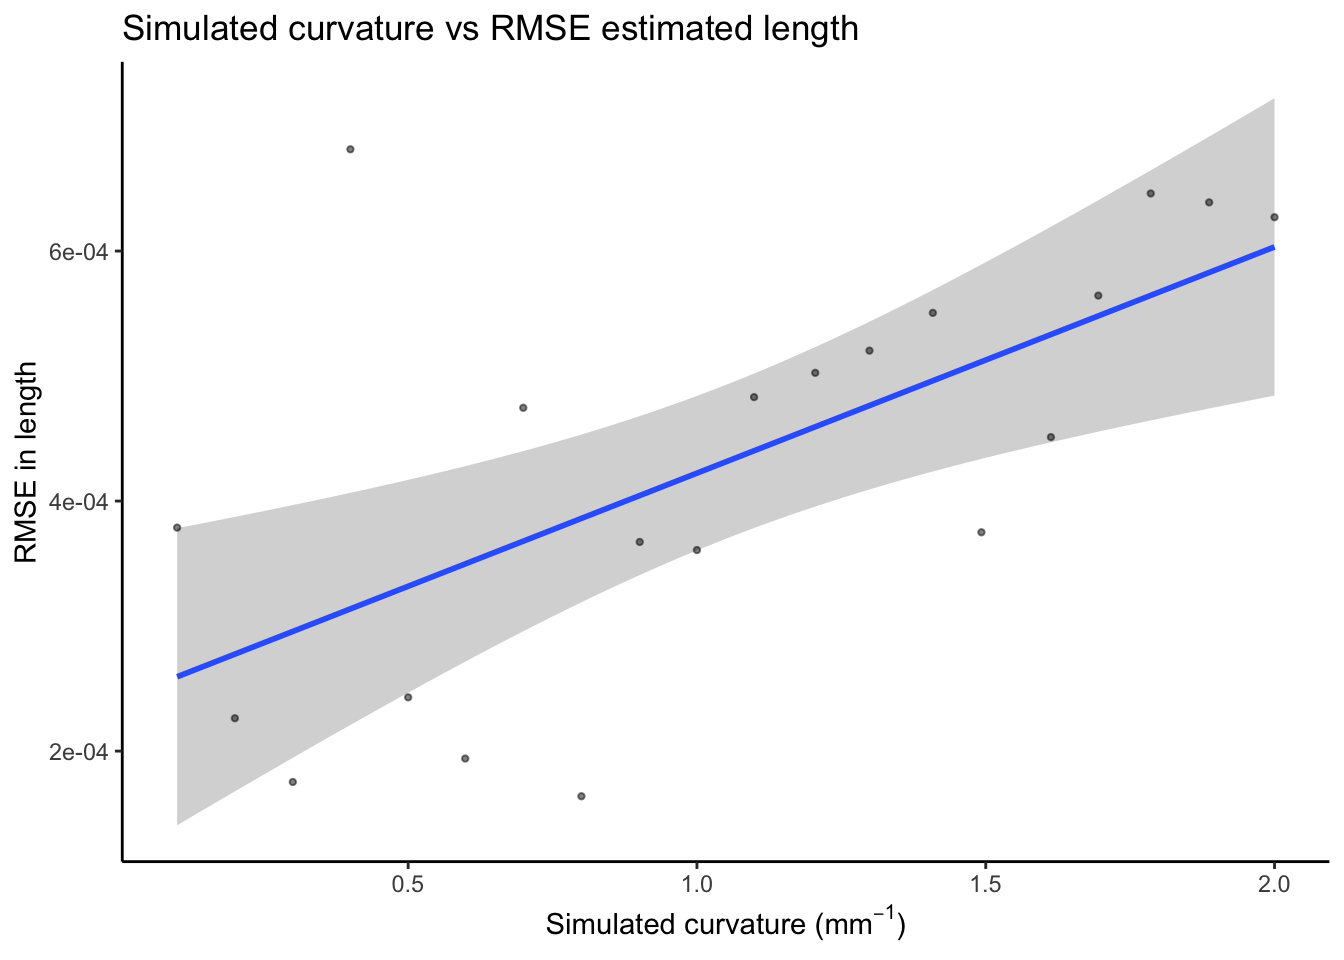
Correlation between curvature and RMSE for length
| Version | Author | Date |
|---|---|---|
| 7ddd3f7 | tinalasisi | 2020-11-24 |
We observe an increase in RMSE with curvature.
Percent error
Below we plot the percent error for curvature and length.
Percent error for curvature and length
| Version | Author | Date |
|---|---|---|
| 7ddd3f7 | tinalasisi | 2020-11-24 |
Correlation between curvature and percent error for estimated length
| Version | Author | Date |
|---|---|---|
| 7ddd3f7 | tinalasisi | 2020-11-24 |
Here we see that error appears to increase slightly with curvature if considering the data in terms of percent error.
Cross-section
The fibermorph section function estimates area, minimum diameter, maximum diameter and eccentricity for a given cross-sectional image. We tested the measurement error using randomly generated circles and non-circular ellipses.
Correlation between simulated and estimated section parameters
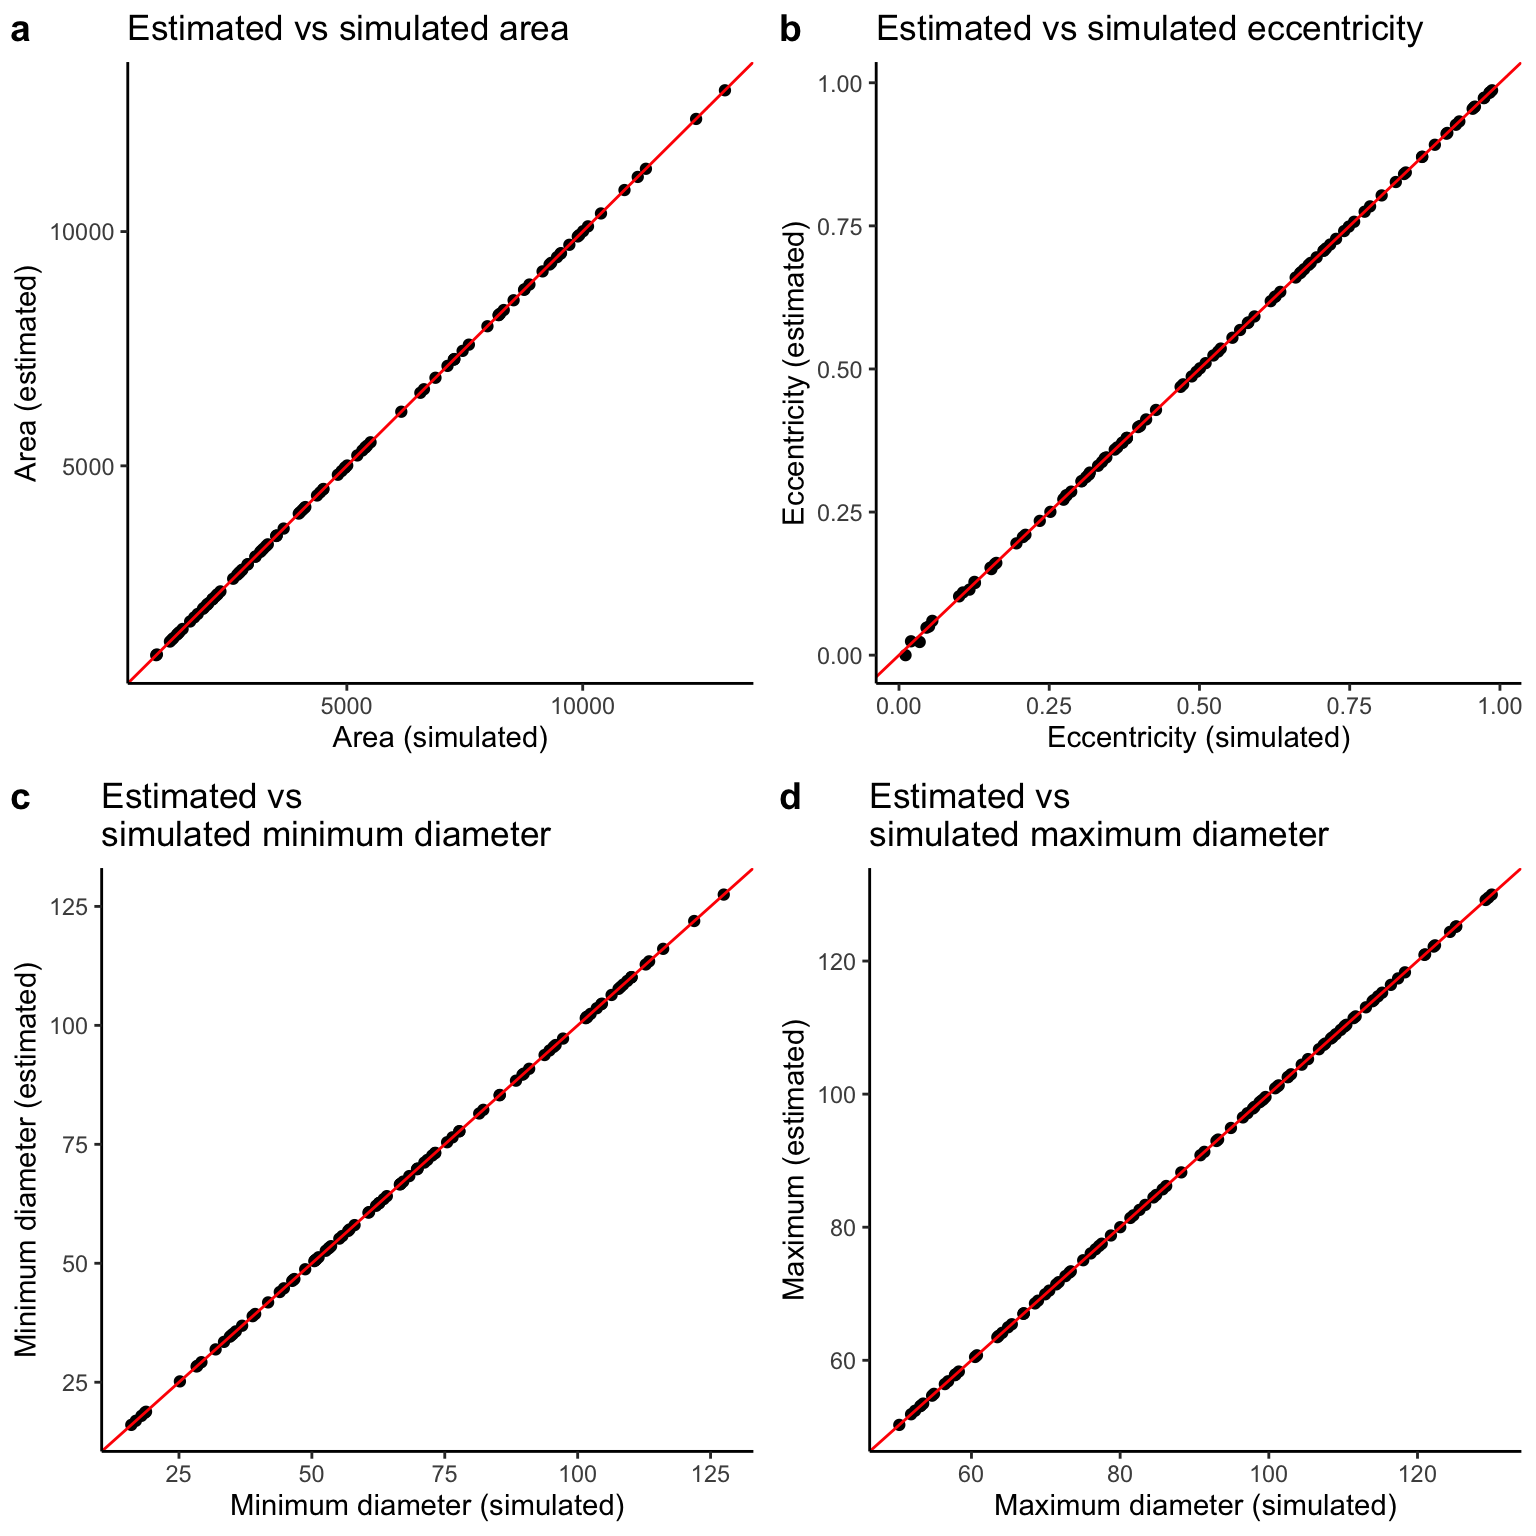
FCorrelation between simulated and estimated cross-sectional parameters
| Version | Author | Date |
|---|---|---|
| 7ddd3f7 | tinalasisi | 2020-11-24 |
We see strong correlations between the estimated and simulated values for each cross-sectional parameter.
Measurement error for cross-sectional parameters
We calculate the percent error and RMSE for the cross-sectional parameters.
First, we calculate mean error values for all parameters.
| var | mean_rmse | perent_error |
|---|---|---|
| area | 0.5136320 | 0.0137703 |
| eccentricity | 0.0007514 | Inf |
| max | 0.0097800 | 0.0120605 |
| min | 0.0080884 | 0.0136924 |
Percent error is considerably under 0.02% for each of the parameters with RMSE under 0.01 for all but area.
As one of the simulated ellipses was a circle with an eccentricity of 0, any deviation from this produces an infinite percent error. So below we present the values removing this observation.
| var | mean_rmse | perent_error |
|---|---|---|
| area | 0.5136320 | 0.0137703 |
| eccentricity | 0.0006492 | 1.0066337 |
| max | 0.0097800 | 0.0120605 |
| min | 0.0080884 | 0.0136924 |
Root mean square error
Below, we plot RMSE as a function of each parameter.
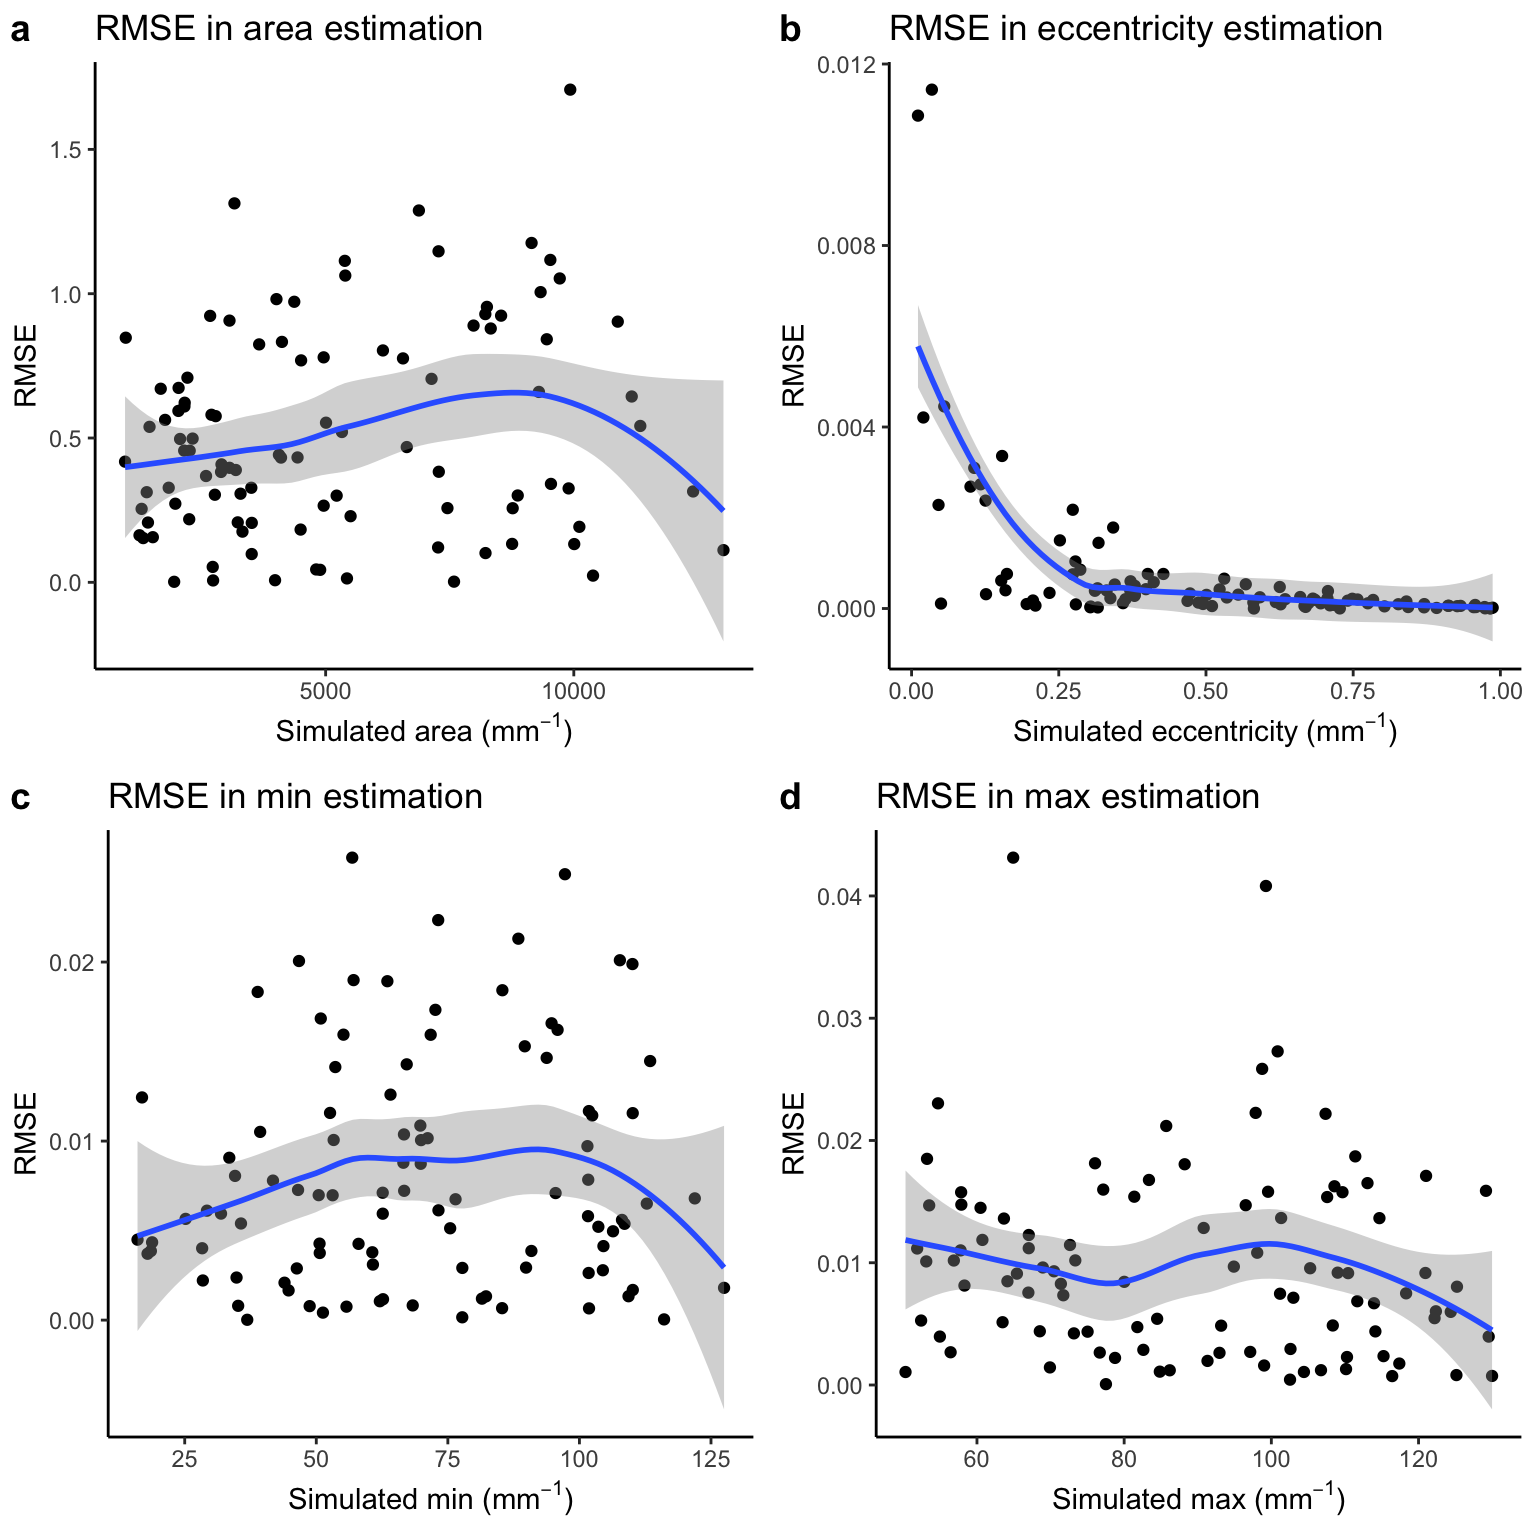
Correlation between simulated and RMSE for cross-sectional parameters
| Version | Author | Date |
|---|---|---|
| 7ddd3f7 | tinalasisi | 2020-11-24 |
There does not appear to be any overarching pattern in RMSE across the variables.
Percent error
Below we plot the correlation between simulated values and percent error for each parameter.
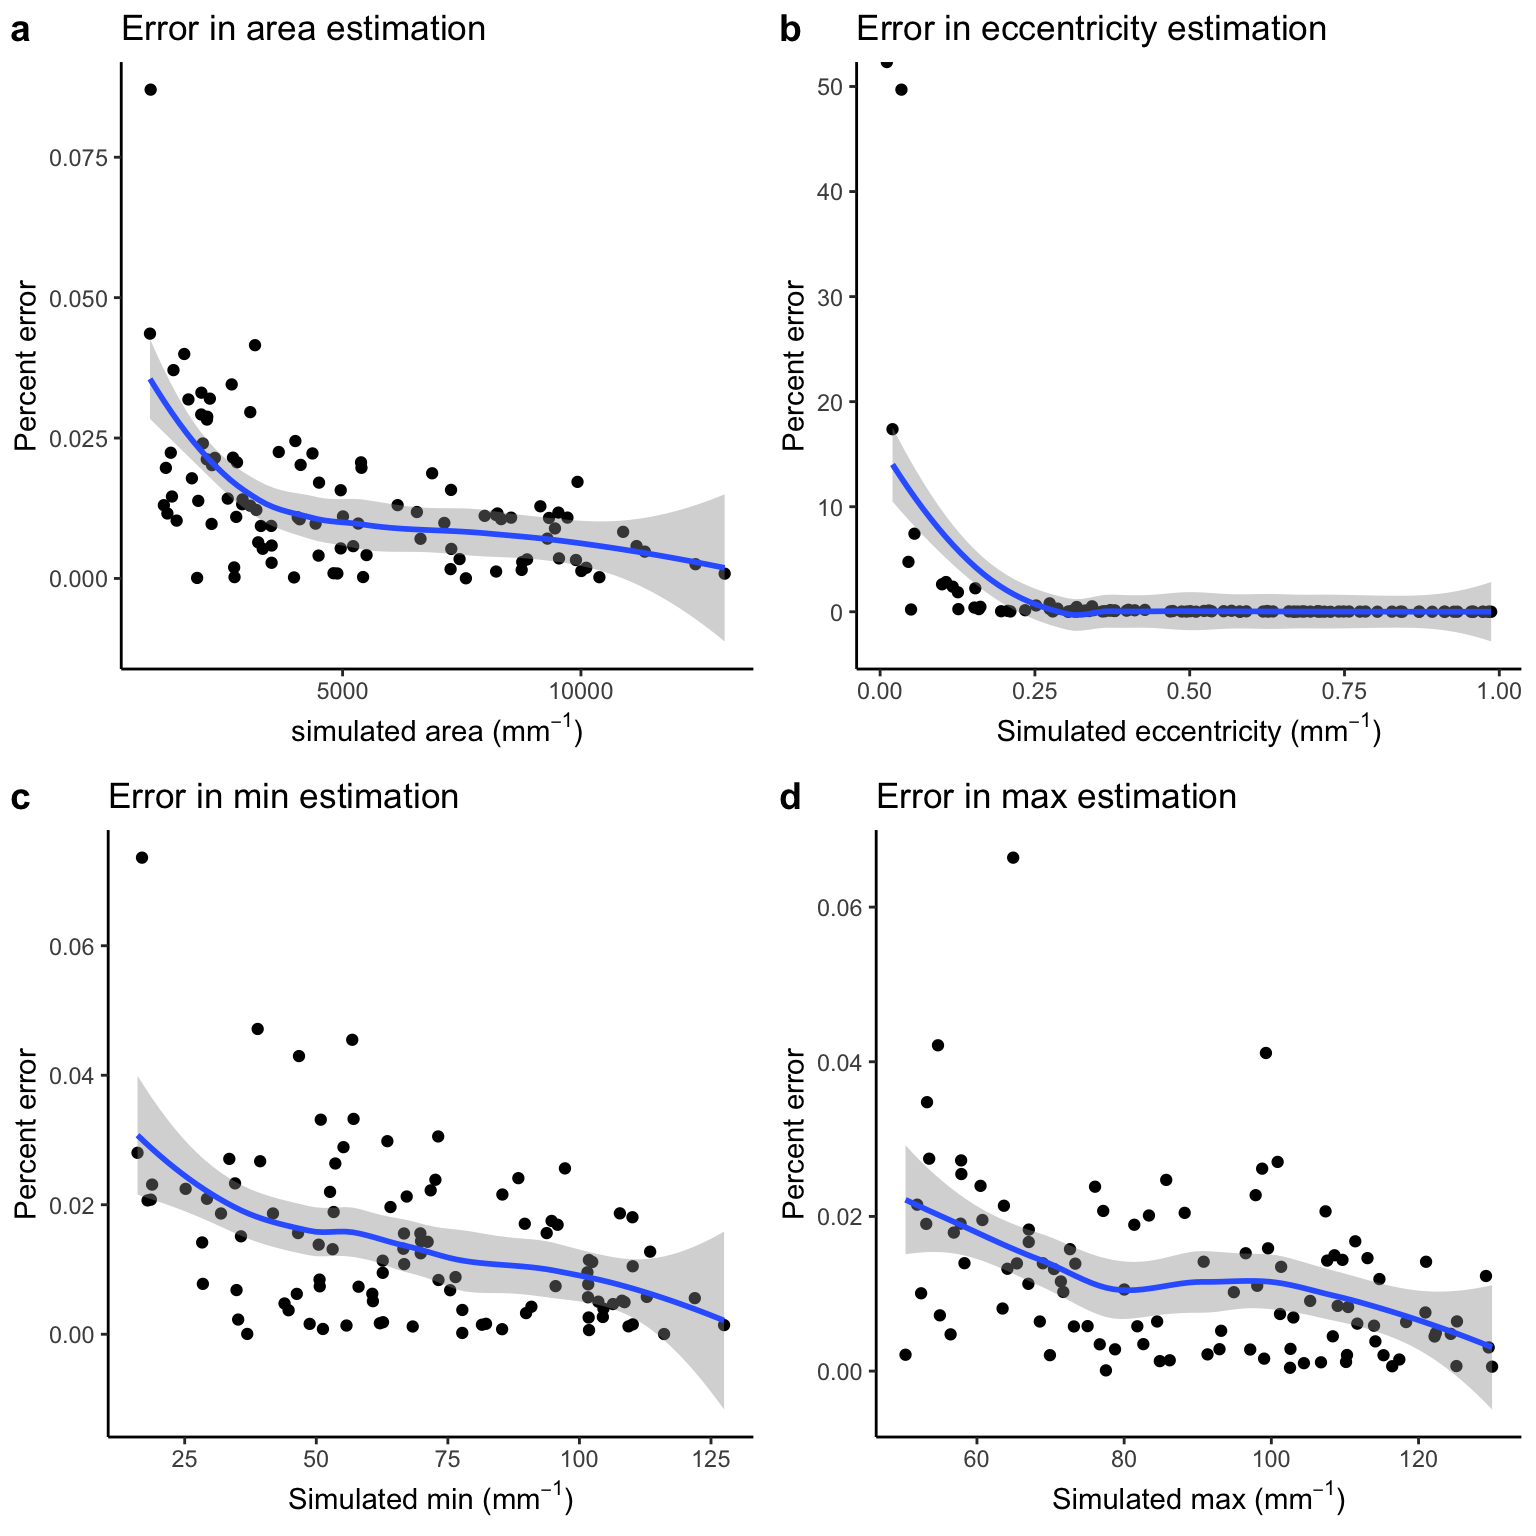
Correlation between simulated and percent error cross-sectional parameters
| Version | Author | Date |
|---|---|---|
| 7ddd3f7 | tinalasisi | 2020-11-24 |
We observe a general decrease in percent error for each parameter.
R version 4.0.4 (2021-02-15)
Platform: x86_64-apple-darwin17.0 (64-bit)
Running under: macOS Mojave 10.14.6

Matrix products: default
BLAS:   /Library/Frameworks/R.framework/Versions/4.0/Resources/lib/libRblas.dylib
LAPACK: /Library/Frameworks/R.framework/Versions/4.0/Resources/lib/libRlapack.dylib

locale:
[1] en_US.UTF-8/en_US.UTF-8/en_US.UTF-8/C/en_US.UTF-8/en_US.UTF-8

attached base packages:
[1] stats     graphics  grDevices utils     datasets  methods   base

other attached packages:
 [1] data.table_1.14.0 reshape2_1.4.4    truncnorm_1.0-8   knitr_1.31
 [5] cowplot_1.1.1     forcats_0.5.1     stringr_1.4.0     dplyr_1.0.5
 [9] purrr_0.3.4       readr_1.4.0       tidyr_1.1.3       tibble_3.1.0
[13] ggplot2_3.3.3     tidyverse_1.3.0

loaded via a namespace (and not attached):
 [1] httr_1.4.2        sass_0.3.1        jsonlite_1.7.2    viridisLite_0.3.0
 [5] splines_4.0.4     modelr_0.1.8      bslib_0.2.4       assertthat_0.2.1
 [9] highr_0.8         cellranger_1.1.0  yaml_2.2.1        pillar_1.5.1
[13] backports_1.2.1   lattice_0.20-41   glue_1.4.2        digest_0.6.27
[17] promises_1.2.0.1  rvest_1.0.0       colorspace_2.0-0  htmltools_0.5.1.1
[21] httpuv_1.5.5      Matrix_1.3-2      plyr_1.8.6        pkgconfig_2.0.3
[25] broom_0.7.5       haven_2.3.1       scales_1.1.1      whisker_0.4
[29] later_1.1.0.1     git2r_0.28.0      mgcv_1.8-34       generics_0.1.0
[33] farver_2.1.0      ellipsis_0.3.1    withr_2.4.1       cli_2.3.1
[37] magrittr_2.0.1    crayon_1.4.1      readxl_1.3.1      evaluate_0.14
[41] fs_1.5.0          fansi_0.4.2       nlme_3.1-152      xml2_1.3.2
[45] tools_4.0.4       hms_1.0.0         lifecycle_1.0.0   munsell_0.5.0
[49] reprex_1.0.0      compiler_4.0.4    jquerylib_0.1.3   rlang_0.4.10
[53] grid_4.0.4        rstudioapi_0.13   labeling_0.4.2    rmarkdown_2.7
[57] gtable_0.3.0      DBI_1.1.1         R6_2.5.0          lubridate_1.7.10
[61] utf8_1.2.1        workflowr_1.6.2   rprojroot_2.0.2   stringi_1.5.3
[65] Rcpp_1.0.6        vctrs_0.3.6       dbplyr_2.1.0      tidyselect_1.1.0
[69] xfun_0.22